
|
시장보고서
상품코드
1730125
mPOS 단말기 및 소프트 POS 시장(2025-2030년)Global mPOS Terminals & Soft POS Market: 2025-2030 |
||||||
"소프트 POS 거래액, 2030년까지 2,150% 성장률로 가속화 : 소규모 사업자의 On-the-go 거래 재정의"
| 주요 통계 | |
|---|---|
| 2030년 mPOS 단말기 총거래액 : | 49억 달러 |
| 2030년 소프트 POS 단말기 총거래액 : | 5,400억 달러 |
| 2025-2030년 소프트 POS 시장 성장률 : | 2,150% |
| 예측 기간 : | 2025-2030년 |
개요
mPOS 단말기 및 소프트 POS 시장에 대한 상세하고 통찰력 있는 분석을 통해 POS 하드웨어 제조업체, 결제 인프라 제공업체, 소프트웨어 개발자, 호텔 및 소매업체 등 이해관계자들이 향후 성장, 주요 동향, 경쟁 환경을 파악할 수 있도록 합니다.
이 제품군에는 POS의 미래 성장을 매핑하는 데이터에 대한 액세스, 최신 시장 동향과 기회를 파악할 수 있는 직관적인 조사, mPOS 단말기 및 소프트 POS 분야의 27개 시장 리더에 대한 광범위한 분석이 포함된 문서 등이 포함되어 있습니다. 이 조사 자료집은 타의 추종을 불허하는 포괄성으로 인해 이 고성장 시장의 미래를 그려볼 수 있는 매우 유용한 자료가 되고 있습니다.
주요 특징
- 시장 역학:시장 상황에 대한 폭넓은 인사이트를 바탕으로 다양한 형태의 POS와 그 구체적인 이용 사례를 분석합니다. 또한 소프트 POS가 mPOS에 미치는 위협과 스마트 POS 시스템에 내장된 강화된 기능이 이러한 위협을 완화하는 데 어떻게 도움이 될 수 있는지를 평가합니다. 이 보고서에는 부문 분석이 포함되어 있으며, 6개의 서로 다른 산업 부문에서 mPOS 단말기와 소프트 POS가 직면한 기회와 과제를 분석합니다. 이 보고서는 mPOS 및 소프트 POS 벤더의 고성장 시장과 잠재적인 지역을 식별하는 국가별 준비도 지수로 마무리됩니다.
- 주요 요점 및 전략적 제안:POS 시장의 주요 개발 기회와 주요 발견을 상세하게 분석하고, 이해관계자를 위한 주요 전략적 제안을 담고 있습니다.
- 벤치마크 산업 예측 :POS 도입 및 사용에 관한 5개년 시장 예측을 게재하고, 6가지 유형의 POS(전용 POS, 비접촉식 POS, mPOS, 생체 인식 POS, 스마트 POS, 소프트 POS)의 설치 기반, 거래 건수, 거래 금액에 대한 분석이 포함되어 있습니다. 예측에는 POS 소프트웨어 시스템 채택과 수익도 포함되어 있습니다.
- Juniper Research의 경쟁사 순위표:27개 주요 POS 벤더의 역량을 평가했습니다.
SAMPLE VIEW
시장 데이터 & 예측 보고서
샘플
시장 동향 및 전략 보고서

시장 데이터 & 예측 보고서
POS 단말기 시장을 선도하는 리서치 제품군에는 101개의 표와 46,000개 이상의 데이터 포인트에 대한 예측 데이터 세트에 대한 액세스가 포함되어 있습니다. 조사 제품군에는 다음과 같은 지표가 포함되어 있습니다.
- POS 단말기 총 설치 기반
- POS 총 거래 건수
- POS 거래 총액
이러한 지표는 다음과 같은 주요 시장에 대해 제공됩니다.
- 전용 POS
- 비접촉식 POS
- mPOS
- 생체인식 POS
- 스마트 POS
- 소프트 POS
Juniper Research의 인터랙티브 예측(Excel)은 다음과 같은 기능을 제공합니다.
- 통계 분석 :데이터 기간 동안 모든 지역과 국가에 대해 표시되며, 특정 지표를 검색할 수 있습니다. 그래프는 쉽게 수정할 수 있으며, 클립보드로 내보낼 수 있습니다.
- 국가별 데이터 도구:이 도구에서는 예측 기간 동안 모든 지역과 국가의 지표를 볼 수 있습니다. 검색창을 통해 표시되는 지표를 좁힐 수 있습니다.
- 국가별 비교 도구:국가를 선택하여 비교할 수 있습니다. 이 도구에는 그래프를 내보내는 기능이 포함되어 있습니다.
- What-if 분석 :5가지 인터랙티브 시나리오를 통해 예측 지표를 자신의 가정 조건과 비교할 수 있습니다.
시장 동향 및 전략 보고서
이 보고서는 mPOS 단말기 및 소프트 POS 시장 동향을 자세히 조사하고, 이 급성장하는 시장의 진화를 형성하는 시장 동향과 요인을 평가하고, mPOS 단말기 및 소프트 POS 벤더의 전략적 기회를 종합적으로 분석하고, 주요 업종과 개발 과제, 이해관계자가 이를 어떻게 극복해야 하는지를 다루고 있습니다.
목차
시장 동향과 전략
제1장 중요 포인트와 전략적 제안
- 중요 포인트
- 전략적 제안
제2장 시장 요약
- 서론
- 정의와 범위
- 전용 POS
- mPOS
- 비접촉 POS
- 스마트 POS
- 생체인식 POS
- 얼굴 스캔
- 지문 인식
- 손바닥 인식
- 새로운 생체인식
- 홍채
- 망막
- 정맥 패턴 인식
- 생체인식 과제
- 보안과 프라이버시에 관한 우려
- 시행상 과제
- 사용자 경험 문제
- 운영상 및 재무상 장벽
- 소프트 POS
- 다양한 POS 이용 사례
- 성장 촉진요인과 제약
- 대체 캐쉬리스 사회
- 생체인식 POS 시장
- 소비자 구매 행동의 진화
- 강화된 기능
- 스마트 POS : 치열해지는 경쟁 해결책
- 소프트 POS
- 서론
- 시장 구도
- 전용 POS와 모바일 POS에 대한 위협
- 소프트 POS가 직면하는 과제
- 향후 전망
제3장 부문 분석
- 부문 분석 상황
- 호스피탈리티 및 다이닝
- 여행 및 운송
- 퀵서비스 레스토랑
- 연료 및 무인
- 중소기업 및 전문 서비스
- 이벤트 및 스타디움
제4장 국가별 준비 지수와 지역 분석
- 국가별 준비 지수
- 주목 시장
- 성장 시장
- 신흥 국가 시장
- 포화 시장
경쟁 리더보드
제1장 Juniper Research POS 단말기 경쟁 리더보드
제2장 mPOS : 경쟁 리더보드
- mPOS 벤더 개요
- Epos Now
- Fiserv
- Global Payments
- Lightspeed
- Mswipe
- NEXGO
- Newland NPT
- PAX
- PayPal
- Posiflex
- Square(Block)
- SumUp
- Toast
- Verifone
- Worldline
- 평가 방법
- 제한 및 분석
제3장 소프트 POS 경쟁 리더보드
- 소프트 POS 벤더 개요
- alcineo
- Apple
- CM.com
- Fiserv
- MagicCube
- Mypinpad
- Paypal
- Payten
- Square
- Stripe
- Tidypay
- Wizzit
- Worldline
- Worldpay
- 조사 방법
- 평가 방법
- 제한 및 분석
- 관련 조사
데이터와 예측
제1장 시장 예측
제2장 시장 요약
- POS 단말기 시장
- 설치 기반
- 거래량
- 거래액
제3장 비접촉 POS
- 설치 기반
- 거래량
- 거래액
제4장 mPOS
- 설치 기반
- 거래액
제5장 소프트 POS
- 설치 기반
- 거래량
- 거래액
'Soft POS Transactions to Accelerate by 2,150% in Value by 2030; Redefining On-the-go Transactions for Small Businesses'
| KEY STATISTICS | |
|---|---|
| Total mPOS terminal transaction value in 2030: | $4.9tn |
| Total soft POS terminal transaction value in 2030: | $540 bn |
| 2025 to 2030 soft POS market growth: | 2150% |
| Forecast period: | 2025-2030 |
Overview
Our "mPOS Terminals & Soft POS" market research suite provides detailed and insightful analysis of this evolving market; enabling stakeholders, from POS hardware manufacturers, payment infrastructure providers, software developers, and hospitality and retail vendors, to understand future growth, key trends and the competitive environment.
The suite includes several different options that can be purchased separately, including access to data mapping the future growth of POS, an intuitive study uncovering the latest trends and opportunities within the market, and a document containing extensive analysis of the 27 market leaders within the mPOS terminals & soft POS space. The coverage can also be purchased as a Full Research Suite, containing all these elements, and including a substantial discount.
Collectively, they provide a critical tool for understanding this rapidly emerging market; allowing POS manufacturers and technology vendors to shape their future strategy. Its unparalleled coverage makes this research suite an incredibly useful resource for charting the future of such a high-growth market.
All report content is delivered in the English language.
Key Features
- Market Dynamics: Extensive insight into the market landscape; analysing the various forms of POS and their specific use cases. This section also assesses the threat that soft POS poses to mPOS, as well as how the enhanced features embedded within smart POS systems can help alleviate this threat. The report includes a segment analysis which looks at the opportunities and challenges faced by mPOS terminals and soft POS across six distinct industry segments. This document concludes with a Country Readiness Index, which identifies high-growth markets and potential regions for mPOS & soft POS vendors.
- Key Takeaways & Strategic Recommendations: In-depth analysis of key development opportunities and key findings within the POS market, accompanied by key strategic recommendations for stakeholders.
- Benchmark Industry Forecasts: 5-year market forecasts for POS adoption and use, including a breakdown of the installed base, transaction volume, and transaction value for the six different types of POS: dedicated POS, contactless POS, mPOS, biometric POS, smart POS and soft POS. The forecast also contains adoption and revenue for POS software systems.
- Juniper Research Competitor Leaderboard: Key player capability and capacity assessment for 27 POS vendors, via two Juniper Research Competitor Leaderboard; separating mPOS and soft POS.
SAMPLE VIEW
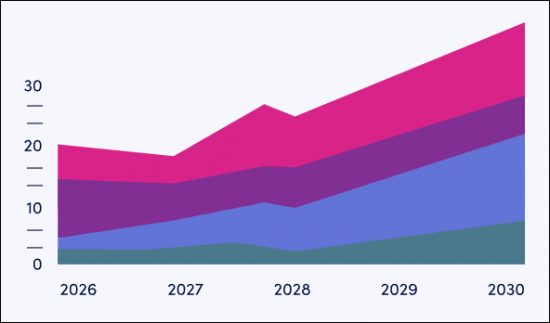
Market Data & Forecasting Report

The numbers tell you what's happening, but our written report details why, alongside the methodologies.
Pic.SAMPLE VIEW
Market Trends & Strategies Report
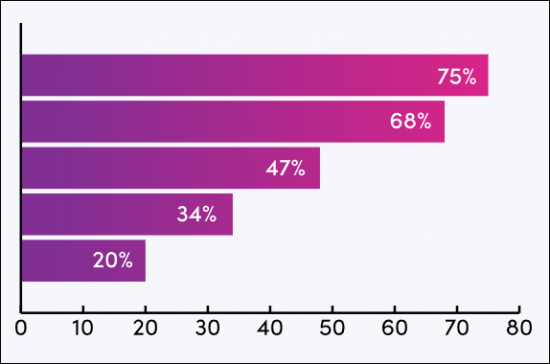
A comprehensive analysis of the current market landscape, alongside strategic recommendations.
Market Data & Forecasting Report
The market-leading research suite for the POS Terminals market includes access to the full set of forecast data of 101 tables and over 46,000 datapoints. Metrics in the research suite include:
- Total POS Terminals Installed Base
- Total POS Transaction Volume
- Total POS Transaction Value
These metrics are provided for the following key market verticals:
- Dedicated POS
- Contactless POS
- mPOS
- Biometric POS
- Smart POS
- Soft POS
Juniper Research Interactive Forecast Excel contains the following functionality:
- Statistics Analysis: Users benefit from the ability to search for specific metrics, displayed for all regions and countries across the data period. Graphs are easily modified and can be exported to the clipboard.
- Country Data Tool: This tool lets users look at metrics for all regions and countries in the forecast period. Users can refine the metrics displayed via a search bar.
- Country Comparison Tool: Users can select countries and compare countries. The ability to export graphs is included in this tool.
- What-if Analysis: Here, users can compare forecast metrics against their own assumptions, featuring 5 interactive scenarios.
Market Trends & Strategies Report
This report examines the "mPOS Terminals & Soft POS" market landscape in detail; assessing market trends and factors shaping the evolution of this rapidly growing market. The report delivers comprehensive analysis of the strategic opportunities for mPOS terminals & soft POS vendors; addressing key verticals and developing challenges, and how stakeholders should navigate these. It also includes evaluation of key country-level opportunities for POS vendors.
Competitor Leaderboard Report
The Competitor Leaderboard report provides a detailed evaluation and market positioning for 27 leading vendors in the "mPOS Terminals & Soft POS" space split into two Competitor Leaderboards, one for traditional and one for soft POS. The vendors are positioned either as an established leader, leading challenger, or disruptor and challenger, based on capacity and capability assessments.
Juniper Research Competitor Leaderboard for mPOS:
|
|
Juniper Research Competitor Leaderboard for soft POS:
|
|
This document is centred around the Juniper Research Competitor Leaderboard; a vendor positioning tool that provides an at-a-glance view of the competitive landscape in a market, backed by a robust methodology.
Table of Contents
Market Trends & Strategies
1. Key Takeaways & Strategic Recommendations
- 1.1. Key Takeaways
- 1.2. Strategic Recommendations
2. Market Summary
- 2.1. Introduction
- 2.1.1. Definitions and Scope
- Figure 2.1: Types of POS
- 2.1.2. Dedicated POS
- 2.1.3. mPOS
- 2.1.4. Contactless POS
- Figure 2.2: Different POS Technologies
- 2.1.5. Smart POS
- Figure 2.3: Smart POS
- 2.1.6. Biometric POS
- Figure 2.4: Biometric POS Scanning Capabilities
- i. Face Scanning
- ii. Fingerprint Recognition
- iii. Palm Recognition
- 2.1.7. Emerging Biometrics
- i. Iris
- ii. Retina
- iii. Vein Pattern Recognition
- 2.1.8. Biometrics Challenges
- i. Security and Privacy Concerns
- ii. Implementation Challenges
- iii. User Experience Issues
- iv. Operational and Financial Barriers
- 2.1.9. Soft POS
- Figure 2.5: How to Use Soft POS
- 2.1.1. Definitions and Scope
- 2.2. Use Cases for Various POS
- 2.2.1. Superstores and Large Retailers
- i. QR Codes
- 2.2.2. Small Sum Fixed Point Transaction Environments
- 2.2.3. Mobile Retail Environments
- 2.2.1. Superstores and Large Retailers
- 2.3. Drivers and Constraints
- 2.3.1. Alternative Cashless Society
- 2.3.2. Biometric POS Markets
- 2.3.3. Evolving Consumer Shopping Behaviour
- 2.3.4. Enhanced Features
- 2.3.5. Smart POS: The Solution to Increasing Competition
- Figure 2.6: Smart POS Business Integrations
- i. Inventory Management
- ii. CRM and Loyalty Programmes
- iii. eCommerce Integration
- iv. Employee Management
- v. Data and Analytics
- vi. Integrated Payment Processing
- 2.4. Soft POS
- i. Introduction
- Figure 2.7: Global Soft POS Transaction Volume ($m), Split by 8 Key Regions, 2025-2030
- 2.4.2. Market Landscape
- 2.4.3. Threat to Dedicated POS and Mobile POS
- 2.4.4. Challenges Facing Soft POS
- 2.4.5. Future Outlook
- i. Introduction
3. Segment Analysis
- 3.1. Segment Analysis Landscape
- Figure 3.1: POS Terminals' Key Leading and High-potential Industry Segments
- 3.1.1. Hospitality & Dining
- i. Opportunities
- ii. Challenges
- 3.1.2. Travel & Transportation
- i. Opportunities
- ii. Challenges
- 3.1.3. Quick-service Restaurants
- i. Opportunities
- ii. Challenges
- 3.1.4. Fuel & Unattended
- i. Opportunities
- ii. Challenges
- 3.1.5. SMEs & Professional Services
- i. Opportunities
- ii. Challenges
- 3.1.6. Events & Stadiums
- i. Opportunities
- ii. Challenges
4. Country Readiness Index & Regional Analysis
- 4.1.1. Country Readiness Index
- Figure 4.1: Juniper Research's 8 Key Regions
- Table 4.2: Juniper Research mPOS Terminals & Soft POS Market Country Readiness Index: Scoring Criteria
- Figure 4.3: Juniper Research mPOS Terminals & Soft POS Market Country Readiness Index
- Figure 4.4: Juniper Research mPOS Terminals & Soft POS Country Readiness Index: Market Segments
- 4.1.2. Focus Markets
- i. eCommerce and Omnichannel Retail Expansion
- ii. Regulatory Support and Fintech Innovation
- Figure 4.5: Total Transaction Value of Soft POS Systems ($m), Focus Markets, 2025-2030
- 4.1.3. Growth Markets
- Figure 4.6: Total mPOS Transactions per annum ($m), Growth Markets, 2025-2030
- i. Contactless Payment Surge
- ii. Government Initiatives
- 4.1.4. Developing Markets
- i. Mobile-first Solutions for Informal Economies
- ii. Cost-efficiency and Flexibility for Merchants
- Figure 4.7: Total mPOS Transactions per annum ($m), Developing Markets, 2025-2030
- 4.1.5. Saturated Markets
- Figure 4.8: Total mPOS Transaction Value per annum ($m), Saturated Markets, 2025-2030
- i. Hardware Dependency
- ii. Security and Certification Hurdles
- Figure 4.9: Juniper Research mPOS Terminals & Soft POS Market Country
- Readiness Index Heatmap: North America
- Figure 4.10: Juniper Research mPOS Terminals & Soft POS Market Country
- Readiness Index Heatmap: Latin America
- Figure 4.11: Juniper Research mPOS Terminals & Soft POS Market Country
- Readiness Index Heatmap: West Europe
- Figure 4.12: Juniper Research mPOS Terminals & Soft POS Market Country
- Readiness Index Heatmap: Central & East Europe
- Figure 4.13: Juniper Research mPOS Terminals & Soft POS Market Country
- Readiness Index Heatmap: Far East & China
- Figure 4.14: Juniper Research mPOS Terminals & Soft POS Market Country
- Readiness Index Heatmap: Indian Subcontinent
- Figure 4.15: Juniper Research mPOS Terminals & Soft POS Market Country
- Readiness Index Heatmap: Rest of Asia Pacific
- Figure 4.16: Juniper Research mPOS Terminals & Soft POS Market Country
- Readiness Index Heatmap: Africa & Middle East
Competitor Leaderboard
1. Juniper Research POS Terminals Competitor Leaderboards
- 1.1. Why Read This Report
- 1.2. Key mPOS & Soft POS Market Takeaways
2. mPOS Competitor Leaderboard
- Figure 2.1: Juniper Research Competitor Leaderboard mPOS Vendors Included & Product Portfolio
- Figure 2.2: Juniper Research Competitor Leaderboard for mPOS Terminals Vendors
- Table 2.3: Juniper Research Competitor Leaderboard: mPOS Terminals Vendors & Positioning
- Table 2.4: Juniper Research Competitor Leaderboard for mPOS Terminals: Heatmap
- 2.1. mPOS Vendor Profiles
- 2.1.1. Epos Now
- i. Corporate
- ii. Geographical Spread
- iii. Key Clients and Strategic Developments
- iv. High-level View of Offerings
- v. Juniper Research's View: Key Strengths & Strategic Development Opportunities
- 2.1.2. Fiserv
- i. Corporate
- Figure 2.5: Fiserv's Financial Snapshot ($m), 2022-2024
- ii. Geographical Spread
- iii. Key Clients & Strategic Partnerships
- iv. High-level View of Offerings
- v. Juniper Research's View: Key Strengths & Strategic Development Opportunities
- i. Corporate
- 2.1.3. Global Payments
- i. Corporate
- Figure 2.6: Global Payments' Financial Snapshot ($m), 2022-2024
- ii. Geographical Spread
- iii. Key Clients & Strategic Partnerships
- iv. High-level View of Offerings
- v. Juniper Research's View: Key Strengths & Strategic Development Opportunities
- i. Corporate
- 2.1.4. Lightspeed
- i. Corporate
- Figure 2.7: Lightspeed Financial Snapshot ($m), 2022-2024
- ii. Geographical Spread
- iii. Key Clients & Strategic Partnerships
- iv. High-level View of Offerings
- v. Juniper Research's View: Key Strengths & Strategic Development Opportunities
- i. Corporate
- 2.1.5. Mswipe
- i. Corporate
- ii. Geographical Reach
- iii. Key Clients & Strategic Partnerships
- iv. High-level View of Offerings
- v. Juniper Research's View: Key Strengths & Strategic Development Opportunities
- 2.1.6. NEXGO
- i. Corporate
- ii. Geographical Reach
- iii. Key Clients & Strategic Partnerships
- iv. High-level View of Offerings
- v. Juniper Research's View: Key Strengths & Strategic Development Opportunities
- 2.1.7. Newland NPT
- i. Corporate
- ii. Geographical Spread
- iii. Key Clients & Strategic Partnerships
- iv. High-level View of Offerings
- v. Juniper Research's View: Key Strengths & Strategic Development Opportunities
- 2.1.8. PAX
- i. Corporate
- Table 2.8: PAX's Financial Snapshot ($m), 2022-2024
- ii. Geographical Reach
- iii. Key Clients & Strategic Partnerships
- iv. High-level View of Offerings
- v. Juniper Research's View: Key Strengths & Strategic Development Opportunities
- i. Corporate
- 2.1.9. PayPal
- i. Corporate
- Table 2.9: Notable PayPal Acquisitions Summary ($m)
- ii. Geographical Spread
- iii. Key Clients & Strategic Partnerships
- iv. High-level View of Offerings
- v. Juniper Research's View: Key Strengths & Strategic Development Opportunities
- i. Corporate
- 2.1.10. Posiflex
- i. Corporate
- Figure 2.10: Posiflex's Financial Snapshot ($m), 2021-2023, Converted from TWD
- ii. Geographical Spread
- iii. Key Clients & Strategic Partnerships
- iv. High-level View of Offerings
- v. Juniper Research's View: Key Strengths & Strategic Development Opportunities
- i. Corporate
- 2.1.11. Square (Block)
- i. Corporate
- ii. Geographical Reach
- iii. Key Clients & Strategic Partnerships
- iv. High-level View of Offerings
- v. Juniper Research's View: Key Strengths & Strategic Development Opportunities
- 2.1.12. SumUp
- i. Corporate
- ii. Geographical Spread
- iii. Key Clients & Strategic Partnerships
- iv. High-level View of Offerings
- v. Juniper Research's View: Key Strengths & Strategic Development Opportunities
- 2.1.13. Toast
- i. Corporate
- Table 2.11: Toast's Investment Rounds ($m), 2015-2020
- ii. Geographical Reach
- iii. Key Clients & Strategic Partnerships
- iv. High-level View of Offerings
- v. Juniper Research's View: Key Strengths & Strategic Development Opportunities
- i. Corporate
- 2.1.14. Verifone
- i. Corporate
- ii. Geographical Spread
- iii. Key Clients & Strategic Partnerships
- iv. High-level View of Offerings
- v. Juniper Research's View: Key Strengths & Strategic Development Opportunities
- 2.1.15. Worldline
- i. Corporate
- ii. Geographical Reach
- iii. Key Clients & Strategic Partnerships
- iv. High-level View of Offerings
- v. Juniper Research's View: Key Strengths and Strategic Development Opportunities
- 2.1.1. Epos Now
- 2.2. Juniper Research Competitor Leaderboard Assessment Methodology
- 2.3. Limitations & Interpretation
- Figure 2.12: Juniper Research mPOS Competitor Leaderboard
3. Soft POS Competitor Leaderboard
- Figure 3.1: Juniper Research Competitor Leaderboard Soft POS Vendors Included & Product Portfolio
- Figure 3.2: Juniper Research Competitor Leaderboard for Soft POS Vendors
- Table 3.3: Juniper Research Competitor Leaderboard: Soft POS Vendors & Positioning
- Table 3.4: Juniper Research Competitor Leaderboard for Soft POS: Heatmap
- 3.1. Soft POS Vendor Profiles
- 3.1.1. alcineo
- i. Corporate
- ii. Geographical Spread
- iii. Key Clients & Strategic Partnerships
- iv. High-level View of Offerings
- Figure 3.5: alcineo Technology Architecture
- v. Juniper Research's View: Key Strengths & Strategic Development Opportunities
- 3.1.2. Apple
- i. Corporate
- Table 3.6: Apple's Financial Snapshot, $m, FY 2022-2024
- ii. Geographical Spread
- iii. Key Clients & Strategic Partnerships
- iv. High-level View of Offerings
- v. Juniper Research's View: Key Strengths & Strategic Development Opportunities
- i. Corporate
- 3.1.3. CM.com
- i. Corporate
- Figure 3.7: CM.com Financial Snapshot ($m), 2022-2024 (Converted from Euro-1 @1.10)
- ii. Geographical Spread
- iii. Key Clients & Strategic Developments
- iv. High-level View of Offering
- v. Juniper Research's View: Key Strengths & Strategic Development
- i. Corporate
- 3.1.4. Fiserv
- i. Corporate
- Figure 3.8: Fiserv Financial Snapshot ($m), 2022-2024
- ii. Geographical Spread
- iii. Key Clients & Strategic Partnerships
- iv. High-Level View of Offerings
- v. Juniper Research's View: Key Strengths & Strategic Development
- i. Corporate
- 3.1.5. MagicCube
- i. Corporate
- Table 3.9: MagicCube Investment Rounds ($m), 2015-2021
- ii. Geographical Reach
- iii. Key Clients & Strategic Developments
- iv. High-level View of Offering
- v. Juniper Research's View: Key Strengths & Strategic Development
- i. Corporate
- 3.1.6. Mypinpad
- i. Corporate
- ii. Geographical Reach
- iii. Key Clients & Strategic Developments
- iv. High-level View of Offering
- v. Juniper Research's View: Key Strengths & Strategic Development
- 3.1.7. Paypal
- i. Corporate
- Table 3.10: Notable PayPal Acquisitions Summary ($m)
- ii. Geographical Spread
- iii. Key Clients & Strategic Partnerships
- iv. High-level View of Offerings
- v. Juniper Research's View: Key Strengths & Strategic Development Opportunities
- i. Corporate
- 3.1.8. Payten
- i. Corporate
- ii. Geographical Reach
- iii. Key Clients & Strategic Developments
- iv. High-level View of Offering
- v. Juniper Research's View: Key Strengths and Strategic Development
- 3.1.9. Square
- i. Corporate
- ii. Geographical Reach
- iii. Key Clients & Strategic Developments
- iv. High-level View of Offering
- v. Juniper Research's View: Key Strengths and Strategic Development
- 3.1.10. Stripe
- i. Corporate
- ii. Geographic Spread
- iii. Key Clients & Strategic Partnerships
- iv. High-level View of Offerings
- v. Juniper Research's View: Key Strengths and Strategic Development
- 3.1.11. Tidypay
- i. Corporate
- ii. Geographical Spread
- iii. Key Clients & Strategic Partnerships
- iv. High-Level View of Offerings
- v. Juniper Research's View: Key Strengths & Strategic Development Opportunities
- Figure 3.11: Viva.com Soft POS Terminal App Overview
- v. Juniper Research's View: Key Strengths & Strategic Development Opportunities
- 3.1.13. Wizzit
- i. Corporate
- ii. Geographical Spread
- iii. Key Clients & Strategic Partnerships
- iv. High-Level View of Offerings
- v. Juniper Research's View: Key Strengths & Strategic Development Opportunities
- 3.1.14. Worldline
- i. Corporate
- ii. Geographical Reach
- iii. Key Clients & Strategic Developments
- iv. High-level View of Offering
- v. Juniper Research's View: Key Strengths & Strategic Development Opportunities
- 3.1.15. Worldpay
- i. Corporate
- ii. Geographical Spread
- iii. Key Clients & Strategic Partnerships
- iv. High-Level View of Offerings
- v. Juniper Research's View: Key Strengths & Strategic Development Opportunities
- 3.1.1. alcineo
- 3.2. Methodology
- Table 3.12: Juniper Research Competitor Leaderboard Soft POS Methodology
- 3.3. Juniper Research Competitor Leaderboard Assessment Methodology
- 3.4. Limitations & Interpretation
- 3.5. Related Research
- Endnotes
Data & Forecasting
1. Market Forecasts
- 1.1. Introduction
- 1.2. Methodology & Assumptions
- Figure 1.1: POS Terminal Market Forecast Methodology
2. Market Summary
- 2.1. POS Terminals Market
- 2.1.1. POS Terminals Installed Base
- Figure & Table 2.1: Global POS Installed Base (m), Split by 8 Key Regions, 2025-2030
- Figure 2.2: North America - Proportion of mPOS in Use That Are Smart POS (%), 2025-2030
- 2.1.2. Total POS Transaction Volume
- Figure & Table 2.3: Global POS Transaction Volume (m), 2025-2030
- 2.1.3. Total POS Transaction Value
- Figure & Table 2.4: Global POS Transaction Value ($m), Split by 8 Key Regions, 2025-2030
- 2.1.1. POS Terminals Installed Base
3. Contactless POS
- 3.1.1. Contactless Terminals Installed Base
- Figure & Table 3.1: Global Contactless POS Installed Base (m), Split by 8 Key Regions, 2025-2030
- Table 3.2: Global Percentage of Dedicated POS That Are Contactless Enabled (%), 2025-2030
- 3.1.2. Contactless POS Transaction Volume
- Figure & Table 3.3: Global Contactless POS Transaction Volume (m), Split by 8 Key Regions, 2025-2030
- 3.1.3. Contactless POS Transaction Value
- Figure & Table 3.4: Global Contactless POS Transaction Value ($m), Split by 8 Key Regions, 2025-2030
4. mPOS
- 4.1.1. mPOS Installed Base
- Figure & Table 4.1: mPOS Installed Base (m), Split by 8 Key Regions, 2025-2030
- 4.1.2. mPOS Transaction Value
- Figure & Table 4.2: Global mPOS Transaction Value ($m), Split by 8 Key Regions, 2025-2030
5. Soft POS
- 5.1.1. Soft POS Installed Base
- Figure & Table 5.1: Number of Smartphones Using Soft POS (m), Split by 8 Key Regions, 2025-2030
- 5.1.2. Soft POS Transaction Volume
- Figure & Table 5.2: Global Soft POS Transaction Volume (m), Split by 8 Key Regions, 2025-2030
- 5.1.3. Soft POS Transaction Value
- Figure & Table 5.3: Global Soft POS Transaction Value ($m), Split by 8 Key Regions, 2025-2030
