
|
시장보고서
상품코드
1777931
B2B 결제 시장(2025-2030년)B2B Payments Market: 2025-2030 |
||||||
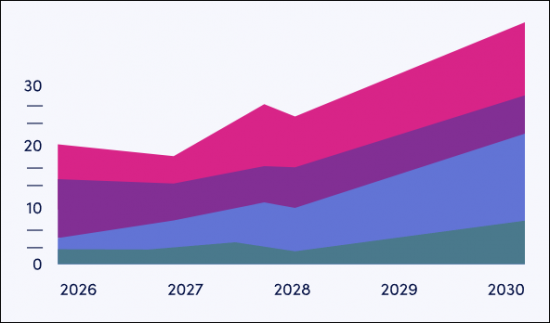
국경 간 거래가 활발해지고 있으며 관세의 영향에도 불구하고 B2B 결제의 국경 간 거래건수는 2030년까지 180억 건에 달할 전망
| 주요 통계 | |
|---|---|
| 총 거래액(2025년) : | 1,870억 달러 |
| 총 거래액(2030년) : | 2,240억 달러 |
| 시장 성장률(2025-2030년) : | 20% |
| 예측 기간 : | 2025-2030년 |
본 조사 패키지는 B2B 결제 시장을 종합적이고 통찰적으로 분석하여 B2B 결제 플랫폼 제공업체부터 규제 당국, 은행에 이르기까지 이해관계자가 향후 성장, 주요 동향, 경쟁 환경을 이해할 수 있도록 지원합니다.
본 조사 스위트에는 개별적으로 구입할 수 있는 몇가지 옵션이 있습니다. 「시장 동향 및 전략」에는 새로운 결제 유형이나 자동화 시스템 등, B2B 결제에 있어서의 주요 진전 분야의 통찰이 가득한 분석이 포함되어 있습니다. Juniper Research's Country Readiness Index에서는 61개의 다른 지역에서의 B2B 결제의 현상과 향후의 사업 기회를 국가별로 분석했습니다.
「데이터&예측」에서는 향후 5년간의 B2B 결제 시장의 보급과 향후의 성장을, 국경 간 거래와 국내 거래, 사업 규모별, 결제 방법별로 매핑한 데이터에 액세스할 수 있습니다.
게다가 '경쟁 리더보드'에서는 B2B 결제 시장 리더 19개사를 폭넓게 분석하고, 'Future Leaders Index'에서는 동 시장에서 중요한 위치를 차지하고 있는 혁신적 기업 18개사를 다루고 있습니다.
모든 보고서는 영어로 표시됩니다.
SAMPLE VIEW
시장 데이터 및 예측 보고서
샘플
시장 동향 및 전략 보고서
시장 데이터 및 예측 보고서
이 설문 조사 스위트에는 158 개의 테이블과 61,000 개가 넘는 데이터 포인트의 예측 데이터 세트에 대한 액세스가 포함되어 있습니다.
- B2B 결제의 총수
- B2B 결제의 총액
- 국경 간 결제를 실시하는 기업수
이 지표는 다음 주요 시장에 대해 제공됩니다.
- 국내 B2B 결제
- 국경 간 B2B 결제
또한 이 데이터는 다음 결제 방법별로 분류됩니다.
- 현금
- 수표
- 카드
- 가상 카드
- 전신송금
- 즉시 지불
- 기타
또한 이 데이터는 중소기업, 중견기업, 대기업 거래별로 나뉘어져 있습니다.
Juniper Research의 대화형 예측(Excel)에는 다음과 같은 기능이 있습니다.
- 통계 분석 : 통계 분석 : 데이터 기간 동안 모든 지역과 국가에 대한 특정 지표를 검색 할 수 있습니다. 그래프를 쉽게 수정할 수 있으며 클립 보드로 내보낼 수 있습니다.
- 국가별 데이터 도구 : 이 도구를 사용하면 예측 기간 동안 모든 지역과 국가 지표를 볼 수 있습니다.
- 국가별 비교 도구 : 국가를 선택하고 비교할 수 있습니다. 이 도구에는 그래프를 내보내는 기능이 포함되어 있습니다.
- What-if 분석 : 5가지 대화 형 시나리오를 통해 사용자는 예측의 전제조건과 비교할 수 있습니다.
경쟁 리더보드 보고서
경쟁 리더보드 보고서는 두 가지 유형의 공급업체 포지셔닝 도구를 통해 선도적인 기존 공급업체와 신흥 파괴적인 공급업체 모두에 대한 상세한 평가와 시장 포지셔닝을 제공합니다.
대상 공급업체는 다음 19개 기업입니다.
|
|
|
또한이 보고서에는 "Feature Leaders Index"도 게재되어 있습니다. 이것은 B2B 결제 시장의 지배적 기업에 도전하는 기업의 경쟁적 위치를 시각적으로 나타냅니다.
18개의 혁신가 포함 :
|
|
|
목차
시장 동향·전략
제1장 중요 포인트와 전략적 제안
- 중요 포인트
- 전략적 제안
제2장 시장 상황와 세분화
- 정의와 범위
- 주요 동향
- 과제
- 지불자, 가맹점, PSP의 일반적인 과제
- 관세가 가져오는 과제
- 솔루션과 기회
- 임베디드 금융과 핀텍의 통합
- 공급 체인 금융 및 운전 자본 솔루션
- 실시간 데이터 및 분석
- 디지털 지갑과 정체성
- 협동 생태계
- 부정 방지와 강화된 보안 대책
- Compliance-as-a-service
- 국경 간 B2B 결제와 국내 B2B 결제
- 국내 B2B 결제
- 국경 간 B2B 결제
- B2B 결제 채널
- 실시간 결제/즉시 결제
- 수표
- 카드
- 즉각적인 은행 지불
- 블록체인 결제 네트워크
- 중앙은행 디지털 통화(CBDC)
- 스테이블 코인
- 부가가치 서비스
- 송장금융
- AP/AR 자동화
- 무역금융
- 부가가치 기술
- AI
- 결제의 자동화
- 부정 행위 검출
- FX관리와 세계결제
- 블록체인
- CBDC
제3장 국가별 준비지수
- 국가별 준비 지수 : 서론
- 지역 분석
- 북미
- 미국
- 라틴아메리카
- 아르헨티나
- 브라질
- 서유럽
- EU
- 영국
- 중유럽 및 동유럽
- 폴란드
- 극동 및 중국
- 중국
- 일본
- 인도 아대륙
- 인도
- 기타 아시아태평양
- 호주
- 말레이시아
- 아프리카와 중동
- 나이지리아
- 사우디아라비아
- 북미
경쟁 리더보드
제1장 Juniper Research 경쟁 리더보드
제2장 경쟁 리더보드 : 기업 프로파일
- 공급업체 프로파일
- ACI Worldwide
- American Express
- Banking Circle
- CGI
- Discover
- ECS Fin
- Finastra
- FIS
- Fiserv
- Flutterwave
- IBM
- Mastercard
- Montran Corporation
- Ripple
- Spendesk
- Stripe
- SWIFT
- Visa
- Wise
- Juniper Research의 리더 보드 평가 방법
- 제한과 해석
제3장 Juniper Research의 Future Leaders Index
제4장 미래의 리더 인덱스 공급업체 프로파일
- 공급업체 프로파일
- 3S Money
- AccessPay
- Airwallex
- Apron
- Airwallex
- Apron
- Balance
- Billie
- Brex
- Hokodo
- Jeeves
- Jeeves
- Mondu
- Billie
- Pliant
- Routable
- Sila
- Spenmo
- Juniper Research의 Future Leaders Index : 평가 방법
- 제한과 해석
- 관련 조사
데이터 및 예측
제1장 시장 상황
제2장 예측 개요
- 총량
- 총 금액
- 지불 채널
제3장 국내 B2B 결제 예측
- 조사 방법과 가정
- 국내 예측
- 국내 B2B 거래 건수
- 국내 B2B 거래액
- 카드 결제
- 즉시 지불
- 국내 결제 채널
제4장 국경 간 B2B 결제
- 조사 방법과 전제
- 국경을 넘은 예측
- 거래 건수
- 거래의 가치
- 전신송금
- 국경 간 결제 채널
'B2B Payment Cross-border Transactions to Hit 18 Billion by 2030, as Cross-border Activity Intensifies Despite Tariffs'
| KEY STATISTICS | |
|---|---|
| Total transaction value in 2025: | $187tn |
| Total transaction value in 2030: | $224tn |
| 2025 to 2030 market growth: | 20% |
| Forecast period: | 2025-2030 |
Overview
Juniper Research's "B2B Payments" research suite provides a comprehensive and insightful analysis of this market; enabling stakeholders from B2B payment platform providers to regulators and banks, to understand future growth, key trends and the competitive environment.
The research suite includes several different options that can be purchased separately. The Market Trends & Strategies element includes an insightful analysis of the key areas of progress within B2B payments, including new payment types and automation systems. Additionally, it features Juniper Research's Country Readiness Index, which provides a country-level analysis of the current and future opportunities for B2B payments in 61 different geographies.
The Data & Forecasting element includes access to data mapping the adoption and future growth of the B2B payments market over the next five years, split by cross-border versus domestic transactions, by business size and by payment method.
Additionally, the Competitor Leaderboard document features two vendor positioning models: the Competitor Leaderboard, revealing an extensive analysis of the 19 market leaders in the B2B payments space, and a Future Leaders Index; covering the 18 leading innovators who are becoming important in the market.
The coverage can also be purchased as a full research suite containing the Market Trends & Strategies, Data & Forecasting, and Competitor Leaderboard & Future Leaders Index, and a substantial discount.
Collectively, these documents provide a critical tool for understanding this important market. They allow B2B payment platform providers and payments companies to shape their future strategy; capitalising on future growth opportunities. This research suite's extensive coverage makes it a valuable tool for navigating this market.
All report content is delivered in the English language.
Key Features
- Key Takeaways & Strategic Recommendations: In-depth analysis of key development opportunities, key findings and key strategic recommendations for B2B payment platforms, cross-border payment specialists, banks, and regulators.
- Market Outlook: A breakdown of the B2B payments market by its component segments, with insight into the relative challenges of domestic and cross-border payments. It also examines, in detail, a range of payment types. Value-added services are analysed; assessing their place in the market and what businesses are looking for from these services. The research examines key emerging technologies in the B2B payments market, how they are used in the market, and how they will affect the market in the future. A Country Readiness Index is also included; assessing growth prospects for B2B payments across 61 key countries.
- Benchmark Industry Forecasts: Extensive forecasts for the number and value of B2B payments, split by domestic and cross-border. This is further split by payment channel (cash, cheque, card, virtual card, wire transfer, instant payment, and other means) and by business size (small, medium, and large).
- Juniper Research Competitor Leaderboard & Future Leaders Index: Key player capability and capacity assessment for 19 B2B payment platforms, via the Juniper Research Competitor Leaderboard. The study also contains a Future Leaders Index; positioning 18 key emerging players shaking up the B2B payments market.
SAMPLE VIEW
Market Data & Forecasting Report

The numbers tell you what's happening, but our written report details why, alongside the methodologies.
SAMPLE VIEW
Market Trends & Strategies Report

A comprehensive analysis of the current market landscape, alongside strategic recommendations.
Market Data & Forecasting Report
The market-leading research suite for the "B2B Payments" market includes access to the full set of forecast data of 158 tables and over 61,000 datapoints. Metrics in the research suite include:
- Total Number of B2B Payments
- Total Value of B2B Payments
- Number of Businesses Making Cross-border Payments
These metrics are provided for the following key market verticals:
- Domestic B2B Payments
- Cross-border B2B Payments
This data is also split by the following payment methods:
- Cash
- Cheque
- Card
- Virtual Card
- Wire Transfer
- Instant Payment
- Other Means
The data is also split by transactions being made by small, medium, and large businesses.
Juniper Research Interactive Forecast Excel contains the following functionality:
- Statistics Analysis: Users benefit from the ability to search for specific metrics, displayed for all regions and countries across the data period. Graphs are easily modified and can be exported to the clipboard.
- Country Data Tool: This tool enables users to look at metrics for all regions and countries in the forecast period. Users can refine the metrics displayed via a search bar.
- Country Comparison Tool: Users can select and compare countries. The ability to export graphs is included in this tool.
- What-if Analysis: Here, users can compare forecast metrics against their own assumptions, via 5 interactive scenarios.
Market Trends & Strategies Report
This report examines the "B2B Payments" market landscape in detail; assessing market trends and factors shaping the evolution of this growing market. The report delivers comprehensive analysis of the strategic opportunities in the B2B payments landscape; assessing key market segments, including real-time payments, A2A payments, credit card and debit cards, virtual cards, and other digital payment methods. It also examines their challenges and opportunities, such as the impact of the Trump Administration's tariffs and other economic policies. The report includes evaluation of key country-level opportunities for B2B payments growth; looking at the unique nature of individual B2B payment markets, from new real-time payment rails to the emergence of stablecoins for cross-border transactions.
Competitor Leaderboard Report
The Competitor Leaderboard report provides a detailed evaluation and market positioning for both the larger, established vendors, as well as for the newer, emerging disruptors: via two different vendor positioning tools. The Juniper Research Competitor Leaderboard offers coverage of 19 leading B2B payment platforms; positioning them as established leaders, leading challengers, or disruptors and challengers, based on capacity and capability assessments.
The 19 vendors included are:
|
|
|
The document also features a Feature Leaders Index. The Juniper Research Future Leaders Index provides a visual representation of the competitive positioning of companies in the B2B payments market which are challenging dominant players.
The 18 innovators included are:
|
|
|
Together, the Competitor Leaderboard and the Future Leaders Index give a comprehensive guide to the competitive landscape within B2B payments; providing an important resource for stakeholders.
Table of Contents
Market Trends & Strategies
1. Key Takeaways & Strategic Recommendations
- 1.1. Key Takeaways
- 1.2. Strategic Recommendations
2. Market Landscape & Segmentation
- 2.1. Introduction
- 2.1.1. The Context
- 2.2. Definition & Scope
- 2.3 Key Trends
- 2.3.1. Electronic Payments Increasingly Replacing Paper Cheques
- 2.3.2. Embedded Finance Drives Efficiency and Growth
- 2.3.3. Shift to Real-time Payments
- 2.3.4. A2A (Account-to-account) Payments
- 2.3.5. Pay by Bank and Instant Payments
- 2.3.6. Rise of Virtual Cards
- 2.3.7. Rising Levels of Automation
- 2.4. Challenges
- 2.4.1. General Challenges for Payers, Merchants and PSPs
- i. Fragmented Payment Workflows & Reconciliation Complexity
- ii. Payment Delays
- iii. Lack of Transparency
- iv. Cybersecurity & Fraud Risk
- v. Regulatory Compliance
- vi. Resistance to Technology Adoption
- 2.4.1. General Challenges for Payers, Merchants and PSPs
- 2.5. Challenges Induced by Tariffs
- Table 2.1: Impact of Tariffs for B2B Payment Stakeholders
- Figure 2.2: Impact of Tariffs for B2B Payment Stakeholders
- i. The Domestic Impact of Tariffs
- ii. Cross-border Impact of Tariffs
- 2.6. Solutions & Opportunities
- 2.6.1. Embedded Finance & Fintech Integration
- 2.6.2. Supply Chain Financing & Working Capital Solutions
- i. Enhanced Cashflow Management
- ii. Flexible Payment Options
- 2.6.3. Real-time Data & Analytics
- i. Services Consolidation
- 2.6.4. Digital Wallets and Identity
- 2.6.5. Collaborative Ecosystems
- 2.6.6. Fraud Prevention & Enhanced Security Measures
- 2.6.7. Compliance-as-a-service
- 2.7. Cross-border Versus Domestic B2B Payments
- 2.7.1. Domestic B2B Payments
- i. Automation
- ii. Data-driven Payment Decisions
- 2.7.2. Cross-border B2B Payments
- i. Seamless Cross-border Transactions
- ii. Interoperability
- 2.7.1. Domestic B2B Payments
- 2.8. B2B Payments Channels
- 2.8.1. Real-time Payments/Instant Payments
- 2.8.2. Cheques
- 2.8.3. Cards
- i. Corporate Cards
- ii. Virtual Cards
- 2.8.4. Non-instant Bank Payments
- 2.8.5. Blockchain Payment Networks
- 2.8.6. Central Bank Digital Currencies (CBDCs)
- 2.8.7. Stablecoins
- 2.9. Value-added Services
- 2.9.1. Invoice Financing
- 2.9.2. AP/AR Automation
- 2.9.3. Trade Financing
- 2.10. Value-added Technologies
- 2.10.1. AI
- 2.10.2. Payment Automation
- 2.10.3. Fraud Detection
- 2.10.4. FX Management and Global Payments
- 2.10.5. Blockchain
- 2.10.6. CBDCs
3. Country Readiness Index
- 3.1. Introduction to the Country Readiness Index
- Figure 3.1: Juniper Research's Country Readiness Index Scoring Criteria: B2B Payments
- Figure 3.2: Juniper Research Country Readiness Index: B2B Payments
- Figure 3.3: B2B Payments Country Readiness Index: Market Segments
- 3.2. Regional Analysis
- 3.2.1. North America
- i. US
- 3.2.2. Latin America
- i. Argentina
- ii. Brazil
- 3.2.3. West Europe
- i. EU
- ii. UK
- 3.2.4. Central & East Europe
- i. Poland
- 3.2.5. Far East & China
- i. China
- ii. Japan
- 3.2.6. Indian Subcontinent
- i. India
- 3.2.7. Rest of Asia Pacific
- i. Australia
- ii. Malaysia
- 3.2.8. Africa & Middle East
- i. Nigeria
- ii. Saudi Arabia
- Figure 3.4: Juniper Research's Country Readiness Index Heatmap: North America
- Figure 3.5: Juniper Research's Country Readiness Index Heatmap: Latin America
- Figure 3.6: Juniper Research's Country Readiness Index Heatmap: West Europe60
- Figure 3.7: Juniper Research's Country Readiness Index Heatmap: Central and East Europe
- Figure 3.8: Juniper Research's Country Readiness Index Heatmap: Far East & China
- Figure 3.9: Juniper Research's Country Readiness Index Heatmap: Indian Subcontinent
- Figure 3.10: Juniper Research's Country Readiness Index Heatmap: Rest of Asia Pacific
- Figure 3.11: Juniper Research's Country Readiness Index Heatmap: Africa and Middle East
- 3.2.1. North America
Competitor Leaderboard
1. Juniper Research Competitor Leaderboard
- 1.1. Why Read This Report
- Table 1.1: Juniper Research's Competitor Leaderboard: B2B Payments Vendors Included & Product Portfolio
- Figure 1.2: Juniper Research's Competitor Leaderboard for B2B Payments
- Table 1.3: Juniper Research B2B Payments Vendors & Positioning
- Table 1.4: Juniper Research's Competitor Leaderboard Heatmap B2B Payments Vendors (Part 1 of 2)
- Table 1.4: Juniper Research's Competitor Leaderboard Heatmap B2B Payments Vendors (Part 2 of 2)
2. Competitor Leaderboard Company Profiles
- 2.1. Vendor Profiles
- 2.1.1. ACI Worldwide
- i. Corporate
- Table 2.1: ACI Worldwide's Financial Snapshot ($m), 2022-2024
- ii. Geographical Spread
- iii. Key Clients & Strategic Partnerships
- iv. High-level View of Offerings
- v. Juniper Research's View: Key Strengths & Strategic Development Opportunities
- i. Corporate
- 2.1.2. American Express
- i. Corporate
- Table 2.2: American Express' Financial Snapshot ($m), 2022-2024
- ii. Geographical Spread
- iii. Key Clients & Strategic Partnerships
- iv. High-level View of Offerings
- v. Juniper Research's View: Key Strengths & Strategic Development Opportunities
- i. Corporate
- 2.1.3. Banking Circle
- i. Corporate
- ii. Geographical Spread
- iii. Key Clients & Strategic Partnerships
- iv. High-level View of Offerings
- v. Juniper Research's View: Key Strengths & Strategic Development Opportunities
- 2.1.4. CGI
- i. Corporate
- Table 2.3: CGI's Financial Snapshot ($m), 2022-2024
- ii. Geographical Spread
- iii. Key Clients & Strategic Partnerships
- iv. High-level View of Offerings
- Figure 2.4: CGI's All Payments Solution
- v. Juniper Research's View: Key Strengths & Strategic Development Opportunities
- i. Corporate
- 2.1.5. Discover
- i. Corporate
- Table 2.5: Discover's Financial Snapshot ($m), 2022-2024
- ii. Geographical Spread
- iii. Key Clients & Strategic Partnerships
- iv. High-level View of Offerings
- v. Juniper Research's View: Key Strengths & Strategic Development Opportunities
- i. Corporate
- 2.1.6. ECS Fin
- i. Corporate
- ii. Geographical Spread
- iii. Key Clients & Strategic Partnerships
- iv. High-level View of Offerings
- v. Juniper Research's View: Key Strengths & Strategic Development Opportunities
- 2.1.7. Finastra
- i. Corporate
- ii. Geographical Spread
- iii. Key Clients & Strategic Partnerships
- iv. High-level View of Offerings
- v. Juniper Research's View: Key Strengths & Strategic Development Opportunities
- 2.1.8. FIS
- i. Corporate
- Figure 2.6: FIS' Financial Snapshot ($m), 2022-2024
- ii. Geographical Spread
- iii. Key Clients & Strategic Partnerships
- iv. High-level View of Offerings
- v. Juniper Research's View: Key Strengths & Strategic Development Opportunities
- i. Corporate
- 2.1.9. Fiserv
- i. Corporate
- Table 2.7: Fiserv's Financial Snapshot ($m), 2022-2024
- ii. Geographical Spread
- iii. Key Clients & Strategic Partnerships
- iv. High-level View of Offerings
- v. Juniper Research's View: Key Strengths & Strategic Development Opportunities
- i. Corporate
- 2.1.10. Flutterwave
- i. Corporate
- Table 2.8: Flutterwave's Rounds of Funding ($m), 2017-2022
- ii. Geographical Spread
- iii. Key Clients & Strategic Partnerships
- iv. High-level View of Offerings
- v. Juniper Research's View: Key Strengths & Strategic Development Opportunities
- i. Corporate
- 2.1.11. IBM
- i. Corporate
- Table 2.9: IBM's Financial Snapshot ($m), 2022-2024
- ii. Geographical Spread
- iii. Key Clients & Strategic Partnerships
- iv. High-level View of Offerings
- v. Juniper Research's View: Key Strengths & Strategic Development Opportunities
- i. Corporate
- 2.1.12. Mastercard
- i. Corporate
- Table 2.10: Mastercard's Financial Snapshot ($m), 2022-2024
- ii. Geographical Spread
- iii. Key Clients & Strategic Partnerships
- iv. High-level View of Offerings
- v. Juniper Research's View: Key Strengths & Strategic Development Opportunities
- i. Corporate
- 2.1.13. Montran Corporation
- i. Corporate
- ii. Geographical Spread
- iii. Key Clients & Strategic Partnerships
- iv. High-level View of Offerings
- v. Juniper Research's View: Key Strengths & Strategic Development Opportunities
- 2.1.14. Ripple
- i. Corporate
- Figure 2.11: Ripple's Funding Rounds ($m), 2015-2019
- ii. Geographical Spread
- iii. Key Clients & Strategic Partnerships
- iv. High-level View of Offerings
- Figure 2.12: How Ripple's Cross-border Payments Work
- v. Juniper Research's View: Key Strengths & Strategic Development Opportunities
- i. Corporate
- 2.1.15. Spendesk
- i. Corporate
- Table 2.13: Spendesk's Funding Rounds ($m), 2017-2022
- ii. Geographical Spread
- iii. Key Clients & Strategic Partnerships
- iv. High-level View of Offerings
- v. Juniper Research's View: Key Strengths & Strategic Development Opportunities
- i. Corporate
- 2.1.16. Stripe
- i. Corporate
- Table 2.14: Stripe's Funding Rounds ($m), 2019-2023
- ii. Geographical Spread
- iii. Key Clients & Strategic Partnerships
- iv. High-level View of Offerings
- v. Juniper Research's View: Key Strengths & Strategic Development Opportunities
- i. Corporate
- 2.1.17. SWIFT
- i. Corporate
- Table 2.15: SWIFT's Financial Snapshot ($m), 2021-2023
- ii. Geographical Spread
- iii. Key Clients & Strategic Partnerships
- iv. High-level View of Offerings
- v. Juniper Research's View: Key Strengths & Strategic Development Opportunities
- i. Corporate
- 2.1.18. Visa
- i. Corporate
- Table 2.16: Visa's Financial Snapshot ($m), 2022-2024
- ii. Geographical Spread
- iii. Key Clients & Strategic Partnerships
- iv. High-level View of Offerings
- Figure 2.17: How Visa B2B Connect Works
- v. Juniper Research's View: Key Strengths & Strategic Development Opportunities
- i. Corporate
- 2.1.19. Wise
- i. Corporate
- Figure 2.18: Wise's Financial Snapshot ($m), 2022-2024
- ii. Geographical Spread
- iii. Key Clients & Strategic Partnerships
- iv. High-level View of Offerings
- v. Juniper Research's View: Key Strengths & Strategic Development Opportunities
- i. Corporate
- 2.1.1. ACI Worldwide
- 2.2. Juniper Research Competitor Leaderboard Assessment Methodology
- 2.2.1. Limitations & Interpretations
- Table 2.19: Juniper Research's Competitor Leaderboard Scoring Criteria - B2B Payments
- 2.2.1. Limitations & Interpretations
3. Juniper Research Future Leaders Index
- Table 3.1: Juniper Research Future Leaders Index - B2B Payments Vendors & Product Portfolio
- Figure 3.2: Juniper Research Future Leaders Index - B2B Payments
- Table 3.3: Juniper Research Future Leaders Index Ranking - B2B Payments
- Table 3.4: Juniper Research Future Leaders Index - B2B Payments Heatmap
4. Future Leaders Index Vendor Profiles
- 4.1. Vendor Profiles
- 4.1.1. 3S Money
- i. Corporate
- ii. Geographical Spread
- iii. Key Clients & Strategic Partnerships
- iv. High-level View of Offerings
- v. Juniper Research's View: Key Strengths & Strategic Development Opportunities
- 4.1.2. AccessPay
- i. Corporate
- ii. Geographical Spread
- iii. Key Clients & Strategic Partnerships
- iv. High-level View of Offerings
- v. Juniper Research's View: Key Strengths & Strategic Development Opportunities
- 4.1.3. Airwallex
- i. Corporate
- Table 4.1: Airwallex's Rounds of Funding ($m), 2018-2025
- ii. Geographical Spread
- iii. Key Clients & Strategic Partnerships
- iv. High level View of Offerings
- v. Juniper Research's View: Key Strengths & Strategic Development Opportunities
- i. Corporate
- 4.1.4. Apron
- i. Corporate
- ii. Geographical Spread
- iii. Key Clients & Strategic Partnerships
- iv. High-level View of Offerings
- v. Juniper Research's View: Key Strengths & Strategic Development Opportunities
- 4.1.5. Aria
- i. Corporate
- ii. Geographical Spread
- iii. Key Clients & Strategic Partnerships
- iv. High-level View of Offerings
- v. Juniper Research's View: Key Strengths & Strategic Development Opportunities
- 4.1.6. Autobooks
- i. Corporate
- ii. Geographical Spread
- iii. Key Clients & Strategic Partnerships
- iv. High-level View of Offerings
- v. Juniper Research's View: Key Strengths & Strategic Development Opportunities
- 4.1.7. Balance
- i. Corporate
- ii. Geographical Spread
- iii. Key Clients & Strategic Partnerships
- iv. High-level View of Offerings
- v. Juniper Research's View: Key Strengths & Strategic Development Opportunities
- 4.1.8. Billie
- i. Corporate
- ii. Geographical Spread
- iii. Key Clients & Strategic Partnerships
- iv. High-level View of Offerings
- v. Juniper Research's View: Key Strengths & Strategic Development Opportunities
- 4.1.9. Brex
- i. Corporate
- Table 4.2: Brex's Funding Rounds ($m), 2018-2022
- ii. Geographical Spread
- iii. Key Clients & Strategic Partnerships
- iv. High-level View of Offerings
- v. Juniper Research's View: Key Strengths & Strategic Development Opportunities
- i. Corporate
- 4.1.10. Hokodo
- i. Corporate
- ii. Geographical Spread
- iii. Key Clients & Strategic Partnerships
- iv. High-level View of Offerings
- v. Juniper Research's View: Key Strengths & Strategic Development Opportunities
- 4.1.11. Jeeves
- i. Corporate
- ii. Geographical Spread
- iii. Key Clients & Strategic Partnerships
- iv. High-level View of Offerings
- v. Juniper Research's View: Key Strengths & Strategic Development Opportunities
- 4.1.12. Modulr
- i. Corporate
- ii. Geographical Spread
- iii. Key Clients & Strategic Partnerships
- iv. High-level View of Offerings
- v. Juniper Research's View: Key Strengths & Strategic Development Opportunities
- 4.1.13. Mondu
- i. Corporate
- ii. Geographical Spread
- iii. Key Clients & Strategic Partnerships
- iv. High-level View of Offerings
- v. Juniper Research's View: Key Strengths & Strategic Development Opportunities
- 4.1.14. Paytron
- i. Corporate
- ii. Geographical Spread
- iii. Key Clients & Strategic Partnerships
- iv. High-level View of Offerings
- v. Juniper Research's View: Key Strengths & Strategic Development Opportunities
- 4.1.15. Pliant
- i. Corporate
- Table 4.3: Pliant's Rounds of Funding ($m), 2021-2025
- ii. Geographical Spread
- iii. Key Clients & Strategic Partnerships
- High-level View of Offerings
- iv. Juniper Research's View: Key Strengths & Strategic Development Opportunities
- i. Corporate
- 4.1.16. Routable
- i. Corporate
- ii. Geographical Spread
- iii. Key Clients & Strategic Partnerships
- iv. High-level View of Offerings
- v. Juniper Research's View: Key Strengths & Strategic Development Opportunities
- 4.1.17. Sila
- i. Corporate
- ii. Geographical Spread
- iii. Key Clients & Strategic Partnerships
- iv. High-level View of Offerings
- v. Juniper Research's View: Key Strengths & Strategic Development Opportunities
- 4.1.18. Spenmo
- i. Corporate
- ii. Geographical Spread
- iii. Key Clients & Strategic Partnerships
- iv. High-level View of Offerings
- v. Juniper Research's View: Key Strengths & Strategic Development Opportunities
- 4.1.1. 3S Money
- 4.2. Juniper Research Future Leaders Index Assessment Methodology
- 4.3. Limitations & Interpretations
- Table 4.5: Juniper Research Future Leaders Index: B2B Payments Criteria
- 4.4. Related Research
Data & Forecasting
1. Market Landscape
- 1.1. Introduction
- 1.2. Definitions
- Figure 1.1: Juniper Research's 8 Key Regions - Definition
2. Forecast Overview
- 2.1. Total Volume
- Figure & Table 2.1: Total Volume of B2B Payments (m), Split by 8 Key Regions, 2025-2030
- 2.2. Total Value
- Figure & Table 2.2: Total Value of B2B Payments ($m), Split by 8 Key Regions, 2025-2030
- 2.3. Payment Channel
- Figure & Table 2.3: Total Value of B2B Payments ($m), Split by Payment Channel, 2025-2030
3. Domestic B2B Payments Forecast
- 3.1. Introduction
- 3.2. Methodology and Assumptions
- Figure 3.1: B2B Domestic Payments Market - Forecast Methodology
- 3.3. Domestic Forecasts
- 3.3.1. Number of Domestic B2B Transactions
- Figure & Table 3.2: Number of Domestic B2B Payments per annum (m), Split by 8 Key Regions, 2025-2030
- 3.3.2. Value of Domestic B2B Transactions
- Figure & Table 3.3: Total Value of B2B Domestic Payments ($m), Split by 8 Key Regions, 2025-2030
- 3.3.3. Card Payments
- Figure & Table 3.4: Total Value of Domestic B2B Payments via Card ($m), Split by 8 Key Regions, 2025-2030
- 3.3.4. Instant Payments
- Figure & Table 3.5: Total Value of Domestic B2B Payments via Instant Payments ($m), Split by 8 Key Regions, 2025-2030
- 3.3.5. Domestic Payment Channels
- Figure & Table 3.6: Total Value of Domestic B2B Payments ($m), Split by Payment Channel, 2025-2030
- 3.3.1. Number of Domestic B2B Transactions
4. Cross-border B2B Payments
- 4.1. Introduction
- 4.2. Methodology & Assumptions
- Figure 4.1: B2B Cross-border B2B Payments - Forecast Methodology
- 4.3. Cross-border Forecasts
- 4.3.1. Number of Transactions
- Figure & Table 4.2: Total Number of Outflow Cross-border B2B Payments per annum (m), Split by 8 Key Regions, 2025-2030
- 4.3.2. Value of Transactions
- Figure & Table 4.3: Total Value of Cross-border Outflow Payments ($m), Split by 8 Key Regions, 2025-2030
- 4.3.3. Wire Transfer
- Figure & Table 4.4: Total Value of Cross-border Payments via Wire Transfer ($m), Split by 8 Key Regions, 2024-2030
- 4.3.4. Cross-border Payments Channels
- Figure & Table 4.5: Total Value of Cross-border B2B Payments ($m), Split by Payments Channel, 2025-2030
- 4.3.1. Number of Transactions
