|
시장보고서
상품코드
1800226
토탈 스테이션 시장 : 예측(2025-2030년)Total Station Market - Forecasts fom 2025 to 2030 |
||||||
토탈 스테이션 시장은 2025년 20억 800만 달러에서 2030년에는 26억 달러로 성장할 것으로 예측, CAGR은 5.31%
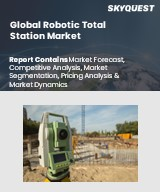
토탈 스테이션 시장은 건설, 운송, 광업, 유틸리티 등 다양한 산업에서 정밀하고 효율적인 토지 측량에 대한 수요가 증가함에 따라 강력한 성장세를 보이고 있습니다. 전자 경위의, 거리계, 마이크로프로세서, 데이터 저장 시스템을 결합한 토탈 스테이션은 정확한 각도, 거리, 좌표 측정, 데이터 처리에 필수적인 요소입니다.
시장 성장 촉진요인
인프라 투자 증가
토탈 스테이션 시장의 주요 촉진요인은 전 세계 인프라 정비 투자의 급증입니다. 토탈 스테이션은 건물, 도로, 교량, 터널을 포함한 프로젝트의 토지 측량에 필수적이며, 기존 장비에 비해 뛰어난 정확도, 효율성, 기능성을 제공합니다. 토탈 스테이션은 지하 구조물의 지반 공학 모니터링을 지원하여 운송 용도에서 정확한 정렬을 보장합니다. 업계 예측에 따르면, 세계 인프라 투자가 크게 증가할 것으로 예상되며, 정부와 민간 부문이 대규모 프로젝트를 우선시하기 때문에 토탈 스테이션에 대한 수요가 증가하고 있습니다. 프로젝트 사양과 일정을 충족시키기 위한 정확한 측정의 필요성이 시장의 성장을 더욱 가속화하고 있습니다.
기술 발전
전지구측위시스템(GPS), 로봇 기능과의 통합 등 토탈 스테이션 기술의 발전으로 측량 작업의 효율성과 생산성이 향상되고 있습니다. 이러한 기술 혁신은 실시간 위치 확인, 데이터 수집의 효율성 및 정확도 향상을 가능하게 하여 토탈 스테이션은 현대 인프라 프로젝트에 필수적인 요소로 자리 잡았습니다. 고해상도 이미지 처리, 고급 데이터 저장, 원활한 데이터 공유 등의 기능으로 인해 특히 엔지니어링, 건설 등 모든 산업 분야에서 채택이 확대되고 있습니다.
도시화와 산업 성장
신흥 경제국의 급속한 도시화와 산업 확대로 인해 정밀 측량 도구에 대한 수요가 증가하고 있습니다. 인구 증가와 경제 활동을 지원하기 위해 각국이 인프라 구축에 투자하는 가운데, 토탈 스테이션은 프로젝트의 정확성과 효율성을 보장하기 위해 필수적입니다. 이러한 추세는 건설 활동이 활발한 지역에서 특히 두드러지며, 대규모 토목공사부터 소규모 현장별 조사까지 모든 상황에서 토탈 스테이션이 사용되고 있습니다.
시장 성장 억제요인
토탈 스테이션 시장은 첨단 장비의 높은 비용으로 인해 중소기업이나 비용에 민감한 지역에서는 도입이 제한될 수 있습니다. 또한 고급 토탈 스테이션의 작동에는 전문적인 교육이 필요하며, 숙련된 측량 기술자의 부족은 시장 성장을 저해할 수 있습니다. 드론, 레이저 스캐너 등 대체 측량 기술과의 경쟁도 수요에 영향을 미칠 수 있습니다. 지속적인 시장 확장을 위해서는 비용 효율적인 솔루션과 교육 프로그램을 통해 이러한 문제를 해결하는 것이 필수적입니다.
목차
제1장 주요 요약
제2장 시장 현황
- 시장 개요
- 시장의 정의
- 조사 범위
- 시장 세분화
제3장 비즈니스 상황
- 시장 성장 촉진요인
- 시장 성장 억제요인
- 시장 기회
- Porter의 Five Forces 분석
- 업계 밸류체인 분석
- 정책 및 규제
- 전략적 제안
제4장 기술 전망
제5장 토탈 스테이션 시장 : 컴포넌트별
- 서론
- 하드웨어
- 소프트웨어 및 서비스
제6장 토탈 스테이션 시장 : 유형별
- 서론
- 수동
- 로봇
제7장 토탈 스테이션 시장 : 최종사용자별
- 서론
- 건설
- 광업
- 석유 및 가스
- 전력 및 유틸리티
- 농업
- 기타
제8장 토탈 스테이션 시장 : 지역별
- 서론
- 북미
- 미국
- 캐나다
- 멕시코
- 남미
- 브라질
- 아르헨티나
- 기타
- 유럽
- 독일
- 프랑스
- 영국
- 이탈리아
- 스페인
- 기타
- 중동 및 아프리카
- 사우디아라비아
- 아랍에미리트(UAE)
- 이스라엘
- 기타
- 아시아태평양
- 중국
- 인도
- 일본
- 한국
- 인도네시아
- 대만
- 기타
제9장 경쟁 환경과 분석
- 주요 기업과 전략 분석
- 시장 점유율 분석
- 합병, 인수, 합의 및 협업
- 경쟁 대시보드
제10장 기업 개요
- Changzhou Dadi Surveying Science & Technology Co
- Suzhou FOIF Co., Ltd
- Hexagon AB
- Hi-Target Surveying Instrument Co
- North Group Ltd.
- Trimble Inc.
- Topcon Corporation
- STONEX Srl
- GeoMax AG
- South Surveying & Mapping Technology CO., LTD.
제11장 부록
- 통화
- 전제조건
- 기준연도와 예측연도 타임라인
- 이해관계자에게 있어서의 주요 이점
- 조사 방법
- 약어
The total station market is expected to grow from USD2.008 billion in 2025 to USD2.600 billion in 2030, at a CAGR of 5.31%.
The total station market is experiencing robust growth, driven by the increasing demand for precise and efficient land surveying across various industries, including construction, transportation, mining, and utilities. Total stations, which combine electronic theodolites, distance meters, microprocessors, and data storage systems, are essential for accurate angle, distance, and coordinate measurements, as well as data processing.
Market Drivers
Rising Infrastructure Investments
The primary driver of the total station market is the global surge in infrastructure development investments. Total stations are critical for land surveying in projects involving buildings, roads, bridges, and tunnels, offering superior accuracy, efficiency, and functionality compared to traditional instruments. They support geotechnical monitoring for subsurface structures and ensure precise alignment in transportation applications. According to industry projections, global infrastructure investment is expected to rise significantly, driving demand for total stations as governments and private sectors prioritize large-scale projects. The need for accurate measurements to meet project specifications and timelines further amplifies market growth.
Technological Advancements
Advancements in total station technology, such as integration with Global Positioning System (GPS) and robotic capabilities, are enhancing efficiency and productivity in surveying operations. These innovations enable real-time positioning, streamline data collection, and improve accuracy, making total stations indispensable for modern infrastructure projects. Features like high-resolution imaging, advanced data storage, and seamless data sharing further boost their adoption across industries, particularly in engineering and construction.
Urbanization and Industrial Growth
Rapid urbanization and industrial expansion in developing economies are increasing the demand for precise surveying tools. As nations invest in infrastructure to support growing populations and economic activities, total stations are critical for ensuring project accuracy and efficiency. This trend is particularly pronounced in regions with high construction activity, where total stations are used for everything from large-scale civil engineering projects to smaller, site-specific surveys.
Market Restraints
The total station market faces challenges due to the high cost of advanced equipment, which can limit adoption among smaller firms or in cost-sensitive regions. Additionally, operating sophisticated total stations requires specialized training, and a shortage of skilled surveyors may hinder market growth. Competition from alternative surveying technologies, such as drones and laser scanners, could also impact demand. Addressing these challenges through cost-effective solutions and enhanced training programs will be essential for sustained market expansion.
Market Segmentation
By Application
The market is segmented into construction, transportation, utilities, oil and gas, mining, agriculture, and others. The construction segment is expected to witness robust growth, driven by the need for precise measurements in building and infrastructure projects. Total stations are tailored for various construction applications, from large-scale civil engineering to indoor site surveys. Transportation and mining also contribute significantly, leveraging total stations for alignment and geotechnical monitoring.
By Geography
The market is segmented into North America, Europe, Asia-Pacific, South America, and the Middle East and Africa. North America, particularly the United States, holds a significant share due to ongoing infrastructure projects, high adoption of advanced surveying technologies, and robust demand from engineering and land development sectors. Asia-Pacific is expected to grow rapidly, driven by urbanization and infrastructure investments in countries like China and India. Europe, South America, and the Middle East and Africa are also poised for growth, supported by increasing construction and industrial activities.
The total station market is set for significant growth from 2025 to 2030, driven by rising infrastructure investments, technological advancements, and global urbanization. Despite challenges from high costs and skill requirements, the market's outlook remains positive, particularly in North America and Asia-Pacific. Industry players must focus on developing affordable, user-friendly total stations and expanding training initiatives to capitalize on the growing demand for precise surveying solutions across diverse applications.
Key Benefits of this Report:
- Insightful Analysis: Gain detailed market insights covering major as well as emerging geographical regions, focusing on customer segments, government policies and socio-economic factors, consumer preferences, industry verticals, and other sub-segments.
- Competitive Landscape: Understand the strategic maneuvers employed by key players globally to understand possible market penetration with the correct strategy.
- Market Drivers & Future Trends: Explore the dynamic factors and pivotal market trends and how they will shape future market developments.
- Actionable Recommendations: Utilize the insights to exercise strategic decisions to uncover new business streams and revenues in a dynamic environment.
- Caters to a Wide Audience: Beneficial and cost-effective for startups, research institutions, consultants, SMEs, and large enterprises.
What do businesses use our reports for?
Industry and Market Insights, Opportunity Assessment, Product Demand Forecasting, Market Entry Strategy, Geographical Expansion, Capital Investment Decisions, Regulatory Framework & Implications, New Product Development, Competitive Intelligence
Report Coverage:
- Historical data from 2020 to 2024 & forecast data from 2025 to 2030
- Growth Opportunities, Challenges, Supply Chain Outlook, Regulatory Framework, and Trend Analysis
- Competitive Positioning, Strategies, and Market Share Analysis
- Revenue Growth and Forecast Assessment of segments and regions including countries
- Company Profiling (Strategies, Products, Financial Information, and Key Developments among others.
Total Station Market Segmentation
By Component
- Hardware
- Software & Services
By Type
- Manual
- Robotic
By End-User
- Construction
- Mining
- Oil & Gas
- Power & Utilities
- Agriculture
- Others
By Geography
- North America
- USA
- Canada
- Mexico
- South America
- Brazil
- Argentina
- Others
- Europe
- United Kingdom
- Germany
- France
- Italy
- Spain
- Others
- Middle East and Africa
- Saudi Arabia
- UAE
- Iran
- Others
- Asia Pacific
- Japan
- China
- India
- South Korea
- Indonesia
- Taiwan
- Others
TABLE OF CONTENTS
1. EXECUTIVE SUMMARY
2. MARKET SNAPSHOT
- 2.1. Market Overview
- 2.2. Market Definition
- 2.3. Scope of the Study
- 2.4. Market Segmentation
3. BUSINESS LANDSCAPE
- 3.1. Market Drivers
- 3.2. Market Restraints
- 3.3. Market Opportunities
- 3.4. Porter's Five Forces Analysis
- 3.5. Industry Value Chain Analysis
- 3.6. Policies and Regulations
- 3.7. Strategic Recommendations
4. TECHNOLOGICAL OUTLOOK
5. TOTAL STATION MARKET BY COMPONENT
- 5.1. Introduction
- 5.2. Hardware
- 5.3. Software & Services
6. TOTAL STATION MARKET BY TYPE
- 6.1. Introduction
- 6.2. Manual
- 6.3. Robotic
7. TOTAL STATION MARKET BY END-USER
- 7.1. Introduction
- 7.2. Construction
- 7.3. Mining
- 7.4. Oil & Gas
- 7.5. Power & Utilities
- 7.6. Agriculture
- 7.7. Others
8. TOTAL STATION MARKET BY GEOGRAPHY
- 8.1. Introduction
- 8.2. North America
- 8.2.1. USA
- 8.2.2. Canada
- 8.2.3. Mexico
- 8.3. South America
- 8.3.1. Brazil
- 8.3.2. Argentina
- 8.3.3. Others
- 8.4. Europe
- 8.4.1. Germany
- 8.4.2. France
- 8.4.3. United Kingdom
- 8.4.4. Italy
- 8.4.5. Spain
- 8.4.6. Others
- 8.5. Middle East and Africa
- 8.5.1. Saudi Arabia
- 8.5.2. UAE
- 8.5.3. Israel
- 8.5.4. Others
- 8.6. Asia Pacific
- 8.6.1. China
- 8.6.2. India
- 8.6.3. Japan
- 8.6.4. South Korea
- 8.6.5. Indonesia
- 8.6.6. Taiwan
- 8.6.7. Others
9. COMPETITIVE ENVIRONMENT AND ANALYSIS
- 9.1. Major Players and Strategy Analysis
- 9.2. Market Share Analysis
- 9.3. Mergers, Acquisitions, Agreements, and Collaborations
- 9.4. Competitive Dashboard
10. COMPANY PROFILES
- 10.1. Changzhou Dadi Surveying Science & Technology Co
- 10.2. Suzhou FOIF Co., Ltd
- 10.3. Hexagon AB
- 10.4. Hi-Target Surveying Instrument Co
- 10.5. North Group Ltd.
- 10.6. Trimble Inc.
- 10.7. Topcon Corporation
- 10.8. STONEX Srl
- 10.9. GeoMax AG
- 10.10. South Surveying & Mapping Technology CO., LTD.
11. APPENDIX
- 11.1. Currency
- 11.2. Assumptions
- 11.3. Base and Forecast Years Timeline
- 11.4. Key Benefits for the Stakeholders
- 11.5. Research Methodology
- 11.6. Abbreviations


