


|
시장보고서
상품코드
1797401
열병합발전(CHP) 시장 : 용량별, 원동기별, 최종사용자별, 연료별, 지역별 - 예측(-2030년)Combined Heat and Power Market by Capacity, Prime Mover, End User, Fuel, and Region - Global Forecast to 2030 |
||||||
세계의 열병합발전(CHP) 시장 규모는 2025년 320억 2,000만 달러에서 2030년까지 414억 8,000만 달러에 이를 것으로 추정되며, 예측 기간에 CAGR로 5.3%의 성장이 전망됩니다.
| 조사 범위 | |
|---|---|
| 조사 대상 연도 | 2019-2030년 |
| 기준 연도 | 2024년 |
| 예측 기간 | 2025-2030년 |
| 단위 | 100만 달러/10억 달러 |
| 부문 | 용량, 원동기, 연료, 최종사용자 |
| 대상 지역 | 북미, 유럽, 아시아태평양, 남미, 중동 및 아프리카. |
이 시장은 효율적이고 지속 가능한 에너지 시스템에 대한 수요 증가, 분산형 발전에 대한 투자 증가, 열병합 발전 기술 활용을 지원하는 유리한 정부 정책에 힘입어 성장하고 있습니다. 또한, 천연가스 기반 CHP 시스템 및 재생에너지원의 기술 혁신은 산업, 상업 및 주거 부문에서 CHP 솔루션의 빠른 전환을 촉진하고 있습니다.
산업 부문은 예측 기간 동안 열병합 발전 시장에서 가장 큰 최종 사용자가 될 것입니다.
산업 부문은 열병합발전(CHP) 시장의 가장 큰 최종 사용자입니다. 이는 에너지 절약에 대한 요구 증가, 공정 가열에 대한 관심, 지속 가능한 생산에 대한 집착 때문입니다. 산업 부문은 에너지 기술 관련 기술 혁신에 많은 투자를 하고 있습니다. 또한, 이 부문은 청정에너지 사용을 촉진하는 정부 정책도 호의적으로 받아들여지고 있습니다. 안정적인 전력 공급을 보장하고, 운영 비용을 절감하며, 환경적 지속가능성 목표를 달성하기 위한 주요 제조 및 가공 기업의 CHP 시스템 채택이 증가하면서 산업 부문 수요를 촉진하고 있습니다.
"유럽이 예측 기간 동안 두 번째 시장이 될 것으로 예측됩니다. "
산업 에너지 솔루션의 큰 존재감과 재생에너지의 통합으로 유럽은 열병합 발전의 두 번째 시장이 될 것으로 추정됩니다. 이 지역은 이미 강력한 유틸리티 부문을 보유하고 있으며, 에너지 절약 기술에 대한 대규모 투자가 이루어지고 있습니다. 또한 이 지역은 청정에너지와 전기화에 대한 정부의 우호적인 정책도 특징입니다. 독일, 영국 등 주요 유틸리티 및 제조 기업들은 신뢰성과 지속가능성을 높이기 위해 CHP 시스템 채택을 늘리고 있습니다.
세계의 열병합발전(CHP) 시장에 대해 조사 분석했으며, 주요 촉진요인과 억제요인, 경쟁 구도, 향후 동향 등의 정보를 전해드립니다.
목차
제1장 서론
제2장 조사 방법
제3장 주요 요약
제4장 중요 지견
- 열병합발전 발전 시장 기업에 있어서 매력적인 기회
- 열병합발전(CHP) 시장 : 지역별
- 아시아태평양 열병합발전(CHP) 시장 : 최종사용자별, 국가별
- 열병합발전(CHP) 시장 : 용량별
- 열병합발전(CHP) 시장 : 원동기별
- 열병합발전(CHP) 시장 : 연료별
- 열병합발전(CHP) 시장 : 최종사용자별
제5장 시장 개요
- 서론
- 시장 역학
- 성장 촉진요인
- 성장 억제요인
- 기회
- 과제
- 고객의 비즈니스에 영향을 미치는 동향/혼란
- 가격 결정 분석
- 소용량 열병합발전 시스템 평균 설치 비용 동향 : 원동기별(2021년-2024년)
- 대용량 열병합발전 시스템 평균 설치 비용 동향 : 원동기별
- 열병합발전 시스템 평균 설치 비용 동향 : 지역별
- 밸류체인 분석
- 원재료 프로바이더/컴포넌트 제조업체/공급업체
- 열병합발전 시스템 제조업체/조립 업자
- 판매업체/재판 업자
- 최종사용자
- 유지관리/서비스 제공업체
- 생태계 분석
- 기술 분석
- 주요 기술
- 인접 기술
- 규제 상황
- 특허 분석
- 무역 분석
- HS코드 8406
- HS코드 841182
- 주요 컨퍼런스 및 이벤트(2025년-2026년)
- 관세 분석
- Porter의 Five Forces 분석
- 사례 연구 분석
- SIEMENS ENERGY, CHP 솔루션을 활용해 산업 사용자 운영 보안 향상과 에너지 비용 절감을 지원
- TATA CHEMICALS, 이산화탄소 배출 감축과 중탄산나트륨 생산 증가 모아 두어 새로운 코제네레이션(cogeneration) 시스템을 전개
- NHS, 탄소 삭감 목표 달성 싶은 VEOLIA CHP에 근거한 시스템을 설치
- 주요 이해관계자와 구입 기준
- 열병합발전(CHP) 시장에 대한 생성형 AI/AI의 영향
- 열병합발전(CHP) 시장 생성형 AI/AI 이용 사례
- 주요 최종사용자에 대한 생성형 AI/AI의 영향 : 지역별
- 열병합발전(CHP) 시장에 대한 2025년 미국 관세의 영향
- 서론
- 주요 관세율
- 국가/지역에 대한 영향
- 최종사용자에 대한 영향
제6장 열병합발전(CHP) 시장 : 용량별
- 서론
- 10MW 이하
- 11-150MW
- 151-300MW
- 300MW 이상
제7장 열병합발전(CHP) 시장 : 최종사용자별
- 서론
- 주택
- 상업
- 산업
- 유틸리티
제8장 열병합발전(CHP) 시장 : 연료별
- 서론
- 석탄
- 천연가스
- 바이오가스 및 바이오매스
- 핵
- 디젤
- 기타 연료
제9장 열병합발전(CHP) 시장 : 원동기별
- 서론
- 가스 터빈
- 증기 터빈
- 왕복기관
- 연료전지
- 마이크로터빈
- 기타 원동기
제10장 열병합발전(CHP) 시장 : 지역별
- 서론
- 북미
- 미국
- 캐나다
- 멕시코
- 유럽
- 독일
- 영국
- 프랑스
- 이탈리아
- 러시아
- 기타 유럽
- 아시아태평양
- 중국
- 일본
- 한국
- 호주
- 인도
- 기타 아시아태평양
- 중동 및 아프리카
- GCC
- 남아프리카공화국
- 튀르키예
- 나이지리아
- 알제리
- 기타 중동 및 아프리카
- 남미
- 브라질
- 아르헨티나
- 기타 남미
제11장 경쟁 구도
- 개요
- 주요 시장 진출기업의 전략/강점(2017년-2025년)
- 시장 점유율 분석(2023년)
- 매출 분석(2020년-2024년)
- 기업 평가 매트릭스 : 주요 기업(2024년)
- 기업 실적 : 주요 기업(2024년)
- 경쟁 시나리오
제12장 기업 개요
- 주요 기업
- GE VERNOVA
- SIEMENS ENERGY
- WARTSILA
- 2G ENERGY INC.
- MITSUBISHI HEAVY INDUSTRIES, LTD.
- CLARKE ENERGY
- CATERPILLAR
- E. ON SE
- VEOLIA
- ROBERT BOSCH GMBH
- EVERLLENCE
- AB HOLDING SPA
- FUELCELL ENERGY, INC.
- CAPSTONE GREEN ENERGY HOLDINGS, INC.
- CUMMINS INC.
- 기타 기업
- CENTRICA
- TECOGEN, INC.
- BDR THERMEA GROUP
- VIESSMANN GROUP
- JENBACHER
- CLEARCELL POWER
- KRAFT POWER
- ENEXOR ENERGY LLC
- RESET
- HELEC
제13장 부록
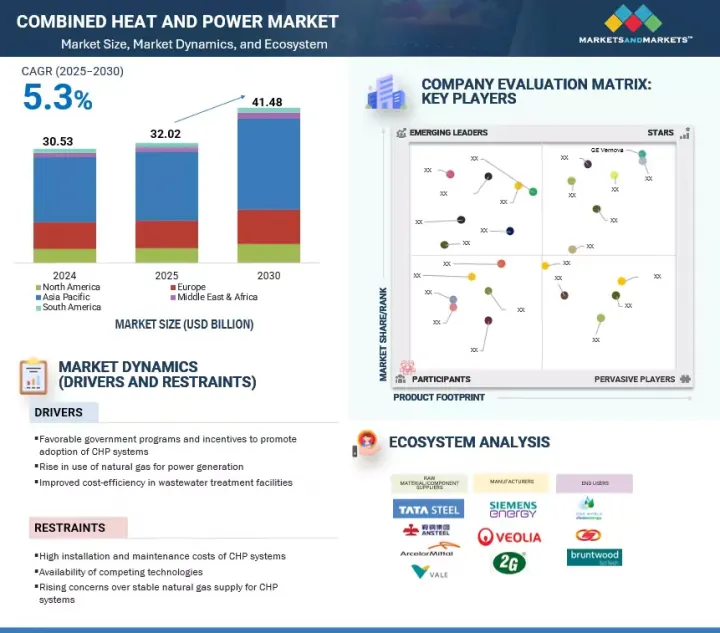
LSH 25.09.01The global combined heat and power market is estimated to grow from USD 32.02 billion in 2025 to USD 41.48 billion by 2030, at a CAGR of 5.3% during the forecast period.
| Scope of the Report | |
|---|---|
| Years Considered for the Study | 2019-2030 |
| Base Year | 2024 |
| Forecast Period | 2025-2030 |
| Units Considered | Value (USD Million/Billion) |
| Segments | By capacity, prime mover, fuel, and end User |
| Regions covered | North America, Europe, Asia Pacific, South America, and Middle East & Africa. |
The market is propelled by the rising demand for efficient and sustainable energy systems, mounting investments in distributed generating power, and favorable government policies that support the usage of cogeneration technologies. Moreover, innovations in natural gas-driven CHP systems and renewable energy sources are promoting faster sector-wide migration of CHP solutions across industrial, commercial, and residential environments.

Industrial segment to be largest end user in combined heat and power market during forecast period"
The industrial sector is the largest end user of the combined heat and power market. This is due to the growing energy-saving needs, more attention to process heating, and adherence to sustainable production. The industrial sector is making substantial investments in innovation with regard to energy technologies. Moreover, this sector is witnessing favorable government policies that promote the use of clean energy. The increased adoption of CHP systems by large manufacturing and processing firms to ensure consistent power supply, lower operating expenses, and attain environmental sustainability objectives is driving the demand in the industrial sector.
"Europe estimated to be second-largest market during forecast period"
Europe is estimated to be the second-largest market for combined heat and power due to the considerable presence of industrial energy solutions and integration of renewable energy. The region already has a strong utilities sector and has witnessed extensive investment in energy-efficient technology. The region is also characterized by favorable government policy regarding clean energy and electrification. The major utility and manufacturing firms in countries like Germany and the UK are increasingly adopting CHP systems to increase reliability and sustainability.
In-depth interviews have been conducted with various key industry participants, subject-matter experts, C-level executives of key market players, and industry consultants, among other experts, to obtain and verify critical qualitative and quantitative information and assess future market prospects. The distribution of primary interviews is as follows:
By Company Type: Tier 1- 65%, Tier 2- 24%, and Tier 3 - 11%
By Designation: C-level Executives - 30%, Directors - 25%, and Others - 45%
By Region: North America - 20%, Europe - 30%, Asia Pacific - 40%, Middle East & Africa - 12%, and South America - 8%
Notes: The tiers of the companies are defined based on their total revenues as of 2024. Tier 1: > USD 1 billion, Tier 2: USD 500 million to USD 1 billion, and Tier 3: < USD 500 million.
Other designations include sales managers, engineers, and regional managers.
Siemens, Wartsila, GE Vernova, Veolia, and MITSUBISHI HEAVY INDUSTRIES, LTD. are some of the major players in the combined heat and power market. The study includes an in-depth competitive analysis of these key players, including their company profiles, recent developments, and key market strategies.
Research Coverage:
The report defines, describes, and forecasts the global combined heat and power market by capacity, prime mover, fuel, end user, and region. It also offers a detailed qualitative and quantitative analysis of the market. The report comprehensively reviews the major market drivers, restraints, opportunities, and challenges. It also covers various important aspects of the market. These include an analysis of the competitive landscape, market dynamics, market estimates in terms of value, and future trends in the combined heat and power market.
Key Benefits of Buying the Report
- It provides an analysis of key drivers (Rise of natural gas for power generation), restraints (Rising concerns over stable natural gas supply for CHP systems), opportunities (Surging replacement and upgrade of aged power generation equipment), and challenges (High damage to prime movers from impurities generated from biogas fuel) influencing the growth of the combined heat and power market.
- Market Development: In February 2021, Caterpillar introduced the MWM online condition monitoring system called the MWM Remote Asset Monitoring (RAM). This offers push notifications in the case of alerts, warnings, or malfunctions, and assists in optimizing workflows as well as coordinating support processes more systematically. It provides reports about the power, operating hours, and current & historical performances.
- Product Innovation/Development: The market for combined heat and power (CHP) systems has seen substantial product innovation, with particularly strong results in IoT-enabled diagnostics and predictive maintenance capability of the most developed systems. These innovations are aimed at increasing energy efficiency, decreasing the working time of the system, and avoiding operational failures in diverse end-use applications such as industrial complexes, commercial premises, and electricity grids.
- Market Diversification: In August 2021, Capstone Green Energy expanded its operations in the UK by completing the grid interconnect expansion at the UK Integrated Remanufacturing Facility. This facility would build and test Capstone's C200 engines. It serves the sustainable energy needs of the EMEA (Europe, Middle East & Africa) region.
- Competitive Assessment: It provides an in-depth assessment of market shares, growth strategies, and service offerings of leading players in the combined heat and power market, such as GE Vernova (US), Siemens Energy (Germany), Wartsila (Finland), Veolia (France), MITSUBISHI HEAVY INDUSTRIES, LTD. (Japan).
TABLE OF CONTENTS
1 INTRODUCTION
- 1.1 STUDY OBJECTIVES
- 1.2 MARKET DEFINITION
- 1.3 STUDY SCOPE
- 1.3.1 MARKETS COVERED AND REGIONAL SCOPE
- 1.3.2 INCLUSIONS AND EXCLUSIONS
- 1.3.3 YEARS CONSIDERED
- 1.4 UNIT CONSIDERED
- 1.5 CURRENCY CONSIDERED
- 1.6 LIMITATIONS
- 1.7 STAKEHOLDERS
- 1.8 SUMMARY OF CHANGES
2 RESEARCH METHODOLOGY
- 2.1 RESEARCH DATA
- 2.1.1 SECONDARY DATA
- 2.1.1.1 Key data from secondary sources
- 2.1.1.2 List of major secondary sources
- 2.1.2 PRIMARY DATA
- 2.1.2.1 List of key primary interview participants
- 2.1.2.2 Key data from primary sources
- 2.1.2.3 Key industry insights
- 2.1.2.4 Breakdown of primaries
- 2.1.1 SECONDARY DATA
- 2.2 DATA TRIANGULATION
- 2.3 MARKET SCOPE
- 2.4 MARKET SIZE ESTIMATION
- 2.4.1 BOTTOM-UP APPROACH
- 2.4.2 TOP-DOWN APPROACH
- 2.4.3 DEMAND-SIDE ANALYSIS
- 2.4.3.1 Regional analysis (demand side)
- 2.4.3.2 Country-level analysis (demand side)
- 2.4.3.3 Demand-side calculations
- 2.4.3.4 Demand-side assumptions
- 2.4.4 SUPPLY-SIDE ANALYSIS
- 2.4.4.1 Supply-side calculations
- 2.4.4.2 Supply-side assumptions
- 2.4.5 GROWTH FORECAST ASSUMPTIONS
- 2.5 RISK ASSESSMENT
- 2.6 RESEARCH ASSUMPTIONS
- 2.7 RESEARCH LIMITATIONS
3 EXECUTIVE SUMMARY
4 PREMIUM INSIGHTS
- 4.1 ATTRACTIVE OPPORTUNITIES FOR PLAYERS IN COMBINED HEAT AND POWER MARKET
- 4.2 COMBINED HEAT AND POWER MARKET, BY REGION
- 4.3 COMBINED HEAT AND POWER MARKET IN ASIA PACIFIC, BY END USER AND COUNTRY
- 4.4 COMBINED HEAT AND POWER MARKET, BY CAPACITY
- 4.5 COMBINED HEAT AND POWER MARKET, BY PRIME MOVER
- 4.6 COMBINED HEAT AND POWER MARKET, BY FUEL
- 4.7 COMBINED HEAT AND POWER MARKET, BY END USER
5 MARKET OVERVIEW
- 5.1 INTRODUCTION
- 5.2 MARKET DYNAMICS
- 5.2.1 DRIVERS
- 5.2.1.1 Favorable government programs and incentives
- 5.2.1.2 Rise in use of natural gas for power generation
- 5.2.1.3 Improved cost-efficiency in wastewater treatment facilities
- 5.2.2 RESTRAINTS
- 5.2.2.1 High installation and maintenance costs
- 5.2.2.2 Dominance of hydroelectric energy
- 5.2.2.3 Rising concerns over stable natural gas supply
- 5.2.3 OPPORTUNITIES
- 5.2.3.1 Increasing deployment of micro-CHP systems
- 5.2.3.2 Pressing need to replace and upgrade aged power generation equipment
- 5.2.3.3 Rising trend of distributed power generation
- 5.2.4 CHALLENGES
- 5.2.4.1 Damaged prime movers due to high contamination from biogas fuel
- 5.2.4.2 Challenges posed by utilities for sale of excess electricity
- 5.2.4.3 Stability issues arising from decentralization of energy generation
- 5.2.1 DRIVERS
- 5.3 TRENDS/DISRUPTIONS IMPACTING CUSTOMER BUSINESS
- 5.4 PRICING ANALYSIS
- 5.4.1 AVERAGE INSTALLATION COST TREND OF SMALL-CAPACITY COMBINED HEAT AND POWER SYSTEMS, BY PRIME MOVER, 2021-2024
- 5.4.2 AVERAGE INSTALLATION COST TREND OF LARGE-CAPACITY COMBINED HEAT AND POWER SYSTEMS, BY PRIME MOVER
- 5.4.3 AVERAGE INSTALLATION COST TREND OF COMBINED HEAT AND POWER SYSTEMS, BY REGION
- 5.5 VALUE CHAIN ANALYSIS
- 5.5.1 RAW MATERIAL PROVIDERS/COMPONENT MANUFACTURERS/SUPPLIERS
- 5.5.2 COMBINED HEAT AND POWER SYSTEM MANUFACTURERS/ASSEMBLERS
- 5.5.3 DISTRIBUTORS/RESELLERS
- 5.5.4 END USERS
- 5.5.5 MAINTENANCE/SERVICE PROVIDERS
- 5.6 ECOSYSTEM ANALYSIS
- 5.7 TECHNOLOGY ANALYSIS
- 5.7.1 KEY TECHNOLOGIES
- 5.7.1.1 Hybrid storage system with lithium-ion and redox flow battery
- 5.7.2 ADJACENT TECHNOLOGIES
- 5.7.2.1 Advanced control and monitoring systems
- 5.7.1 KEY TECHNOLOGIES
- 5.8 REGULATORY LANDSCAPE
- 5.9 PATENT ANALYSIS
- 5.10 TRADE ANALYSIS
- 5.10.1 HS CODE 8406
- 5.10.1.1 Export data (HS code 8406)
- 5.10.1.2 Import data (HS code 8406)
- 5.10.2 HS CODE 841182
- 5.10.2.1 Export data (HS code 841182)
- 5.10.2.2 Import data (HS code 841182)
- 5.10.1 HS CODE 8406
- 5.11 KEY CONFERENCES AND EVENTS, 2025-2026
- 5.12 TARIFF ANALYSIS
- 5.12.1 TARIFF RELATED TO COMBINED HEAT AND POWER MARKET
- 5.13 PORTER'S FIVE FORCES ANALYSIS
- 5.13.1 THREAT OF SUBSTITUTES
- 5.13.2 BARGAINING POWER OF SUPPLIERS
- 5.13.3 BARGAINING POWER OF BUYERS
- 5.13.4 THREAT OF NEW ENTRANTS
- 5.13.5 INTENSITY OF COMPETITIVE RIVALRY
- 5.14 CASE STUDY ANALYSIS
- 5.14.1 SIEMENS ENERGY USES CHP SOLUTIONS TO HELP INDUSTRIAL USERS BOOST OPERATIONAL SECURITY AND REDUCE ENERGY COSTS
- 5.14.2 TATA CHEMICALS DEPLOYS NEW CHP SYSTEM TO REDUCE CARBON EMISSIONS AND INCREASE SODIUM BICARBONATE PRODUCTION
- 5.14.3 NHS INSTALLS VEOLIA'S CHP-BASED SYSTEM TO ACHIEVE CARBON REDUCTION TARGETS
- 5.15 KEY STAKEHOLDERS AND BUYING CRITERIA
- 5.15.1 KEY STAKEHOLDERS IN BUYING PROCESS
- 5.15.2 BUYING CRITERIA
- 5.16 IMPACT OF GENERATIVE AI/AI ON COMBINED HEAT AND POWER MARKET
- 5.16.1 USE CASES OF GENERATIVE AI/AI IN COMBINED HEAT AND POWER MARKET
- 5.16.2 IMPACT OF GENERATIVE AI/AI ON KEY END USERS, BY REGION
- 5.17 IMPACT OF 2025 US TARIFF ON COMBINED HEAT AND POWER MARKET
- 5.17.1 INTRODUCTION
- 5.17.2 KEY TARIFF RATES
- 5.17.3 IMPACT ON COUNTRY/REGION
- 5.17.3.1 North America
- 5.17.3.2 Europe
- 5.17.3.3 Asia Pacific
- 5.17.3.4 Middle East & Africa
- 5.17.3.5 South America
- 5.17.4 IMPACT ON END USERS
6 COMBINED HEAT AND POWER MARKET, BY CAPACITY
- 6.1 INTRODUCTION
- 6.2 UP TO 10 MW
- 6.2.1 SHIFT TOWARD NATURAL GAS AND RENEWABLE FUEL SOURCES TO BOOST DEMAND
- 6.3 11-150 MW
- 6.3.1 HIGH DEMAND FROM ENERGY-INTENSIVE INDUSTRIES TO FOSTER SEGMENTAL GROWTH
- 6.4 151-300 MW
- 6.4.1 INCREASING GENERATION OF NATURAL GAS-FIRED POWER TO DRIVE MARKET
- 6.5 ABOVE 300 MW
- 6.5.1 GROWING APPLICATIONS IN ALUMINUM SMELTING AND CEMENT PRODUCTION TO BOOST DEMAND
7 COMBINED HEAT AND POWER MARKET, BY END USER
- 7.1 INTRODUCTION
- 7.2 RESIDENTIAL
- 7.2.1 EMPHASIS ON DECENTRALIZED, RELIABLE, AND EFFICIENT ENERGY SOLUTIONS TO DRIVE MARKET
- 7.3 COMMERCIAL
- 7.3.1 RISING EMPHASIS ON ACHIEVING SUSTAINABILITY TARGETS AND REDUCING CARBON FOOTPRINT TO SUPPORT MARKET GROWTH
- 7.4 INDUSTRIAL
- 7.4.1 GROWING ENERGY-INTENSIVE MANUFACTURING TO BOOST DEMAND
- 7.5 UTILITIES
- 7.5.1 PRESENCE OF STRINGENT ENERGY EFFICIENCY REGULATIONS TO FUEL MARKET GROWTH
8 COMBINED HEAT AND POWER MARKET, BY FUEL
- 8.1 INTRODUCTION
- 8.2 COAL
- 8.2.1 RISING NUMBER OF COAL-FIRED POWER PLANTS TO FOSTER MARKET GROWTH
- 8.3 NATURAL GAS
- 8.3.1 FAVORABLE LNG PRICES TO DRIVE MARKET
- 8.4 BIOGAS/BIOMASS
- 8.4.1 PRESENCE OF SUPPORTIVE POLICIES AND RURAL ELECTRIFICATION PROGRAMS TO OFFER LUCRATIVE GROWTH OPPORTUNITIES
- 8.5 NUCLEAR
- 8.5.1 RISING APPLICATIONS IN LARGE URBAN CENTERS AND INDUSTRIAL PARKS TO FOSTER MARKET GROWTH
- 8.6 DIESEL
- 8.6.1 RISING NEED FOR RELIABLE AUXILIARY POWER TO BOOST DEMAND
- 8.7 OTHER FUELS
9 COMBINED HEAT AND POWER MARKET, BY PRIME MOVER
- 9.1 INTRODUCTION
- 9.2 GAS TURBINE
- 9.2.1 REDUCED NOX EMISSIONS TO FUEL MARKET GROWTH
- 9.3 STEAM TURBINE
- 9.3.1 REDUCED CARBON INTENSITY IN COAL-FIRED AND GEOTHERMAL PLANTS TO DRIVE MARKET
- 9.4 RECIPROCATING ENGINE
- 9.4.1 GROWING DEMAND IN AGRICULTURAL SECTOR TO BOOST DEMAND
- 9.5 FUEL CELL
- 9.5.1 DEVELOPMENT OF HIGH-TEMPERATURE PROTON EXCHANGE MEMBRANE SYSTEMS TO DRIVE MARKET
- 9.6 MICROTURBINE
- 9.6.1 SEAMLESS INTEGRATION WITH RENEWABLE ENERGY SOURCES TO BOOST DEMAND
- 9.7 OTHER PRIME MOVERS
10 COMBINED HEAT AND POWER MARKET, BY REGION
- 10.1 INTRODUCTION
- 10.2 NORTH AMERICA
- 10.2.1 US
- 10.2.1.1 Growing demand for energy efficiency in industries to foster market growth
- 10.2.2 CANADA
- 10.2.2.1 Expansion of combined cycle natural gas-fired power plants to boost demand
- 10.2.3 MEXICO
- 10.2.3.1 Governmental push for clean electricity production to fuel market growth
- 10.2.1 US
- 10.3 EUROPE
- 10.3.1 GERMANY
- 10.3.1.1 Growing emphasis on generating electricity from renewable sources to drive market
- 10.3.2 UK
- 10.3.2.1 Increasing need for flexible power generation to foster market growth
- 10.3.3 FRANCE
- 10.3.3.1 Rising emphasis on reducing dependence on nuclear power for electricity generation to drive market
- 10.3.4 ITALY
- 10.3.4.1 Government efforts to incentivize renewable energy projects to drive market
- 10.3.5 RUSSIA
- 10.3.5.1 Increasing trend of decentralized power generation to support market growth
- 10.3.6 REST OF EUROPE
- 10.3.1 GERMANY
- 10.4 ASIA PACIFIC
- 10.4.1 CHINA
- 10.4.1.1 Rapid industrialization and infrastructure development to support market growth
- 10.4.2 JAPAN
- 10.4.2.1 Rising shift toward gas-based energy generation from nuclear energy to fuel market growth
- 10.4.3 SOUTH KOREA
- 10.4.3.1 Growing emphasis on reducing methane emissions to foster market growth
- 10.4.4 AUSTRALIA
- 10.4.4.1 Enhanced grid infrastructure and energy-efficient solutions to accelerate market growth
- 10.4.5 INDIA
- 10.4.5.1 Government-led initiatives to boost natural gas share in energy mix to foster market growth
- 10.4.6 REST OF ASIA PACIFIC
- 10.4.1 CHINA
- 10.5 MIDDLE EAST & AFRICA
- 10.5.1 GCC
- 10.5.1.1 Saudi Arabia
- 10.5.1.1.1 Rising emphasis on reducing consumption of petroleum liquids in electricity generation to boost demand
- 10.5.1.2 UAE
- 10.5.1.2.1 Increasing share of renewables in electricity generation mix to propel market growth
- 10.5.1.3 Rest of GCC
- 10.5.1.1 Saudi Arabia
- 10.5.2 SOUTH AFRICA
- 10.5.2.1 Ongoing expansion of renewable energy to fuel market growth
- 10.5.3 TURKEY
- 10.5.3.1 Growing emphasis on boosting wind and solar capacity to support market growth
- 10.5.4 NIGERIA
- 10.5.4.1 Private sector investments in off-grid and hybrid solutions to boost demand
- 10.5.5 ALGERIA
- 10.5.5.1 Abundance of gas resources to boost demand
- 10.5.6 REST OF MIDDLE EAST & AFRICA
- 10.5.1 GCC
- 10.6 SOUTH AMERICA
- 10.6.1 BRAZIL
- 10.6.1.1 Growing emphasis on increasing power generation from renewables to drive market
- 10.6.2 ARGENTINA
- 10.6.2.1 Increasing FDIs in energy sector to foster market growth
- 10.6.3 REST OF SOUTH AMERICA
- 10.6.1 BRAZIL
11 COMPETITIVE LANDSCAPE
- 11.1 OVERVIEW
- 11.2 KEY PLAYER STRATEGIES/RIGHT TO WIN, 2017-2025
- 11.3 MARKET SHARE ANALYSIS, 2023
- 11.4 REVENUE ANALYSIS, 2020-2024
- 11.5 COMPANY EVALUATION MATRIX: KEY PLAYERS, 2024
- 11.5.1 STARS
- 11.5.2 PERVASIVE PLAYERS
- 11.5.3 EMERGING LEADERS
- 11.5.4 PARTICIPANTS
- 11.6 COMPANY FOOTPRINT: KEY PLAYERS, 2024
- 11.6.1 COMPANY FOOTPRINT
- 11.6.1.1 Capacity footprint
- 11.6.1.2 Prime mover footprint
- 11.6.1.3 Fuel footprint
- 11.6.1.4 Company end user footprint
- 11.6.1.5 Company region footprint
- 11.6.1 COMPANY FOOTPRINT
- 11.7 COMPETITIVE SCENARIO
- 11.7.1 PRODUCT LAUNCHES/DEVELOPMENTS
- 11.7.2 DEALS
- 11.7.3 EXPANSIONS
- 11.7.4 OTHER DEVELOPMENTS
12 COMPANY PROFILES
- 12.1 KEY PLAYERS
- 12.1.1 GE VERNOVA
- 12.1.1.1 Business overview
- 12.1.1.2 Products/Services/Solutions offered
- 12.1.1.3 Recent developments
- 12.1.1.3.1 Developments
- 12.1.1.4 MnM view
- 12.1.1.4.1 Key strategies/Right to win
- 12.1.1.4.2 Strategic choices
- 12.1.1.4.3 Weaknesses/Competitive threats
- 12.1.2 SIEMENS ENERGY
- 12.1.2.1 Business overview
- 12.1.2.2 Products/Services/Solutions offered
- 12.1.2.3 Recent developments
- 12.1.2.3.1 Deals
- 12.1.2.3.2 Other developments
- 12.1.2.4 MnM view
- 12.1.2.4.1 Key strategies/Right to win
- 12.1.2.4.2 Strategic choices
- 12.1.2.4.3 Weaknesses/Competitive threats
- 12.1.3 WARTSILA
- 12.1.3.1 Business overview
- 12.1.3.2 Products/Services/Solutions offered
- 12.1.3.3 Recent developments
- 12.1.3.3.1 Deals
- 12.1.3.3.2 Other developments
- 12.1.3.4 MnM view
- 12.1.3.4.1 Key strategies/Right to win
- 12.1.3.4.2 Strategic choices
- 12.1.3.4.3 Weaknesses/Competitive threats
- 12.1.4 2G ENERGY INC.
- 12.1.4.1 Business overview
- 12.1.4.2 Products/Services/Solutions offered
- 12.1.4.3 Recent developments
- 12.1.4.3.1 Product launches/Developments
- 12.1.4.3.2 Deals
- 12.1.4.3.3 Other developments
- 12.1.5 MITSUBISHI HEAVY INDUSTRIES, LTD.
- 12.1.5.1 Business overview
- 12.1.5.2 Products/Services/Solutions offered
- 12.1.5.3 Recent developments
- 12.1.5.3.1 Deals
- 12.1.5.3.2 Other developments
- 12.1.5.3.3 Expansions
- 12.1.5.4 MnM view
- 12.1.5.4.1 Key strategies/Right to win
- 12.1.5.4.2 Strategic choices
- 12.1.5.4.3 Weaknesses/Competitive threats
- 12.1.6 CLARKE ENERGY
- 12.1.6.1 Business overview
- 12.1.6.2 Products/Services/Solutions offered
- 12.1.6.3 Recent developments
- 12.1.6.3.1 Product launches/Developments
- 12.1.6.3.2 Other developments
- 12.1.7 CATERPILLAR
- 12.1.7.1 Business overview
- 12.1.7.2 Products/Services/Solutions offered
- 12.1.7.3 Recent developments
- 12.1.7.3.1 Product launches/Developments
- 12.1.7.3.2 Other developments
- 12.1.8 E. ON SE
- 12.1.8.1 Business overview
- 12.1.8.2 Products/Services/Solutions offered
- 12.1.8.3 Recent developments
- 12.1.8.3.1 Product launches/Developments
- 12.1.8.3.2 Deals
- 12.1.8.3.3 Other developments
- 12.1.9 VEOLIA
- 12.1.9.1 Business overview
- 12.1.9.2 Products/Services/Solutions offered
- 12.1.9.3 Recent developments
- 12.1.9.3.1 Deals
- 12.1.9.3.2 Other developments
- 12.1.9.4 MnM view
- 12.1.9.4.1 Key strategies/Right to win
- 12.1.9.4.2 Strategic choices
- 12.1.9.4.3 Weaknesses/Competitive threats
- 12.1.10 ROBERT BOSCH GMBH
- 12.1.10.1 Business overview
- 12.1.10.2 Products/Services/Solutions offered
- 12.1.10.3 Recent developments
- 12.1.10.3.1 Deals
- 12.1.10.3.2 Other developments
- 12.1.11 EVERLLENCE
- 12.1.11.1 Business overview
- 12.1.11.2 Products/Services/Solutions offered
- 12.1.11.3 Recent developments
- 12.1.11.3.1 Expansions
- 12.1.11.3.2 Other developments
- 12.1.12 AB HOLDING SPA
- 12.1.12.1 Business overview
- 12.1.12.2 Products/Services/Solutions offered
- 12.1.12.3 Recent developments
- 12.1.12.3.1 Other developments
- 12.1.13 FUELCELL ENERGY, INC.
- 12.1.13.1 Business overview
- 12.1.13.2 Products/Services/Solutions offered
- 12.1.13.3 Recent developments
- 12.1.13.3.1 Product launches/Developments
- 12.1.14 CAPSTONE GREEN ENERGY HOLDINGS, INC.
- 12.1.14.1 Business overview
- 12.1.14.2 Products/Services/Solutions offered
- 12.1.14.3 Recent developments
- 12.1.14.3.1 Deals
- 12.1.14.3.2 Other developments
- 12.1.15 CUMMINS INC.
- 12.1.15.1 Business overview
- 12.1.15.2 Products/Services/Solutions offered
- 12.1.15.3 Recent developments
- 12.1.15.3.1 Developments
- 12.1.1 GE VERNOVA
- 12.2 OTHER PLAYERS
- 12.2.1 CENTRICA
- 12.2.2 TECOGEN, INC.
- 12.2.3 BDR THERMEA GROUP
- 12.2.4 VIESSMANN GROUP
- 12.2.5 JENBACHER
- 12.2.6 CLEARCELL POWER
- 12.2.7 KRAFT POWER
- 12.2.8 ENEXOR ENERGY LLC
- 12.2.9 RESET
- 12.2.10 HELEC
13 APPENDIX
- 13.1 INSIGHTS FROM INDUSTRY EXPERTS
- 13.2 DISCUSSION GUIDE
- 13.3 KNOWLEDGESTORE: MARKETSANDMARKETS' SUBSCRIPTION PORTAL
- 13.4 CUSTOMIZATION OPTIONS
- 13.5 RELATED REPORTS
- 13.6 AUTHOR DETAILS
