


|
시장보고서
상품코드
1797409
스마트 포트 시장 : 기술별, 처리 능력별, 항만 유형별, 요소별, 지역별 - 예측(-2030년)Smart Port Market by Technology (IoT, Blockchain, Process Automation, AI), Throughput Capacity (High, Medium, & Low Throughput Capacity), Port Type (Seaports, Inland Ports), Element, and Region - Global Forecast to 2030 |
||||||
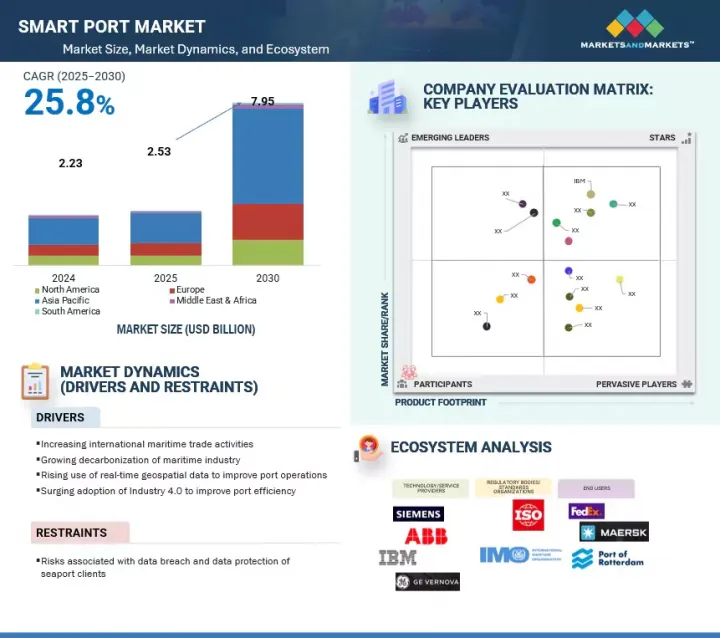
세계의 스마트 포트 시장 규모는 2024년 약 22억 3,000만 달러에서 2030년까지 79억 5,000만 달러에 이를 것으로 예측되며, CAGR 25.8%의 성장이 전망됩니다.
| 조사 범위 | |
|---|---|
| 조사 대상 연도 | 2021-2030년 |
| 기준연도 | 2024년 |
| 예측 기간 | 2025-2030년 |
| 단위 | 100만 달러/10억 달러 |
| 부문 | 항만 유형, 기술, 처리 능력, 요소 |
| 대상 지역 | 북미, 유럽, 아시아태평양, 남미, 중동 및 아프리카 |
세계 무역량의 80% 이상이 해상운송을 통해 이루어지기 때문에 물동량 증가, 무역회랑의 변화, 전자상거래 및 니어쇼어링(near-shoring) 추세로 인한 소비자 수요로 인해 항만 현대화 압력이 증가하고 있다(UNCTAD, 2024). AI를 활용한 분석, IoT를 활용한 자산 추적, 블록체인을 활용한 안전한 문서 작성, 실시간 업무 모니터링을 위한 디지털 트윈 등 스마트 기술을 도입하여 항만의 효율성을 높일 수 있습니다. 이러한 혁신은 국제적인 기후 변화 목표에 부합하는 빠른 처리시간과 탄소배출량 감소에 도움이 될 것입니다. 그러나 이러한 디지털 전환에는 과제도 있습니다. 사이버 보안 리스크가 크게 증가하고 있으며, 2024년 항만 인프라에 대한 대규모 공격이 여러 차례 발생할 것으로 예상되고 있습니다.
"기술별로는 IoT가 2025-2030년 두 번째로 빠르게 성장하는 시장이 될 것입니다. "
세계 항만의 자동화 및 디지털화로 인해 IoT는 실시간 가시성, 자산 추적 및 프로세스 효율화를 가능하게 하는 중요한 기술이 되었습니다. 초음파 센서, 관성 센서, RFID 리더기, 이미징 센서, 레이더, 무선 모듈 등 항만에 설치된 IoT 기능을 가진 장치를 사용하여 스마트 포트는 항만 시스템에서 운영 데이터를 통신하는 데 사용됩니다.
"고처리 용량 항만 부문이 2030년 가장 큰 시장 점유율을 차지할 것입니다. "
연간 1,900만 TEU가 넘는 물동량이 고처리 능력 항만을 통과하며 국제 무역의 진원지가 되고 있습니다. 중국, 싱가포르, 한국의 항구가 대표적인 사례로, 해상 물류와 세계 공급망 측면에서 생명선 역할을 하고 있습니다.
"유럽은 2025-2030년 스마트 항만 시장에서 두 번째로 높은 성장률을 나타낼 것입니다. "
세계에서 가장 선진적이고 처리 능력이 뛰어난 항구 중 일부는 유럽에 있습니다. 주목할 만한 사례로는 로테르담항(네덜란드), 앤트워프 브뤼헤항(벨기에), 함부르크항(독일) 등을 들 수 있습니다. 이들 항만은 디지털 기술 및 자동화 기술 채택으로 큰 발전을 이루었습니다. 이들 항만은 디지털 트윈, AI 기반 물류, IoT를 통한 자산 추적을 활용하여 스마트 항만 인프라를 선도하고 있습니다. 그 결과, 이들 항구는 보다 효율적이고 환경 친화적이며 효과적으로 물동량을 처리할 수 있게 되었습니다.
세계의 스마트포트 시장에 대해 조사 분석했으며, 주요 촉진요인과 억제요인, 경쟁 구도, 향후 동향 등의 정보를 전해드립니다.
목차
제1장 서론
제2장 조사 방법
제3장 주요 요약
제4장 중요 지견
- 스마트 포트 시장 기업에 있어서 매력적인 기회
- 스마트 포트 시장 : 지역별
- 북미의 스마트 포트 시장 : 처리 능력별, 국가별
- 스마트 포트 시장 : 요소별
- 스마트 포트 시장 : 기술별
- 스마트 포트 시장 : 처리 능력별
- 스마트 포트 시장 : 항만 유형별
제5장 시장 개요
- 서론
- 시장 역학
- 성장 촉진요인
- 성장 억제요인
- 기회
- 과제
- 고객의 비즈니스에 영향을 미치는 동향/혼란
- 생태계 분석
- 밸류체인 분석
- 기술 분석
- 주요 기술
- 인접 기술
- 가격 결정 분석
- 주요 컨퍼런스 및 이벤트(2025년-2026년)
- 규제 상황
- 규제기관, 정부기관, 기타 조직
- 스마트 포트 시장에 관련된 규제와 규제
- 특허 분석(2014년-2024년)
- Porter의 Five Forces 분석
- 주요 이해관계자와 구입 기준
- 사례 연구 분석
- 사례 연구 1 : 카보텍의 육상 전력 공급 솔루션은 항만에서의 배출량을 감축
- 사례 연구 2 : WIPRO와 ORACLE 클라우드 솔루션이 세계의 항만 경영 기업 디지털 전환을 실현
- 사례 연구 3 : 컨테이너 터미널 관리를 위한 사이버물리 시스템 구현
- 스마트 포트 시장 생성형 AI/AI의 영향
- 스마트 포트 시장 생성형 AI/AI 채택
- 항만 유형에 대한 생성형 AI/AI의 영향 : 지역별
- 스마트 포트 시장에 대한 AI의 영향 : 지역별
- 2025년 미국 관세의 영향 - 개요
- 서론
- 주요 관세율
- 국가/지역에 대한 영향
제6장 스마트 포트 시장 : 요소별
- 서론
- 스마트 포트 인프라
- 항만 교통 관리 시스템
- 터미널 자동화 및 카고 핸들링
- 스마트 포트 세이프티 및 보안 시스템
- 항만 커뮤니티 시스템
제7장 스마트 포트 시장 : 항만 유형별
- 서론
- 해항
- 내륙항
제8장 스마트 포트 시장 : 기술별
- 서론
- 프로세스 자동화
- IoT
- AI
- 블록체인
제9장 스마트 포트 시장 : 처리 능력별
- 서론
- HIGH THROUGHPUT PORTS
- MEDIUM THROUGHPUT PORTS
- LOW THROUGHPUT PORTS
제10장 스마트 포트 시장 : 지역별
- 서론
- 아시아태평양
- 중국
- 싱가포르
- 한국
- 일본
- 홍콩
- 기타 아시아태평양
- 유럽
- 독일
- 이탈리아
- 영국
- 네덜란드
- 기타 유럽
- 북미
- 미국
- 캐나다
- 멕시코
- 중동 및 아프리카
- 아랍에미리트(UAE)
- 사우디아라비아
- 쿠웨이트
- 남아프리카공화국
- 기타 중동 및 아프리카
- 남미
- 브라질
- 칠레
- 기타 남미
제11장 경쟁 구도
- 서론
- 주요 시장 진출기업의 전략/강점(2021년-2025년)
- 시장 점유율 분석(2024년)
- 기업 평가 매트릭스 : 주요 기업(2024년)
- 기업 평가 매트릭스 : 스타트업/중소기업(2024년)
- 경쟁 시나리오
제12장 기업 개요
- 주요 기업
- IBM
- ACCENTURE
- ABB
- SIEMENS
- GE VERNOVA
- TRELLEBORG AB
- ROYAL HASKONING
- KALMAR CORPORATION
- WIPRO
- RAMBOLL GROUP
- MICROSOFT
- TCS
- KALERIS
- IKUSI VELATIA
- ABU DHABI PORTS
- 기타 기업
- SCIENTIFIC ENTERPRISES
- NAUTIX
- IOCURRENTS
- PORT SOLUTIONS
- PORT OF ROTTERDAM
- APM TERMINALS
- HUTCHISON PORTS
- BLOC PORT
제13장 부록
LSH 25.09.02The smart port market is projected to reach USD 7.95 billion by 2030 from an estimated USD 2.23 billion in 2024, at a CAGR of 25.8%.
| Scope of the Report | |
|---|---|
| Years Considered for the Study | 2021-2030 |
| Base Year | 2024 |
| Forecast Period | 2025-2030 |
| Units Considered | Value (USD Million/Billion) |
| Segments | Port Type, Technology, Throughput Capacity, = and Element |
| Regions covered | North America, Europe, Asia Pacific, South America, and the Middle East & Africa |
As more than 80% of the world trade by volume is shipped by the ocean, there is an increasing pressure on ports to modernize due to growing volumes of cargo, changes in trade corridors, and consumer demand triggered by the e-commerce and nearshoring trends (UNCTAD, 2024). Embracing smart technologies such as AI-powered analytics, IoT-based asset tracking, blockchain for securing documentation, and digital twins for real-time operational monitoring makes ports more efficient. These innovations help shorten turnaround times and reduce carbon emissions in line with international climate targets. However, this digital transformation also presents challenges; cybersecurity risks have significantly increased, and in 2024, there have been several notable attacks on port infrastructure.

"Internet of Things (IoT), by technology, to be second fastest-growing market from 2025 to 2030"
By technology, the Internet of Things (IoT) segment will be the second fastest-growing segment in the smart port market between 2025 and 2030. Due to the automation and digitalization of ports worldwide, IoT has become the key technology that makes real-time visibility, asset tracking, and process efficiency possible. Using the devices with IoT capabilities installed in ports, including ultrasonic sensors, inertial sensors, RFID readers, imaging sensors, radars, and wireless modules, smart ports are used to communicate operational data over the port systems.
"High throughput ports segment, by throughput capacity, to hold largest market share in 2030"
The high-throughput ports segment, by throughput capacity, is expected to account for the largest market share in 2030. With over 19 million TEUs (twenty-foot equivalent units) per annum transited through these ports, they are the epicenter of international trade. The best examples of such ports can be found in China, Singapore, and South Korea, and they act as lifelines in terms of maritime logistics and global-level supply chains.
"Europe to record second-highest growth rate in smart port market from 2025 to 2030"
The European region is expected to exhibit the second-highest CAGR from 2025 to 2030. Some of the world's most advanced and high-throughput ports are located in Europe. Notable examples include the ports of Rotterdam (Netherlands), Antwerp-Bruges (Belgium), and Hamburg (Germany). These ports have made significant strides in adopting digital and automated technologies. They are leading the way in smart port infrastructure, utilizing digital twins, AI-based logistics, and asset tracking through the Internet of Things (IoT). As a result, these ports have become more efficient, environmentally friendly, and effective in handling cargo volume.
Breakdown of Primaries:
By Company Type: Tier 1- 30%, Tier 2- 55%, and Tier 3 - 15%
By Designation: C-Level Executives- 30%, Directors - 20%, and Others- 50%
By Region: Asia Pacific - 55%, North America - 20%, Europe - 8%, Middle East & Africa - 13%, and South America - 4%
Note: Other designations include sales managers, engineers, and regional managers.
The tiers of the companies are defined based on their total revenue as of 2024: Tier 1: >USD 1 billion, Tier 2: USD 500 million-1 billion, and Tier 3: <USD 500 million
The smart port market is dominated by major, globally established players. The leading players are ABB (Switzerland), Accenture (Ireland), IBM (US), Siemens (Germany), General Electric (US), and Trelleborg (Sweden).
Study Coverage:
The report defines, describes, and forecasts the smart port market, by element (terminal automation & cargo handling, port community systems, port traffic management systems, smart port infrastructure, smart port safety & security), throughput capacity (high throughput ports, medium throughput ports, low throughput ports), technology (IoT, blockchain, process automation, AI), port type (seaports and inland ports), and region (Asia Pacific, North America, Europe, Middle East & Africa, and South America). It also offers a detailed qualitative and quantitative analysis of the market.
The report comprehensively reviews the major market drivers, restraints, opportunities, and challenges. It also covers various important aspects of the market, which include the analysis of the competitive landscape, market dynamics, market estimates in terms of value, and future trends in the smart port market.
Key Benefits of Buying the Report
- Key drivers (increasing international maritime trade activities), restraints (risk associated with data breach and data protection of seaport clients), opportunities (government initiative to develop smart port infrastructure), and challenges (complexities of technologies and interaction of numerous systems) influence the growth of the smart port market.
- Market Development: In June 2025, IBM launched a software program that would help in bringing AI security teams and AI governance teams together in an enterprise. A unique solution is the combination of Watson X.governance and the Guardium AI Security, which presents a comprehensive insight into the risk landscape of an organization. It improves the security and accountability of the AI systems by taking future considerations onboard.
- Product Innovation/Development: There was significant product innovation in the smart port market, but the innovation of IoT-enabled diagnostics and predictive maintenance capabilities of the most advanced systems is notable. These trends are geared toward improving reliability, minimizing downtime, and increasing efficiency standards among end users.
- Market Diversification: In July 2025, Siemens acquired the industrial drive technology business of ebm-papst, which is now marketed under the name Mechatronic Systems. The portfolio encompasses built-in smart drive systems such as autonomous transport and extra-low voltage protection.
- Competitive Assessment: The report includes an in-depth assessment of market shares, growth strategies, and service offerings of leading market players, such as ABB (Switzerland), Siemens (Germany), Schneider Electric (France), GE Vernova (US), and Mitsubishi Corporation (Japan).
TABLE OF CONTENTS
1 INTRODUCTION
- 1.1 STUDY OBJECTIVES
- 1.2 MARKET DEFINITION
- 1.3 STUDY SCOPE
- 1.3.1 MARKETS COVERED AND REGIONAL SCOPE
- 1.3.2 INCLUSIONS AND EXCLUSIONS
- 1.3.3 YEARS CONSIDERED
- 1.4 UNIT CONSIDERED
- 1.5 CURRENCY CONSIDERED
- 1.6 LIMITATIONS
- 1.7 STAKEHOLDERS
- 1.8 SUMMARY OF CHANGES
2 RESEARCH METHODOLOGY
- 2.1 RESEARCH DATA
- 2.1.1 SECONDARY DATA
- 2.1.1.1 List of key secondary sources
- 2.1.1.2 Key data from secondary sources
- 2.1.2 PRIMARY DATA
- 2.1.2.1 List of key primary interview participants
- 2.1.2.2 Insights from experts
- 2.1.2.3 Key data from primary sources
- 2.1.2.4 Breakdown of primaries
- 2.1.1 SECONDARY DATA
- 2.2 MARKET SIZE ESTIMATION
- 2.2.1 BOTTOM-UP APPROACH
- 2.2.1.1 Regional analysis
- 2.2.1.2 Country-wise analysis
- 2.2.1.3 Demand-side assumptions
- 2.2.1.4 Demand-side calculations
- 2.2.2 TOP-DOWN APPROACH
- 2.2.2.1 Supply-side assumptions
- 2.2.2.2 Supply-side calculations
- 2.2.1 BOTTOM-UP APPROACH
- 2.3 DATA TRIANGULATION
- 2.4 FORECAST
- 2.5 RESEARCH ASSUMPTIONS
- 2.6 RESEARCH LIMITATIONS
- 2.7 RISK ASSESSMENT
3 EXECUTIVE SUMMARY
4 PREMIUM INSIGHTS
- 4.1 ATTRACTIVE OPPORTUNITIES FOR PLAYERS IN SMART PORT MARKET
- 4.2 SMART PORT MARKET, BY REGION
- 4.3 SMART PORT MARKET IN NORTH AMERICA, BY THROUGHPUT CAPACITY AND COUNTRY
- 4.4 SMART PORT MARKET, BY ELEMENT
- 4.5 SMART PORT MARKET, BY TECHNOLOGY
- 4.6 SMART PORT MARKET, BY THROUGHPUT CAPACITY
- 4.7 SMART PORT MARKET, BY PORT TYPE
5 MARKET OVERVIEW
- 5.1 INTRODUCTION
- 5.2 MARKET DYNAMICS
- 5.2.1 DRIVERS
- 5.2.1.1 Rising maritime trade volumes
- 5.2.1.2 Growing focus of maritime industry on reducing emissions
- 5.2.1.3 Increasing use of real-time geospatial data to improve port operations
- 5.2.1.4 Surging adoption of Industry 4.0 to improve port efficiency
- 5.2.2 RESTRAINTS
- 5.2.2.1 Data breach issues reported by seaport clients
- 5.2.3 OPPORTUNITIES
- 5.2.3.1 Government initiatives to develop smart port infrastructure
- 5.2.3.2 Renovation of existing ports and development of new ports
- 5.2.4 CHALLENGES
- 5.2.4.1 Technological complexity and system interoperability issues in port operations
- 5.2.4.2 Requirement for high initial investment for port development
- 5.2.1 DRIVERS
- 5.3 TRENDS/DISRUPTIONS IMPACTING CUSTOMER BUSINESS
- 5.4 ECOSYSTEM ANALYSIS
- 5.5 VALUE CHAIN ANALYSIS
- 5.6 TECHNOLOGY ANALYSIS
- 5.6.1 KEY TECHNOLOGIES
- 5.6.1.1 IoT
- 5.6.2 ADJACENT TECHNOLOGIES
- 5.6.2.1 Artificial intelligence
- 5.6.1 KEY TECHNOLOGIES
- 5.7 PRICING ANALYSIS
- 5.7.1 AVERAGE SELLING PRICE, BY COMPONENT, 2024
- 5.8 KEY CONFERENCES AND EVENTS, 2025-2026
- 5.9 REGULATORY LANDSCAPE
- 5.9.1 REGULATORY BODIES, GOVERNMENT AGENCIES, AND OTHER ORGANIZATIONS
- 5.9.2 CODES AND REGULATIONS RELATED TO SMART PORT MARKET
- 5.10 PATENT ANALYSIS, 2014-2024
- 5.11 PORTER'S FIVE FORCES ANALYSIS
- 5.11.1 THREAT OF SUBSTITUTES
- 5.11.2 BARGAINING POWER OF SUPPLIERS
- 5.11.3 BARGAINING POWER OF BUYERS
- 5.11.4 THREAT OF NEW ENTRANTS
- 5.11.5 INTENSITY OF COMPETITIVE RIVALRY
- 5.12 KEY STAKEHOLDERS AND BUYING CRITERIA
- 5.12.1 KEY STAKEHOLDERS IN BUYING PROCESS
- 5.12.2 BUYING CRITERIA
- 5.13 CASE STUDY ANALYSIS
- 5.13.1 CASE STUDY 1: CAVOTEC'S SHORE POWER SOLUTIONS REDUCE EMISSIONS AT SHIPPING PORTS
- 5.13.2 CASE STUDY 2: WIPRO AND ORACLE'S CLOUD SOLUTIONS ENABLE DIGITAL TRANSFORMATION OF GLOBAL PORT OPERATORS
- 5.13.3 CASE STUDY 3: IMPLEMENTATION OF CYBER-PHYSICAL SYSTEMS FOR CONTAINER TERMINAL MANAGEMENT
- 5.14 IMPACT OF GENERATIVE AI/AI IN SMART PORT MARKET
- 5.14.1 ADOPTION OF GENERATIVE AI/AI IN SMART PORT MARKET
- 5.14.2 IMPACT OF GENERATIVE AI/AI ON PORT TYPE, BY REGION
- 5.14.3 IMPACT OF AI ON SMART PORT MARKET, BY REGION
- 5.15 IMPACT OF 2025 US TARIFF - OVERVIEW
- 5.15.1 INTRODUCTION
- 5.15.2 KEY TARIFF RATES
- 5.15.3 IMPACT ON COUNTRY/REGION
- 5.15.3.1 North America
- 5.15.3.2 Europe
- 5.15.3.3 Asia Pacific
- 5.15.3.4 South America
- 5.15.3.5 Middle East & Africa
6 SMART PORT MARKET, BY ELEMENT
- 6.1 INTRODUCTION
- 6.2 SMART PORT INFRASTRUCTURE
- 6.2.1 INCREASING GLOBAL TRADE VOLUMES TO CREATE GROWTH OPPORTUNITIES
- 6.3 PORT TRAFFIC MANAGEMENT SYSTEMS
- 6.3.1 RISING FOCUS ON REDUCING WAITING TIMES AT PORT GATES TO FUEL DEMAND
- 6.4 TERMINAL AUTOMATION & CARGO HANDLING
- 6.4.1 EMPHASIS ON EMISSIONS REDUCTION AND LABOR OPTIMIZATION IN PORTS TO BOOST ADOPTION
- 6.5 SMART PORT SAFETY & SECURITY SYSTEMS
- 6.5.1 ESCALATING CYBER-PHYSICAL RISKS TO SPUR DEMAND
- 6.6 PORT COMMUNITY SYSTEMS
- 6.6.1 PROFICIENCY IN LINKING TRANSPORT AND LOGISTICS CHAINS TO SPIKE DEMAND
7 SMART PORT MARKET, BY PORT TYPE
- 7.1 INTRODUCTION
- 7.2 SEAPORTS
- 7.2.1 URGENT NEED TO IMPROVE BERTH ALLOCATION, CARGO HANDLING, AND EQUIPMENT MAINTENANCE TO STIMULATE DEMAND
- 7.3 INLAND PORTS
- 7.3.1 INCREASING GOVERNMENT INVESTMENTS IN MULTIMODAL PORT INFRASTRUCTURE TO DRIVE MARKET
8 SMART PORT MARKET, BY TECHNOLOGY
- 8.1 INTRODUCTION
- 8.2 PROCESS AUTOMATION
- 8.2.1 INCREASING FOCUS ON REDUCING LABOR COSTS AND IMPROVING SAFETY TO ACCELERATE DEMAND
- 8.3 IOT
- 8.3.1 SIGNIFICANT NEED FOR REAL-TIME DATA TO MANAGE RISING CARGO VOLUMES TO FACILITATE MARKET GROWTH
- 8.4 AI
- 8.4.1 GROWING INCLINATION TOWARD REAL-TIME DECISION-MAKING AND PREDICTIVE MAINTENANCE ADOPTION TO PROPEL MARKET
- 8.5 BLOCKCHAIN
- 8.5.1 ESCALATING DEMAND FOR SECURE TRANSACTIONS AND TRANSPARENCY IN COMPLEX PORT LOGISTICS NETWORKS TO DRIVE MARKET
9 SMART PORT MARKET, BY THROUGHPUT CAPACITY
- 9.1 INTRODUCTION
- 9.2 HIGH THROUGHPUT PORTS
- 9.2.1 NEED TO HANDLE ULTRA-LARGE VESSELS TO DRIVE MARKET
- 9.3 MEDIUM THROUGHPUT PORTS
- 9.3.1 ADOPTION OF SCALABLE DIGITAL TECHNOLOGIES TO IMPROVE TURNAROUND TIME TO FUEL MARKET GROWTH
- 9.4 LOW THROUGHPUT PORTS
- 9.4.1 RISING NEED FOR PROCESS AUTOMATION TO FOSTER MARKET GROWTH
10 SMART PORT MARKET, BY REGION
- 10.1 INTRODUCTION
- 10.2 ASIA PACIFIC
- 10.2.1 CHINA
- 10.2.1.1 Digitization and expansion of ports to fuel market growth
- 10.2.2 SINGAPORE
- 10.2.2.1 Significant focus on increasing port capacities using digital technologies to drive market
- 10.2.3 SOUTH KOREA
- 10.2.3.1 Government-led investments in seaport infrastructure development to fuel market growth
- 10.2.4 JAPAN
- 10.2.4.1 Surging adoption of AI technology in ports to enhance operations to foster market growth
- 10.2.5 HONG KONG
- 10.2.5.1 Growing maritime activities to boost demand
- 10.2.6 REST OF ASIA PACIFIC
- 10.2.1 CHINA
- 10.3 EUROPE
- 10.3.1 GERMANY
- 10.3.1.1 Rising adoption of high-tech and modern shipbuilding technologies to boost demand
- 10.3.2 ITALY
- 10.3.2.1 Surging deployment of digital technologies to improve port capacities to propel market
- 10.3.3 UK
- 10.3.3.1 Elevating use of AI-enabled logistics platforms, autonomous vehicles, and IoT devices to enhance cargo handling and terminal efficiency to drive market
- 10.3.4 NETHERLANDS
- 10.3.4.1 Escalating use of digital twin technology for effective cargo handling to support market growth
- 10.3.5 REST OF EUROPE
- 10.3.1 GERMANY
- 10.4 NORTH AMERICA
- 10.4.1 US
- 10.4.1.1 Port modernization initiatives and smart freight corridors to accelerate market growth
- 10.4.2 CANADA
- 10.4.2.1 Greater emphasis on building smart ports to reduce emissions and expand trade to facilitate adoption
- 10.4.3 MEXICO
- 10.4.3.1 Increasing public and private investment in scaling up maritime infrastructure to create growth opportunities
- 10.4.1 US
- 10.5 MIDDLE EAST & AFRICA
- 10.5.1 UAE
- 10.5.1.1 Inclination toward reducing port congestion and improving trade throughput to drive market
- 10.5.2 SAUDI ARABIA
- 10.5.2.1 Deployment of 5G and cloud computing technologies to increase non-oil exports to create lucrative opportunities
- 10.5.3 KUWAIT
- 10.5.3.1 Escalating adoption of next-generation logistics solutions to fuel market growth
- 10.5.4 SOUTH AFRICA
- 10.5.4.1 Rising use of AI-driven tools to minimize disruptions in port operations to facilitate market growth
- 10.5.5 REST OF MIDDLE EAST & AFRICA
- 10.5.1 UAE
- 10.6 SOUTH AMERICA
- 10.6.1 BRAZIL
- 10.6.1.1 Growing focus on improving port sustainability and operational efficiency to drive market
- 10.6.2 CHILE
- 10.6.2.1 Strategic investments and digital upgrades to contribute to market growth
- 10.6.3 REST OF SOUTH AMERICA
- 10.6.1 BRAZIL
11 COMPETITIVE LANDSCAPE
- 11.1 INTRODUCTION
- 11.2 KEY PLAYER STRATEGIES/RIGHT TO WIN, 2021-2025
- 11.3 MARKET SHARE ANALYSIS, 2024
- 11.4 COMPANY EVALUATION MATRIX: KEY PLAYERS, 2024
- 11.4.1 STARS
- 11.4.2 EMERGING LEADERS
- 11.4.3 PERVASIVE PLAYERS
- 11.4.4 PARTICIPANTS
- 11.4.5 COMPANY FOOTPRINT: KEY PLAYERS, 2024
- 11.4.5.1 Company footprint
- 11.4.5.2 Region footprint
- 11.4.5.3 Element footprint
- 11.4.5.4 Throughput capacity footprint
- 11.4.5.5 Port type footprint
- 11.5 COMPANY EVALUATION MATRIX: STARTUPS/SMES, 2024
- 11.5.1 PROGRESSIVE COMPANIES
- 11.5.2 RESPONSIVE COMPANIES
- 11.5.3 DYNAMIC COMPANIES
- 11.5.4 STARTING BLOCKS
- 11.5.5 COMPETITIVE BENCHMARKING: STARTUPS/SMES, 2024
- 11.5.5.1 Detailed list of key startups/SMEs
- 11.5.5.2 Competitive benchmarking of key startups/SMEs
- 11.6 COMPETITIVE SCENARIO
- 11.6.1 PRODUCT LAUNCHES
- 11.6.2 DEALS
- 11.6.3 OTHER DEVELOPMENTS
12 COMPANY PROFILES
- 12.1 KEY PLAYERS
- 12.1.1 IBM
- 12.1.1.1 Business overview
- 12.1.1.2 Products/Solutions/Services offered
- 12.1.1.3 Recent developments
- 12.1.1.3.1 Product launches
- 12.1.1.3.2 Deals
- 12.1.1.4 MnM view
- 12.1.1.4.1 Key strengths/Right to win
- 12.1.1.4.2 Strategic choices
- 12.1.1.4.3 Weaknesses and competitive threats
- 12.1.2 ACCENTURE
- 12.1.2.1 Business overview
- 12.1.2.2 Products/Solutions/Services offered
- 12.1.2.3 Recent developments
- 12.1.2.3.1 Product launches
- 12.1.2.3.2 Deals
- 12.1.2.4 MnM view
- 12.1.2.4.1 Key strengths/Right to win
- 12.1.2.4.2 Strategic choices
- 12.1.2.4.3 Weaknesses and competitive threats
- 12.1.3 ABB
- 12.1.3.1 Business overview
- 12.1.3.2 Products/Solutions/Services offered
- 12.1.3.3 Recent developments
- 12.1.3.3.1 Developments
- 12.1.3.4 MnM view
- 12.1.3.4.1 Key strengths/Right to win
- 12.1.3.4.2 Strategic choices
- 12.1.3.4.3 Weaknesses and competitive threats
- 12.1.4 SIEMENS
- 12.1.4.1 Business overview
- 12.1.4.2 Products/Solutions/Services offered
- 12.1.4.3 Recent developments
- 12.1.4.3.1 Deals
- 12.1.4.3.2 Other developments
- 12.1.4.4 MnM view
- 12.1.4.4.1 Key strengths/Right to win
- 12.1.4.4.2 Strategic choices
- 12.1.4.4.3 Weaknesses and competitive threats
- 12.1.5 GE VERNOVA
- 12.1.5.1 Business overview
- 12.1.5.2 Products/Solutions/Services offered
- 12.1.5.3 Recent developments
- 12.1.5.3.1 Developments
- 12.1.5.4 MnM view
- 12.1.5.4.1 Key strengths/Right to win
- 12.1.5.4.2 Strategic choices
- 12.1.5.4.3 Weaknesses and competitive threats
- 12.1.6 TRELLEBORG AB
- 12.1.6.1 Business overview
- 12.1.6.2 Products/Solutions/Services offered
- 12.1.6.3 Recent developments
- 12.1.6.3.1 Deals
- 12.1.7 ROYAL HASKONING
- 12.1.7.1 Business overview
- 12.1.7.2 Products/Solutions/Services offered
- 12.1.7.3 Recent developments
- 12.1.7.3.1 Deals
- 12.1.7.3.2 Other developments
- 12.1.8 KALMAR CORPORATION
- 12.1.8.1 Business overview
- 12.1.8.2 Products/Solutions/Services offered
- 12.1.8.3 Recent developments
- 12.1.8.3.1 Product launches
- 12.1.8.3.2 Other developments
- 12.1.9 WIPRO
- 12.1.9.1 Business overview
- 12.1.9.2 Products/Solutions/Services offered
- 12.1.10 RAMBOLL GROUP
- 12.1.10.1 Business overview
- 12.1.10.2 Products/Solutions/Services offered
- 12.1.10.3 Recent developments
- 12.1.10.3.1 Developments
- 12.1.11 MICROSOFT
- 12.1.11.1 Business overview
- 12.1.11.2 Products/Solutions/Services offered
- 12.1.12 TCS
- 12.1.12.1 Business overview
- 12.1.12.2 Products/Solutions/Services offered
- 12.1.13 KALERIS
- 12.1.13.1 Business overview
- 12.1.13.2 Products/Solutions/Services offered
- 12.1.13.3 Recent developments
- 12.1.13.3.1 Product launches
- 12.1.13.3.2 Deals
- 12.1.14 IKUSI VELATIA
- 12.1.14.1 Business overview
- 12.1.14.2 Products/Solutions/Services offered
- 12.1.15 ABU DHABI PORTS
- 12.1.15.1 Business overview
- 12.1.15.2 Products/Solutions/Services offered
- 12.1.1 IBM
- 12.2 OTHER PLAYERS
- 12.2.1 SCIENTIFIC ENTERPRISES
- 12.2.2 NAUTIX
- 12.2.3 IOCURRENTS
- 12.2.4 PORT SOLUTIONS
- 12.2.5 PORT OF ROTTERDAM
- 12.2.6 APM TERMINALS
- 12.2.7 HUTCHISON PORTS
- 12.2.8 BLOC PORT
13 APPENDIX
- 13.1 INSIGHTS FROM INDUSTRY EXPERTS
- 13.2 DISCUSSION GUIDE
- 13.3 KNOWLEDGESTORE: MARKETSANDMARKETS' SUBSCRIPTION PORTAL
- 13.4 CUSTOMIZATION OPTIONS
- 13.5 RELATED REPORTS
- 13.6 AUTHOR DETAILS
