|
시장보고서
상품코드
1829987
전기 선박 시장 : 판매 시점별, 기술별, 선박 유형별, 솔루션별, 지역별 - 예측(-2032년)Electric Ship Market by Point of Sale (Newbuild & Line Fit vs. Retrofit), Technology (Fully Electric vs. Hybrid), Ship Type (Commercial, Defense), Solution (Storage, Conversion, Generation, Distribution, Drive) and Region - Global Forecast to 2032 |
||||||
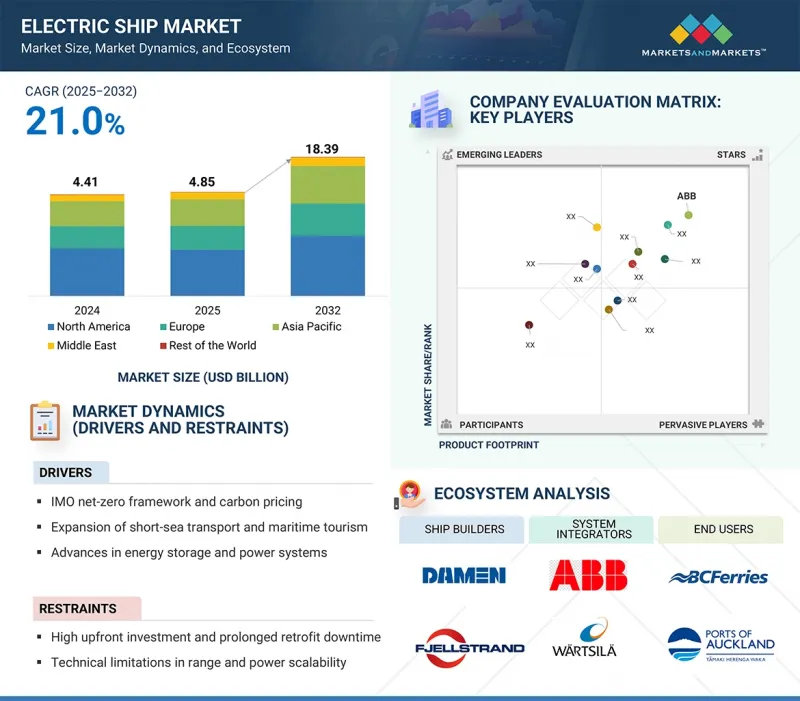
세계의 전기 선박 시장 규모는 2025년 48억 5,000만 달러에서 2032년까지 183억 9,000만 달러에 이를 것으로 예측되며, CAGR 21.0%의 성장이 전망됩니다.
시장은 규제 강화, 경제적 요인, 더 빠른 발전을 촉진하는 기술 발전으로 인해 성장하고 있습니다. 국제기구와 지역 기관은 배기가스 배출 규제를 강화하고 있으며, 선주에게 기존 추진 시스템을 저배출 대체품으로 교체할 것을 촉구하고 있습니다.
| 조사 범위 | |
|---|---|
| 조사 대상 연도 | 2021-2032년 |
| 기준 연도 | 2024년 |
| 예측 기간 | 2025-2032년 |
| 단위 | 10억 달러 |
| 부문 | 판매 시점, 기술, 선박 유형, 솔루션, 지역 |
| 대상 지역 | 북미, 유럽, 아시아태평양, 기타 지역 |
특히 페리와 화물선의 경우, 항로의 예측 가능성과 빈번한 입항이 배터리와 하이브리드 시스템에 의해 지원되기 때문에 전기화가 가장 현실적인 선택이 되고 있습니다. 이러한 규제 환경은 컴플라이언스 압력을 증가시키고 조선소, 항만 운영자, 기술 제공업체 간의 투자 우선순위를 변화시키고 있습니다.
"페리가 예측 기간 동안 가장 큰 여객선 부문이 될 것으로 예측됩니다. "
페리는 독특한 운항 스타일, 규제 요건, 비용 효율성으로 인해 전기 선박 시장의 최전선에 서게 될 것으로 예측됩니다. 페리는 보통 제한된 항속거리로 운항하기 때문에 특히 항구를 방문하는 빈도에 따라 단거리에서 정기적인 충전이 가능합니다. 이 설정은 현재의 배터리 및 하이브리드 기술과 잘 일치합니다. 페리는 운항이 예측 가능하기 때문에 스케줄을 방해하지 않고 전기화를 쉽게 시행할 수 있어 전기 선박을 대규모로 도입할 수 있는 현실적인 대안이 되고 있습니다. 또한, 페리는 배출가스 규제가 더 엄격한 도시 지역이나 연안 항로에 취항하는 경우가 많기 때문에 운항 업체들은 저공해 대안을 찾고 있습니다.
"유인 선박은 예측 기간 동안 가장 큰 자율성 부문이 될 것으로 예측됩니다. "
세계적으로 운항하는 대부분의 선박은 유인선박과 친구이기 때문에 유인선이 전기 선박 시장을 독점할 것으로 예측됩니다. 여객선, 단거리 화물선, 근해 서비스 선박, 해군 플랫폼의 운영, 유지 보수, 국제 안전 기준 준수는 인간 노동자에게 의존하고 있습니다. 따라서 전기화 노력은 주로 이러한 유인 선박에 초점을 맞추고 있으며, 기존 모델을 변경하지 않고도 추진 시스템 및 에너지 시스템을 업그레이드할 수 있도록 하고 있습니다. 유인선은 보통 정해진 항로를 따라 운항하기 때문에 충전설비와 하이브리드 전기시스템의 도입이 용이해져 운항 효율이 높아집니다. 한편, 하이브리드 추진력은 선주들이 항속거리를 유지하면서 연료 소비와 배기가스 배출을 줄여 더 엄격한 배기가스 규제에 쉽게 대응할 수 있도록 돕습니다.
"아시아태평양이 예측 기간 동안 전기 선박의 두 번째 시장이 될 것으로 예측됩니다. "
아시아태평양은 세계 조선 산업에서의 강력한 입지, 규제 강화, 해양 탈탄소화 노력에 대한 막대한 투자로 인해 전기 선박의 두 번째로 큰 시장이 될 것으로 예측됩니다. 중국, 한국, 일본 등 주요 조선국들은 상선 및 방산선단을 모두 전기화하는 전략을 적극적으로 추진하고 있습니다. 특히 중국은 항만 충전 인프라를 강화하는 구상과 함께 배터리 구동 페리 및 하이브리드 페리 개발을 포함한 국가 지원 프로젝트를 진행하고 있습니다. 한편, 일본과 한국은 선진적인 제조 능력과 강력한 해양 연구개발을 활용하여 완전 전기 선박 및 대형 선박용 하이브리드 솔루션의 시범 프로그램을 모색하고 있습니다.
세계의 전기 선박 시장에 대해 조사 분석했으며, 주요 촉진요인과 억제요인, 경쟁 구도, 향후 동향 등의 정보를 전해드립니다.
목차
제1장 서론
제2장 조사 방법
제3장 주요 요약
제4장 중요 인사이트
- 전기 선박 시장 기업에 있어서 매력적인 기회
- 전기 선박 시장 : 추진력별
- 전기 선박 시장 : 하이브리드 추진 방식별
- 전기 선박 시장 : 상업선별
- 전기 선박 시장 : 여객선별
제5장 시장 개요
- 서론
- 시장 역학
- 성장 촉진요인
- 성장 억제요인
- 기회
- 과제
- 고객의 비즈니스에 영향을 미치는 동향과 혼란
- 생태계 분석
- 조선업자
- 시스템 통합사업자
- 최종사용자
- 사례 연구 분석
- 주요 이해관계자와 구입 기준
- 주요 컨퍼런스 및 이벤트
- 규제 상황
- 기술 분석
- 주요 기술
- 보완 기술
- 인접 기술
- 신규 건조 선박 및 개보수 선박
- 무역 데이터
- 수입 시나리오(HS코드 8901)
- 수출 시나리오(HS코드 8901)
- 특허 분석
- 거시경제 전망
- 북미
- 유럽
- 아시아태평양
- 중동
- 기타 지역
- 가격 결정 분석
- 주요 기업이 제공하는 전기 선박 평균 판매 가격 동향
- 평균 판매 가격 동향 : 지역별
- 투자 및 자금조달 시나리오
- 비즈니스 모델
- 기술 로드맵
- AI의 영향
- 서론
- 주요 국가의 해사 부문 AI 채택
- 해사 이용 사례에 대한 AI의 영향
- 전기 선박 시장에 대한 AI의 영향
- 미국 2025년 관세
- 서론
- 주요 관세율
- 가격 영향 분석
- 국가/지역에 대한 영향
- 최종 이용 산업에 대한 영향
제6장 전기 선박 시장 : 자율성별
- 서론
- 유인
- 원격 조작
- 자율
제7장 전기 선박 시장 : 판매 시점별
- 서론
- 완전 전기
- 하이브리드
제8장 전기 선박 시장 : 전력 용량별
- 서론
- 75kW 미만
- 75-150kW
- 151-745kW
- 746-7,560kW
- 7,560kW 이상
제9장 전기 선박 시장 : 항속거리별
- 서론
- 50 km미만
- 50-100km
- 101-1,000km
- 1,000km 이상
제10장 전기 선박 시장 : 톤수별
- 서론
- 500DWT 미만
- 500-5,000DWT
- 5,001-15,000DWT
- 15,000DWT 이상
제11장 전기 선박 시장 : 선박 유형별
- 서론
- 상업
- 방위
제12장 전기 선박 시장 : 지역별
- 서론
- 북미
- PESTLE 분석
- 미국
- 캐나다
- 유럽
- PESTLE 분석
- 노르웨이
- 스웨덴
- 네덜란드
- 핀란드
- 덴마크
- 영국
- 기타 유럽
- 아시아태평양
- PESTLE 분석
- 중국
- 일본
- 호주
- 한국
- 인도
- 기타 아시아태평양
- 중동
- PESTLE 분석
- GCC
- 이스라엘
- 튀르키예
- 기타 지역
- PESTLE 분석
- 아프리카
- 라틴아메리카
제13장 경쟁 구도
- 서론
- 주요 시장 진출기업의 전략/강점(2022년-2025년)
- 시장 점유율 분석(2024년)
- 매출 분석(2021년-2024년)
- 브랜드 및 제품 비교
- 기업 평가와 재무 지표
- 기업 평가 매트릭스 : 주요 기업(2024년)
- 기업 평가 매트릭스 : 스타트업/중소기업(2025년)
- 경쟁 시나리오
제14장 기업 개요
- 주요 기업
- ABB
- WARTSILA
- SCHOTTEL GROUP
- CORVUS ENERGY
- GE VERNOVA
- KONGSBERG
- VARD AS
- SIEMENS
- LECLANCHE SA
- BAE SYSTEMS
- SAFT
- NORWEGIAN ELECTRIC SYSTEMS
- EVERLLENCE
- ECHANDIA AB
- ANGLO BELGIAN CORPORATION NV
- DANFOSS
- FJELLSTRAND AS
- SOBY SHIPYARD
- MITSUBISHI SHIPBUILDING CO., LTD.
- DAMEN SHIPYARDS GROUP
- BALTIC WORKBOATS AS
- COCHIN SHIPYARD LIMITED
- 기타 기업
- ECO MARINE POWER CO., LTD.
- EST FLOATTECH
- SHIFT
- INCAT CROWTHER
- INGETEAM, S.A.
- VOITH TURBO MARINE
- YARA
제15장 부록
LSH 25.10.15The electric ship market is expected to reach USD 18.39 billion by 2032, from USD 4.85 billion in 2025, with a CAGR of 21.0%. The market is growing due to regulatory push, economic factors, and technological advances that facilitate faster progress. International and regional authorities are implementing stricter emissions regulations, prompting shipowners to replace traditional propulsion systems with low-emission alternatives.
| Scope of the Report | |
|---|---|
| Years Considered for the Study | 2021-2032 |
| Base Year | 2024 |
| Forecast Period | 2025-2032 |
| Units Considered | Value (USD Billion) |
| Segments | By Point of Sale, Technology, Ship Type, Solution and Region |
| Regions covered | North America, Europe, APAC, RoW |
Electrification has become the most practical option, especially for ferries and cargo ships, where route predictability and frequent port access are supported by battery and hybrid systems. This regulatory environment increases compliance pressure and shifts investment priorities among shipyards, port operators, and technology providers.

"Ferries are expected to be the largest passenger ship segment during the forecast period."
Ferries are expected to be at the forefront of the electric ship market due to their unique operating style, regulatory requirements, and cost-effectiveness. They typically operate within a limited range, allowing for regular charging over short distances, especially depending on how often they visit ports. This setup aligns well with current battery and hybrid technologies. The predictability of their operations makes it easier to implement electrification without disrupting schedules, making ferries a practical option for large-scale adoption of electric vessels. Furthermore, ferries often serve urban and coastal routes where emissions regulations are more stringent, driving operators to seek low-emission alternatives.
"Manned is expected to be the largest autonomy segment during the forecast period."
Manned ships are expected to dominate the electric ship market, as most vessels in global operations are crewed. The operation, maintenance, and adherence to international safety standards for passenger ferries, short-haul cargo ships, offshore service vessels, and naval platforms rely on human labor. Consequently, electrification efforts are primarily focused on these manned ships, enabling upgrades to propulsion and energy systems without the need to modify existing models. This enhances operational efficiency since manned vessels typically follow fixed routes, facilitating the implementation of charging facilities and hybrid-electric systems. Meanwhile, hybrid propulsion helps shipowners reduce fuel consumption and emissions while maintaining operational range, making it easier to comply with stricter emissions regulations.
"Asia Pacific is expected to be the second-largest market for electric ships during the forecast period."
The Asia Pacific region is expected to become the second-largest market for electric ships, driven by its strong position in the global shipbuilding industry, increasing regulatory alignment, and significant investments in maritime decarbonization efforts. Key shipbuilding countries such as China, South Korea, and Japan are actively pursuing strategies to electrify both their commercial and defense fleets. China, in particular, has launched state-supported projects that include the development of battery-powered and hybrid ferries, alongside initiatives to enhance port charging infrastructure. Meanwhile, Japan and South Korea are exploring pilot programs for fully electric vessels and hybrid solutions for larger ships, leveraging their advanced manufacturing capabilities and robust maritime research and development.
Breakdown of the profile of primary participants in the electric ship market:
- By Company Type: Tier 1 - 35%, Tier 2 - 45%, and Tier 3 - 20%
- By Designation: C-level - 35%, Director Level - 25%, and Others - 40%
- By Region: North America - 25%, Europe - 15%, Asia Pacific - 45%, Middle East - 10%, and Rest of the World - 5%
Major companies profiled in the report include ABB (Switzerland), Wartisilia (Finland), Schottel Group (Germany), Corvus Energy (Norway), and Siemens (Germany), among others.
Research Coverage:
This market study covers the electric ship market across various segments and subsegments. It aims to estimate the market's size and growth potential in different regions. The study also provides an in-depth competitive analysis of the key market players, including their company profiles, insights into their products and business offerings, recent developments, and the key strategies they have adopted.
Reasons to buy this report:
The report will assist market leaders and new entrants with estimates of the revenue figures for the overall Electric Ship Market. It will help stakeholders understand the competitive landscape and gain insights to better position their businesses and develop effective go-to-market strategies. Additionally, the report provides insights into market trends and key drivers, restraints, challenges, and opportunities.
The report covers the following key pointers:
- In-depth Analysis of Key Drivers (IMO net-zero framework & carbon pricing, expansion of short-sea transport and maritime tourism, advances in energy storage and power systems, and decarbonization and sustainability goals), Restraints (high upfront investment and prolonged retrofit downtime, technical limitations in range and power scalability, uncertain regulatory standards and compliance burden), Opportunities (potential of high-powered batteries, scale battery and fuel cell technologies for long-range shipping, and leverage government incentives for clean shipbuilding programs), and Challenges (supply chain constraints for critical materials, high capital costs and financing barriers, and charging and port infrastructure readiness)
- Market Penetration: Comprehensive information on electric ships offered by the top players in the market
- Product Development/Innovation: Detailed insights on upcoming technologies, R&D activities, and new product launches in the electric ship market
- Market Development: Comprehensive information about lucrative markets; the report analyzes the electric ship market across varied regions.
- Market Diversification: Exhaustive information about new products, untapped geographies, recent developments, and investments in the electric ship market
- Competitive Assessment: In-depth assessment of market shares, growth strategies, products, and manufacturing capabilities of leading players in the electric ship market
TABLE OF CONTENTS
1 INTRODUCTION
- 1.1 STUDY OBJECTIVES
- 1.2 MARKET DEFINITION
- 1.3 STUDY SCOPE
- 1.3.1 MARKETS COVERED AND REGIONAL SCOPE
- 1.3.2 INCLUSIONS AND EXCLUSIONS
- 1.3.3 YEARS CONSIDERED
- 1.4 CURRENCY CONSIDERED
- 1.5 STAKEHOLDERS
- 1.6 SUMMARY OF CHANGES
2 RESEARCH METHODOLOGY
- 2.1 RESEARCH DATA
- 2.1.1 SECONDARY DATA
- 2.1.1.1 Key data from secondary sources
- 2.1.2 PRIMARY DATA
- 2.1.2.1 Primary participants
- 2.1.2.2 Key data from primary sources
- 2.1.2.3 Breakdown of primary interviews
- 2.1.1 SECONDARY DATA
- 2.2 FACTOR ANALYSIS
- 2.2.1 DEMAND-SIDE INDICATORS
- 2.2.1.1 Surge in maritime tourism
- 2.2.2 SUPPLY-SIDE INDICATORS
- 2.2.2.1 Advanced batteries for electric ships
- 2.2.1 DEMAND-SIDE INDICATORS
- 2.3 MARKET SIZE ESTIMATION
- 2.3.1 BOTTOM-UP APPROACH
- 2.3.1.1 Regional split
- 2.3.1.2 Market size estimation methdology (demand-side analysis)
- 2.3.2 TOP-DOWN APPROACH
- 2.3.1 BOTTOM-UP APPROACH
- 2.4 DATA TRIANGULATION
- 2.5 RESEARCH ASSUMPTIONS
- 2.6 RESEARCH LIMITATIONS
- 2.7 RISK ASSESSMENT
3 EXECUTIVE SUMMARY
4 PREMIUM INSIGHTS
- 4.1 ATTRACTIVE OPPORTUNITIES FOR PLAYERS IN ELECTRIC SHIP MARKET
- 4.2 ELECTRIC SHIP MARKET, BY PROPULSION
- 4.3 ELECTRIC SHIP MARKET, BY HYBRID PROPULSION
- 4.4 ELECTRIC SHIP MARKET, BY COMMERCIAL VESSEL
- 4.5 ELECTRIC SHIP MARKET, BY PASSENGER VESSEL
5 MARKET OVERVIEW
- 5.1 INTRODUCTION
- 5.2 MARKET DYNAMICS
- 5.2.1 DRIVERS
- 5.2.1.1 Implementation of Net-Zero Framework with GHG pricing
- 5.2.1.2 Rise in short-sea transport and coastal tourism
- 5.2.1.3 Advances in energy storage and power systems
- 5.2.1.4 Decarbonization and sustainability goals
- 5.2.2 RESTRAINTS
- 5.2.2.1 High upfront investment and prolonged retrofit downtime
- 5.2.2.2 Technical limitations in range and power scalability
- 5.2.2.3 Fragmented regulatory standards and compliance burden
- 5.2.3 OPPORTUNITIES
- 5.2.3.1 Innovations in energy storage solutions
- 5.2.3.2 Scaling of battery and fuel cell technologies for long-range shipping
- 5.2.3.3 Government incentives for clean shipbuilding programs
- 5.2.4 CHALLENGES
- 5.2.4.1 Supply chain constraints for critical materials
- 5.2.4.2 Lack of adequate charging and port infrastructure
- 5.2.1 DRIVERS
- 5.3 TRENDS AND DISRUPTIONS IMPACTING CUSTOMER BUSINESS
- 5.4 ECOSYSTEM ANALYSIS
- 5.4.1 SHIP BUILDERS
- 5.4.2 SYSTEM INTEGRATORS
- 5.4.3 END USERS
- 5.5 CASE STUDY ANALYSIS
- 5.5.1 CHINA STATE SHIPBUILDING CORPORATION'S FULLY ELECTRIC CONTAINER SHIP
- 5.5.2 INCAT TASMANIA'S HULL 096 FERRY
- 5.5.3 WARTSILA AND WETA'S FULLY ELECTRIC HIGH-SPEED FERRY
- 5.5.4 HD HYUNDAI'S MMC HIGH-PRESSURE ELECTRIC PROPULSION DRIVE
- 5.6 KEY STAKEHOLDERS AND BUYING CRITERIA
- 5.6.1 KEY STAKEHOLDERS IN BUYING PROCESS
- 5.6.2 BUYING CRITERIA
- 5.7 KEY CONFERENCES AND EVENTS
- 5.8 REGULATORY LANDSCAPE
- 5.9 TECHNOLOGY ANALYSIS
- 5.9.1 KEY TECHNOLOGIES
- 5.9.1.1 Energy storage systems
- 5.9.1.2 Electric propulsion and motors
- 5.9.1.3 Smart power distribution and energy management
- 5.9.2 COMPLEMENTARY TECHNOLOGIES
- 5.9.2.1 HVDC shipboard grids
- 5.9.2.2 Fuel cells
- 5.9.2.3 Permanent magnet propulsion rods
- 5.9.3 ADJACENT TECHNOLOGIES
- 5.9.3.1 Renewable energy integration
- 5.9.3.2 Digital twins and simulation platforms
- 5.9.3.3 Charging and shore power infrastructure
- 5.9.1 KEY TECHNOLOGIES
- 5.10 NEWBUILD VS. RETROFIT VESSELS
- 5.11 TRADE DATA
- 5.11.1 IMPORT SCENARIO (HS CODE 8901)
- 5.11.2 EXPORT SCENARIO (HS CODE 8901)
- 5.12 PATENT ANALYSIS
- 5.13 MACROECONOMIC OUTLOOK
- 5.13.1 NORTH AMERICA
- 5.13.2 EUROPE
- 5.13.3 ASIA PACIFIC
- 5.13.4 MIDDLE EAST
- 5.13.5 REST OF THE WORLD
- 5.14 PRICING ANALYSIS
- 5.14.1 AVERAGE SELLING PRICE TREND OF ELECTRIC SHIPS OFFERED BY KEY PLAYERS
- 5.14.2 AVERAGE SELLING PRICE TREND, BY REGION
- 5.15 INVESTMENT AND FUNDING SCENARIO
- 5.16 BUSINESS MODELS
- 5.17 TECHNOLOGY ROADMAP
- 5.18 IMPACT OF AI
- 5.18.1 INTRODUCTION
- 5.18.2 ADOPTION OF AI IN MARINE BY TOP COUNTRIES
- 5.18.3 IMPACT OF AI ON MARINE USE CASES
- 5.18.4 IMPACT OF AI ON ELECTRIC SHIP MARKET
- 5.19 US 2025 TARIFF
- 5.19.1 INTRODUCTION
- 5.19.2 KEY TARIFF RATES
- 5.19.3 PRICE IMPACT ANALYSIS
- 5.19.4 IMPACT ON COUNTRY/REGION
- 5.19.4.1 US
- 5.19.4.2 Europe
- 5.19.4.3 Asia Pacific
- 5.19.5 IMPACT ON END-USE INDUSTRIES
6 ELECTRIC SHIP MARKET, BY AUTONOMY (MARKET SIZE & FORECAST TO 2032, USD)
- 6.1 INTRODUCTION
- 6.2 MANNED
- 6.2.1 ALIGNMENT WITH EXISTING MARITIME PRACTICES TO DRIVE MARKET
- 6.3 REMOTELY OPERATED
- 6.3.1 IMPROVED OPERATIONAL FEASIBILITY TO DRIVE MARKET
- 6.4 AUTONOMOUS
- 6.4.1 FAVORABLE REGULATORY FRAMEWORKS AND SUPPORTING INFRASTRUCTURE AT PORTS TO DRIVE MARKET
7 ELECTRIC SHIP MARKET, BY POINT OF SALE (MARKET SIZE & FORECAST TO 2032, USD)
- 7.1 INTRODUCTION
- 7.2 FULLY ELECTRIC
- 7.2.1 PREVALENCE OF BATTERY-POWERED VESSELS TO DRIVE MARKET
- 7.2.2 BATTERY-POWERED
- 7.2.3 ELECTRO-SOLAR & BATTERY-POWERED
- 7.2.4 FUEL CELL & BATTERY-POWERED
- 7.3 HYBRID
- 7.3.1 EXTENSIVE USE IN VESSELS WITH VARIABLE DUTY CYCLES TO DRIVE MARKET
- 7.3.2 DIESEL & BATTERY-POWERED
- 7.3.3 LPG/LNG & BATTERY-POWERED
8 ELECTRIC SHIP MARKET, BY POWER CAPACITY (MARKET SIZE & FORECAST TO 2032, USD)
- 8.1 INTRODUCTION
- 8.2 <75 KW
- 8.2.1 LARGE-SCALE ADOPTION IN SMALLER VESSELS TO DRIVE MARKET
- 8.3 75-150 KW
- 8.3.1 NEED FOR LONGER OPERATING HOURS AND HIGHER SERVICE SPEEDS TO DRIVE MARKET
- 8.4 151-745 KW
- 8.4.1 FERRY ELECTRIFICATION PROGRAMS AND DECARBONIZATION POLICIES TO DRIVE MARKET
- 8.5 746-7,560 KW
- 8.5.1 EMPHASIS ON SYSTEM RELIABILITY AND ENDURANCE TO DRIVE MARKET
- 8.6 >7,560 KW
- 8.6.1 INTRODUCTION OF ALTERNATIVE ENERGY SOURCES INTO OCEANGOING SHIPPING TO DRIVE MARKET
9 ELECTRIC SHIP MARKET, BY RANGE (MARKET SIZE & FORECAST TO 2032, USD)
- 9.1 INTRODUCTION
- 9.2 <50 KM
- 9.2.1 COMMERCIAL VIABILITY FOR ELECTRIC PROPULSION ADOPTION TO DRIVE MARKET
- 9.3 50-100 KM
- 9.3.1 REGIONAL CONNECTIVITY NEEDS TO DRIVE MARKET
- 9.4 101-1,000 KM
- 9.4.1 VESSEL OPERATIONS REQUIRING EXTENDED ENDURANCE AND CONSISTENT PERFORMANCE TO DRIVE MARKET
- 9.5 >1,000 KM
- 9.5.1 CONTINUOUS HIGH-POWER OUTPUT REQUIREMENT FOR PROLONGED PERIOD TO DRIVE MARKET
10 ELECTRIC SHIP MARKET, BY TONNAGE (MARKET SIZE & FORECAST TO 2032, USD)
- 10.1 INTRODUCTION
- 10.2 <500 DWT
- 10.2.1 REDUCED PROPULSION DEMAND DUE TO LIMITED CARGO AND PASSENGER CAPACITY TO DRIVE MARKET
- 10.3 500-5,000 DWT
- 10.3.1 OPERATIONAL DEMANDS FOR SCALABLE AND MODULAR PROPULSION SOLUTIONS TO DRIVE MARKET
- 10.4 5,001-15,000 DWT
- 10.4.1 NEED FOR HIGHER PROPULSION CAPACITY AND ENDURANCE TO DRIVE MARKET
- 10.5 >15,000 DWT
- 10.5.1 EXTENSIVE USE OF HYBRID CONFIGURATIONS TO DRIVE MARKET
11 ELECTRIC SHIP MARKET, BY SHIP TYPE (MARKET SIZE & FORECAST TO 2032, USD)
- 11.1 INTRODUCTION
- 11.2 COMMERCIAL
- 11.2.1 STRINGENT ENVIRONMENTAL REGULATIONS AND EXPANSION OF CHARGING INFRASTRUCTURE TO DRIVE MARKET
- 11.2.2 PASSENGER VESSELS
- 11.2.2.1 Yachts
- 11.2.2.2 Ferries
- 11.2.2.3 Cruise ships
- 11.2.2.4 Motorboats
- 11.2.3 CARGO VESSELS
- 11.2.3.1 Container vessels
- 11.2.3.2 Bulk carriers
- 11.2.3.3 Tankers
- 11.2.3.4 General cargo ships
- 11.2.4 OTHERS
- 11.2.4.1 Fishing vessels
- 11.2.4.2 Tugs & workboats
- 11.2.4.3 Research vessels
- 11.2.4.4 Dredgers
- 11.2.4.5 Submarines
- 11.3 DEFENSE
- 11.3.1 NAVAL MODERNIZATION PROGRAMS TO DRIVE MARKET
- 11.3.2 DESTROYERS
- 11.3.3 FRIGATES
- 11.3.4 CORVETTES
- 11.3.5 OFFSHORE SUPPORT VESSELS
- 11.3.6 AIRCRAFT CARRIERS
- 11.3.7 SUBMARINES
12 ELECTRIC SHIP MARKET, BY REGION (MARKET SIZE & FORECAST TO 2032, USD)
- 12.1 INTRODUCTION
- 12.2 NORTH AMERICA
- 12.2.1 PESTLE ANALYSIS
- 12.2.2 US
- 12.2.2.1 Rise of maritime electrification to drive market
- 12.2.3 CANADA
- 12.2.3.1 Advances in electric shipping through fleet renewal and integrated infrastructure programs to drive market
- 12.3 EUROPE
- 12.3.1 PESTLE ANALYSIS
- 12.3.2 NORWAY
- 12.3.2.1 Shift from traditional fossil-fuel-powered vessels to electric alternatives to drive market
- 12.3.3 SWEDEN
- 12.3.3.1 Robust national sustainability agenda to drive market
- 12.3.4 NETHERLANDS
- 12.3.4.1 Transition to zero-emission shipping to drive market
- 12.3.5 FINLAND
- 12.3.5.1 Advanced shipbuilding expertise to drive market
- 12.3.6 DENMARK
- 12.3.6.1 Favorable environmental regulations to drive market
- 12.3.7 UK
- 12.3.7.1 Regulatory push for zero-emission shipping to drive market
- 12.3.8 REST OF EUROPE
- 12.4 ASIA PACIFIC
- 12.4.1 PESTLE ANALYSIS
- 12.4.2 CHINA
- 12.4.2.1 Domestic battery and power electronics leadership to drive market
- 12.4.3 JAPAN
- 12.4.3.1 Government-led autonomy initiatives to drive market
- 12.4.4 AUSTRALIA
- 12.4.4.1 Infrastructure modernization and innovation agility to drive market
- 12.4.5 SOUTH KOREA
- 12.4.5.1 Policy-backed fleets, green power supply, and shipyard dominance to drive market
- 12.4.6 INDIA
- 12.4.6.1 Infrastructure modernization and solar innovation to drive market
- 12.4.7 REST OF ASIA PACIFIC
- 12.5 MIDDLE EAST
- 12.5.1 PESTLE ANALYSIS
- 12.5.2 GCC
- 12.5.2.1 Saudi Arabia
- 12.5.2.1.1 Increase in marine travel to drive market
- 12.5.2.2 UAE
- 12.5.2.2.1 Port modernization and green shipping initiatives to drive market
- 12.5.2.1 Saudi Arabia
- 12.5.3 ISRAEL
- 12.5.3.1 Technology integration and naval modernization to drive market
- 12.5.4 TURKEY
- 12.5.4.1 Compliance with international trade and shipping regulations to drive market
- 12.6 REST OF THE WORLD
- 12.6.1 PESTLE ANALYSIS
- 12.6.2 AFRICA
- 12.6.2.1 Urban transit modernization and tourism-led initiatives to drive market
- 12.6.3 LATIN AMERICA
- 12.6.3.1 Inland waterway scale and eco-tourism to drive market
13 COMPETITIVE LANDSCAPE
- 13.1 INTRODUCTION
- 13.2 KEY PLAYER STRATEGIES/RIGHT TO WIN, 2022-2025
- 13.3 MARKET SHARE ANALYSIS, 2024
- 13.4 REVENUE ANALYSIS, 2021-2024
- 13.5 BRAND/PRODUCT COMPARISON
- 13.6 COMPANY VALUATION AND FINANCIAL METRICS
- 13.7 COMPANY EVALUATION MATRIX: KEY PLAYERS, 2024
- 13.7.1 STARS
- 13.7.2 EMERGING LEADERS
- 13.7.3 PERVASIVE PLAYERS
- 13.7.4 PARTICIPANTS
- 13.7.5 COMPANY FOOTPRINT
- 13.7.5.1 Company footprint
- 13.7.5.2 Region footprint
- 13.7.5.3 Point of sale footprint
- 13.7.5.4 Ship type footprint
- 13.8 COMPANY EVALUATION MATRIX: START-UPS/SMES, 2025
- 13.8.1 PROGRESSIVE COMPANIES
- 13.8.2 RESPONSIVE COMPANIES
- 13.8.3 DYNAMIC COMPANIES
- 13.8.4 STARTING BLOCKS
- 13.8.5 COMPETITIVE BENCHMARKING
- 13.8.5.1 List of start-ups/SMEs
- 13.8.5.2 Competitive benchmarking of start-ups/SMEs
- 13.9 COMPETITIVE SCENARIO
- 13.9.1 PRODUCT LAUNCHES/DEVELOPMENTS
- 13.9.2 DEALS
- 13.9.3 OTHERS
14 COMPANY PROFILES
- 14.1 KEY PLAYERS
- 14.1.1 ABB
- 14.1.1.1 Business overview
- 14.1.1.2 Products offered
- 14.1.1.3 Recent developments
- 14.1.1.3.1 Product launches/developments
- 14.1.1.3.2 Deals
- 14.1.1.3.3 Others
- 14.1.1.4 MnM view
- 14.1.1.4.1 Right to win
- 14.1.1.4.2 Strategic choices
- 14.1.1.4.3 Weaknesses and competitive threats
- 14.1.2 WARTSILA
- 14.1.2.1 Business overview
- 14.1.2.2 Products offered
- 14.1.2.3 Recent developments
- 14.1.2.3.1 Product launches/developments
- 14.1.2.3.2 Deals
- 14.1.2.3.3 Others
- 14.1.2.4 MnM view
- 14.1.2.4.1 Right to win
- 14.1.2.4.2 Strategic choices
- 14.1.2.4.3 Weaknesses and competitive threats
- 14.1.3 SCHOTTEL GROUP
- 14.1.3.1 Business overview
- 14.1.3.2 Products offered
- 14.1.3.3 Recent developments
- 14.1.3.3.1 Deals
- 14.1.3.3.2 Others
- 14.1.3.4 MnM view
- 14.1.3.4.1 Right to win
- 14.1.3.4.2 Strategic choices
- 14.1.3.4.3 Weaknesses and competitive threats
- 14.1.4 CORVUS ENERGY
- 14.1.4.1 Business overview
- 14.1.4.2 Products offered
- 14.1.4.3 Recent developments
- 14.1.4.3.1 Deals
- 14.1.4.3.2 Others
- 14.1.4.4 MnM view
- 14.1.4.4.1 Right to win
- 14.1.4.4.2 Strategic choices
- 14.1.4.4.3 Weaknesses and competitive threats
- 14.1.5 GE VERNOVA
- 14.1.5.1 Business overview
- 14.1.5.2 Products offered
- 14.1.5.3 Recent developments
- 14.1.5.3.1 Deals
- 14.1.5.3.2 Others
- 14.1.5.4 MnM view
- 14.1.5.4.1 Right to win
- 14.1.5.4.2 Strategic choices
- 14.1.5.4.3 Weaknesses and competitive threats
- 14.1.6 KONGSBERG
- 14.1.6.1 Business overview
- 14.1.6.2 Products offered
- 14.1.6.3 Recent developments
- 14.1.6.3.1 Others
- 14.1.7 VARD AS
- 14.1.7.1 Business overview
- 14.1.7.2 Products offered
- 14.1.7.3 Recent developments
- 14.1.7.3.1 Others
- 14.1.8 SIEMENS
- 14.1.8.1 Business overview
- 14.1.8.2 Products offered
- 14.1.9 LECLANCHE SA
- 14.1.9.1 Business overview
- 14.1.9.2 Products offered
- 14.1.9.3 Recent developments
- 14.1.9.3.1 Product launches/developments
- 14.1.9.3.2 Deals
- 14.1.9.3.3 Others
- 14.1.10 BAE SYSTEMS
- 14.1.10.1 Business overview
- 14.1.10.2 Products offered
- 14.1.10.3 Recent developments
- 14.1.10.3.1 Others
- 14.1.11 SAFT
- 14.1.11.1 Business overview
- 14.1.11.2 Products offered
- 14.1.12 NORWEGIAN ELECTRIC SYSTEMS
- 14.1.12.1 Business overview
- 14.1.12.2 Products offered
- 14.1.12.3 Recent developments
- 14.1.12.3.1 Deals
- 14.1.12.3.2 Others
- 14.1.13 EVERLLENCE
- 14.1.13.1 Business overview
- 14.1.13.2 Products offered
- 14.1.13.3 Recent developments
- 14.1.13.3.1 Product launches/developments
- 14.1.13.3.2 Deals
- 14.1.13.3.3 Others
- 14.1.14 ECHANDIA AB
- 14.1.14.1 Business overview
- 14.1.14.2 Products offered
- 14.1.14.3 Recent developments
- 14.1.14.3.1 Deals
- 14.1.14.3.2 Others
- 14.1.15 ANGLO BELGIAN CORPORATION NV
- 14.1.15.1 Business overview
- 14.1.15.2 Products offered
- 14.1.15.3 Recent developments
- 14.1.15.3.1 Deals
- 14.1.15.3.2 Others
- 14.1.16 DANFOSS
- 14.1.16.1 Business overview
- 14.1.16.2 Products offered
- 14.1.16.3 Recent developments
- 14.1.16.3.1 Deals
- 14.1.16.3.2 Others
- 14.1.17 FJELLSTRAND AS
- 14.1.17.1 Business overview
- 14.1.17.2 Products offered
- 14.1.17.3 Recent developments
- 14.1.17.3.1 Product launches/developments
- 14.1.17.3.2 Others
- 14.1.18 SOBY SHIPYARD
- 14.1.18.1 Business overview
- 14.1.18.2 Products offered
- 14.1.19 MITSUBISHI SHIPBUILDING CO., LTD.
- 14.1.19.1 Business overview
- 14.1.19.2 Products offered
- 14.1.20 DAMEN SHIPYARDS GROUP
- 14.1.20.1 Business overview
- 14.1.20.2 Products offered
- 14.1.20.3 Recent developments
- 14.1.20.3.1 Product launches/developments
- 14.1.20.3.2 Deals
- 14.1.20.3.3 Others
- 14.1.21 BALTIC WORKBOATS AS
- 14.1.21.1 Business overview
- 14.1.21.2 Products offered
- 14.1.21.3 Recent developments
- 14.1.21.3.1 Deals
- 14.1.21.3.2 Others
- 14.1.22 COCHIN SHIPYARD LIMITED
- 14.1.22.1 Business overview
- 14.1.22.2 Products offered
- 14.1.22.3 Recent developments
- 14.1.22.3.1 Product launches/developments
- 14.1.22.3.2 Deals
- 14.1.22.3.3 Others
- 14.1.1 ABB
- 14.2 OTHER PLAYERS
- 14.2.1 ECO MARINE POWER CO., LTD.
- 14.2.2 EST FLOATTECH
- 14.2.3 SHIFT
- 14.2.4 INCAT CROWTHER
- 14.2.5 INGETEAM, S.A.
- 14.2.6 VOITH TURBO MARINE
- 14.2.7 YARA
15 APPENDIX
- 15.1 DISCUSSION GUIDE
- 15.2 KNOWLEDGESTORE: MARKETSANDMARKETS' SUBSCRIPTION PORTAL
- 15.3 CUSTOMIZATION OPTIONS
- 15.4 RELATED REPORTS
- 15.5 AUTHOR DETAILS

