


|
시장보고서
상품코드
1843275
천연가스 발전 시장 : 기술별, 최종사용자별, 연료원별, 출력별, 지역별 예측(-2030년)Natural Gas Power Generation Market by Technology (Combined Cycle, Open Cycle, Cogeneration), End User (Power Utilities, Industrial, Residential & Commercial), Fuel Source (Pipeline, Liquefied), Power Output, and Region - Global Forecast to 2030 |
||||||
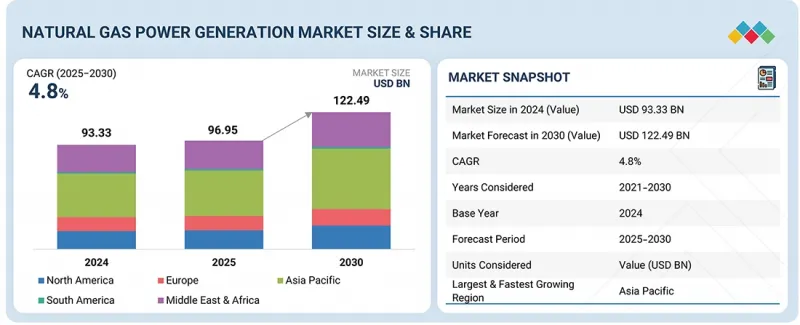
세계의 천연가스 발전 시장 규모는 2025년 969억 5,000만 달러에서 2030년까지 1,224억 9,000만 달러에 이를 것으로 예측되며, CAGR 4.8%의 성장이 예상됩니다. 시장은 보다 깨끗하고 유연한 에너지원에 대한 세계 수요 증가가 촉진요인이 되고 있습니다. 급속한 도시화와 산업화가 특히 신흥 경제권에서 전력 소비를 밀어 올리고 있습니다.
| 조사 범위 | |
|---|---|
| 조사 대상 연도 | 2021-2030년 |
| 기준 연도 | 2024년 |
| 예측 기간 | 2025-2030년 |
| 단위 | 100만 달러, MW |
| 부문 | 기술, 연료원, 출력, 최종 용도, 지역 |
| 대상 지역 | 북미, 유럽, 아시아태평양, 중동, 아프리카, 남미 |
천연가스는 석탄에 비해 탄소 배출이 비교적 적기 때문에 환경규제가 강화되는 가운데 이행연료로 선호되고 있습니다. 결합 사이클 및 오픈 사이클 기술의 발전은 효율성을 높이고 운전 비용을 절감합니다. 또한 천연가스 발전소는 송전망의 안정성과 신속한 기동능력을 제공하여 간헐적인 신재생에너지 통합을 지원합니다. LNG 무역 증가는 연료에 대한 접근을 더욱 향상시킵니다.

"연료원별로는 파이프라인 천연가스 부문이 예측기간에 가장 큰 부문으로 계속될 전망입니다."
파이프라인 천연가스는 발전소에 안정성, 연속성, 비용 효율적인 연료 공급을 제공하며 안정적인 발전을 지원합니다. 또한 파이프라인이나 유통망 등의 인프라가 확립되어 있어 집중형 및 분산형 발전 시설 모두 원활한 공급이 가능합니다. 또한 파이프라인 천연가스는 다른 화석연료에 비해 탄소 배출이 적기 때문에 세계적인 에너지 전환 목표와 보다 깨끗한 에너지원을 타겟으로 하는 규제 프레임워크에 합치하고 있습니다. 주요 지역의 산업화, 도시화 및 전력 수요 증가는 파이프라인 천연가스 채택을 더욱 촉진합니다. 또한, 파이프라인 인프라에 대한 지속적인 투자와 확장 프로젝트는 시장에서 파이프라인 천연가스의 우위를 강화하고, 그 바람직한 연료원으로서의 지위를 유지하고 있습니다.
"최종 용도별로는 전력기업이 예측기간에 천연가스 발전 시장에서 가장 유리한 부문이 될 전망입니다."
전력기업은 주로 대규모 천연가스 발전소를 경영하고 있으며, 증대하는 주택, 상업, 공업 수요를 충족하기 위해 안정적이고 신뢰할 수 있는 전력을 공급하고 있습니다. 이 부문은 규모의 경제, 확립된 인프라, 보다 깨끗한 에너지원을 촉진하는 규제 지원으로부터 혜택을 누리고 있습니다. 전력 수요 증가는 이산화탄소 배출 감축의 필요성도 있으며, 전력 기업이 천연가스를 주요 연료로 채용하는 촉진요인이 되고 있습니다. 또한 송전망의 근대화 및 확장 프로젝트에 대한 지속적인 투자로 시장에서 전력 기업의 이점이 더욱 강화되고 예측 기간 동안 전력 기업이 주요 최종 사용자 부문이 되었습니다.
“지역별로는 중동 및 아프리카가 예측기간에 천연가스 발전 시장에서 두 번째로 큰 지역이 될 전망입니다.”
중동 및 아프리카는 풍부한 천연가스 매장량과 산업 및 도시 부문에 걸친 에너지 수요의 확대로 천연가스 발전 시장에서 두 번째로 큰 지역으로 부상하고 있습니다. 사우디아라비아, 아랍에미리트(UAE), 남아프리카 등의 국가에서는 급속한 경제 개발과 도시화가 진행되고 있으며, 신뢰성이 높고 깨끗한 전원에 대한 요구가 높아지고 있습니다. 각국 정부는 석유 의존도를 낮추고 에너지 안보를 강화하기 위해 결합 사이클 발전소와 LNG 기지를 포함한 천연가스 인프라에 대한 투자를 늘리고 있습니다. 또한, 보다 깨끗한 에너지 채용에 대한 유리한 규제 프레임워크와 인센티브는 전력 기업과 독립 발전 사업자들에게 천연가스용량의 확대를 촉구하고 있습니다. 이 지역은 에너지의 다양화와 가스 화력 발전소와 신재생에너지의 통합을 전략적으로 중시하고 시장 성장을 더욱 강화하고 있습니다.
본 보고서는 세계 천연가스 발전 시장에 대한 조사 분석을 통해 주요 촉진요인과 억제요인, 경쟁 구도, 미래 동향 등의 정보를 제공합니다.
자주 묻는 질문
목차
제1장 서론
제2장 조사 방법
제3장 주요 요약
제4장 중요한 지견
- 천연가스 발전 시장의 매력적인 기회
- 천연가스 발전 시장 : 지역별
- 천연가스 발전 시장 : 연료 기술별
- 천연가스 발전 시장 : 연료원별
- 천연가스 발전 시장 : 출력별
- 천연가스 발전 시장 : 최종 용도별
- 아시아태평양의 천연가스 발전 시장 : 연료원별, 국가별
제5장 시장 개요
- 소개
- 시장 역학
- 성장 촉진요인
- 억제요인
- 기회
- 과제
- 고객사업에 영향을 주는 동향/혼란
- 공급망 분석
- 생태계 분석
- 기술 분석
- 주요 기술
- 인접 기술
- 보완 기술
- 사례 연구 분석
- 특허 분석
- 주요 컨퍼런스 및 이벤트(2025-2026년)
- 가격 설정 분석
- 천연가스 발전소 설비 투자액 : 출력별(2024년)
- 천연가스 발전소 평균 자본 지출 : 지역별(2022-2024년)
- 무역 분석
- 수입 데이터(HS 코드 8411)
- 수출 데이터(HS 코드 8411)
- 관세 및 규제 상황
- 관세 분석
- 규제기관, 정부기관, 기타 조직
- 규제
- Porter's Five Forces 분석
- 주요 이해관계자와 구매 기준
- 투자 및 자금조달 시나리오
- 천연가스 발전시장에 대한 AI/생성AI의 영향
- 천연가스 발전 최종 용도에서 AI/생성형 AI의 채용
- 천연가스 발전 공급망에 대한 AI/생성형 AI의 영향 : 지역별
- 세계의 거시경제 전망
- 소개
- 탄소 중립적 모빌리티와 산업에 대한 주목
- 기술의 진보
- 자금 조달과 정부의 정책 지원
- 인플레이션에서 고액의 설비 투자
- 천연가스 발전시장에 대한 2025년 미국 관세의 영향
- 소개
- 주요 관세율
- 가격의 영향 분석
- 국가/지역에 미치는 영향
- 수입/수출에 미치는 영향
- 세계의 천연가스 발전에서 관세의 시프트와 성장
- 최종 용도 용도에 대한 영향
제6장 천연가스 발전 시장 : 기술별
- 소개
- 결합 사이클
- 오픈 사이클
- 코제네레이션
제7장 천연가스 발전 시장 : 연료원별
- 소개
- 파이프라인 천연가스
- 액화 천연가스
제8장 천연가스 발전 시장 : 출력별
- 소개
- 50MW 이하
- 51-200MW
- 201-500MW
- 501-1,000MW
- 1,000MW 이상
제9장 천연가스 발전 시장 : 최종 용도별
- 소개
- 전력 기업
- 공업
- 주택 및 상업
제10장 천연가스 발전 시장 : 지역별
- 소개
- 아시아태평양
- 중국
- 인도네시아
- 한국
- 태국
- 일본
- 기타 아시아태평양
- 북미
- 미국
- 캐나다
- 멕시코
- 남미
- 브라질
- 아르헨티나
- 기타 남미
- 유럽
- 러시아
- 영국
- 독일
- 이탈리아
- 프랑스
- 기타 유럽
- 중동 및 아프리카
- GCC
- 이란
- 알제리
- 나이지리아
- 기타 중동 및 아프리카
제11장 경쟁 구도
- 개요
- 주요 참가 기업의 전략/강점(2021-2025년)
- 시장 점유율 분석(2024년)
- 수익 분석(2020-2024년)
- 기업 평가 및 재무 지표
- 브랜드 비교
- 기업 평가 매트릭스 : 주요 기업(2024년)
- 기업 평가 매트릭스 : 스타트업/중소기업(2024년)
- 경쟁 시나리오
제12장 기업 프로파일
- 주요 기업
- GE VERNOVA
- SIEMENS ENERGY
- MITSUBISHI HEAVY INDUSTRIES, LTD.
- WARTSILA
- ANSALDO ENERGIA
- TECOGEN, INC.
- DESTINUS ENERGY
- BECHTEL CORPORATION
- FLUOR CORPORATION
- WORLEY
- CATERPILLAR
- MCDERMOTT
- CLARKE ENERGY
- BURNS & MCDONNELL
- CALPINE
- 기타 기업
- CAPSTONE GREEN ENERGY HOLDINGS, INC.
- NAUTIX
- 2G ENERGY
- BOSCH INDUSTRIEKESSEL GMBH
- LARSEN & TOUBRO LIMITED
- BHARAT HEAVY ELECTRICALS LIMITED
- KAWASAKI HEAVY INDUSTRIES, LTD.
- SULZER LTD
- ALINTA ENERGY
- LATVENERGO AS
- GEORGIA POWER-SOUTHERN COMPANY
제13장 부록
JHS 25.10.24The global natural gas power generation market is expected to grow from USD 96.95 billion in 2025 to USD 122.49 billion in 2030, with a CAGR of 4.8%. The natural gas power generation market is driven by the increasing global demand for cleaner and more flexible energy sources. Rapid urbanization and industrialization are boosting electricity consumption, particularly in emerging economies.
| Scope of the Report | |
|---|---|
| Years Considered for the Study | 2021-2030 |
| Base Year | 2024 |
| Forecast Period | 2025-2030 |
| Units Considered | Value (USD Million); Volume (MW) |
| Segments | Technology, Fuel Source, Power Output, End-use Application, and Region |
| Regions covered | North America, Europe, Asia Pacific, Middle East & Africa, and South America |
The relatively lower carbon emissions of natural gas compared to coal make it a preferred transition fuel amid tightening environmental regulations. Advancements in combined cycle and open cycle technologies enhance efficiency and reduce operational costs. Additionally, natural gas power plants offer grid stability and quick ramp-up capabilities, supporting the integration of intermittent renewable energy sources. Rising LNG trade further improves fuel accessibility.
"By fuel source, the pipeline natural gas segment is expected to remain the largest segment during the forecast period."
By fuel source, the pipeline natural gas segment is projected to remain the largest segment in the natural gas power generation market throughout the forecast period. Pipeline natural gas offers a reliable, continuous, and cost-effective fuel supply for power plants, supporting stable electricity generation. Its well-established infrastructure, including extensive pipelines and distribution networks, ensures seamless delivery to both centralized and decentralized power generation facilities. Additionally, pipeline natural gas is favored for its lower carbon emissions compared to other fossil fuels, aligning with global energy transition goals and regulatory frameworks targeting cleaner energy sources. Growing industrialization, urbanization, and rising electricity demand in key regions further drive the adoption of pipeline natural gas. Moreover, ongoing investments in pipeline infrastructure and expansion projects reinforce its dominance in the market, maintaining its position as the preferred fuel source.
"By end-use application, power utilities is projected to be the most lucrative segment of the natural gas power generation market during the forecast period."
By end user, the power utilities segment is projected to be the most lucrative in the natural gas power generation market during the forecast period. Power utilities primarily operate large-scale natural gas power plants that provide consistent and reliable electricity to meet growing residential, commercial, and industrial demand. The segment benefits from economies of scale, established infrastructure, and regulatory support promoting cleaner energy sources. Increasing electricity demand, coupled with the need to reduce carbon emissions, drives utilities to adopt natural gas as a key fuel. Additionally, ongoing investments in grid modernization and expansion projects further strengthen the dominance of power utilities in the market, making them the leading end-user segment throughout the forecast period.
"By region, Middle East & Africa is expected to be the second-largest region in the natural gas power generation market during the forecast period."
The Middle East & Africa is emerging as the second-largest region in the natural gas power generation market, driven by abundant natural gas reserves and growing energy demand across industrial and urban sectors. Rapid economic development and urbanization in countries such as Saudi Arabia, the UAE, and South Africa are fueling the need for reliable and cleaner power sources. Governments are increasingly investing in natural gas infrastructure, including combined cycle plants and LNG terminals, to reduce dependence on oil and enhance energy security. Additionally, favorable regulatory frameworks and incentives for cleaner energy adoption encourage utilities and independent power producers to expand natural gas capacity. The region's strategic focus on energy diversification and integration of gas-fired plants with renewable energy further strengthens market growth.
Breakdown of Primaries:
In-depth interviews have been conducted with various key industry participants, subject-matter experts, C-level executives of key market players, and industry consultants, among other experts, to obtain and verify critical qualitative and quantitative information and assess future market prospects. The distribution of primary interviews is as follows:
By Company Type: Tier 1- 30%, Tier 2- 55%, and Tier 3- 15%
By Designation: C-Level Executives - 30%, Directors- 20%, and Others- 50%
By Region: North America- 20%, Europe- 8%, Asia Pacific- 55%, Middle East & Africa- 13%, and South America- 4%
Note: Others include product engineers, product specialists, and engineering leads.
Note: The tiers of the companies are defined based on their total revenues as of 2023. Tier 1: > USD 1 billion, Tier 2: From USD 500 million to USD 1 billion, and Tier 3: < USD 500 million
The natural gas power generation market is dominated by a few major players that have a wide regional presence. The leading players in the natural gas power generation market are GE Vernova (US), Siemens Energy (Germany), Tecogen, Inc. (US), Destinus Energy (US), Bechtel Corporation (US), Fluor Corporation (US), Worley (Australia), MITSUBISHI HEAVY INDUSTRIES, LTD. (Japan), Caterpillar Inc. (US), Wartsila (Finland), McDermott (US) and Clarke Energy (UK), among others.
Study Coverage:
The report defines, describes, and forecasts the natural gas power generation market by technology, fuel source, power output, and end user. It also offers a detailed qualitative and quantitative analysis of the market. The report provides a comprehensive review of the major market drivers, restraints, opportunities, and challenges. It also covers various important aspects of the market. These include an analysis of the competitive landscape, market dynamics, market estimates in terms of value, and future trends in natural gas power generation market.
Key Benefits of Buying the Report
- The natural gas power generation market is driven by the global transition toward cleaner and more flexible energy sources, particularly as countries aim to reduce carbon emissions while ensuring a reliable electricity supply. Natural gas offers a lower-emission alternative to coal and oil, making it ideal for meeting growing power demand in industrial, commercial, and residential sectors. Its fast ramp-up capabilities support grid stability and the integration of intermittent renewable energy sources such as solar and wind. Supportive government policies, emission regulations, and incentives for cleaner fuels are encouraging investment in gas-fired power plants. Technological advancements in combined cycle, open cycle, and LNG infrastructure are enhancing efficiency, reducing operational costs, and improving energy security. With the rising need for sustainable and reliable power, natural gas remains a crucial bridge fuel in the global energy transition.
- Product Development/Innovation: The natural gas power generation market is advancing through technological innovations aimed at improving efficiency, flexibility, and environmental performance. Companies are focusing on combined cycle and open cycle advancements that maximize energy output while reducing fuel consumption and emissions. Innovations in turbine design, heat recovery systems, and combustion technologies are enhancing operational efficiency and lowering greenhouse gas intensity. Modular and scalable gas-fired power plants enable faster deployment and flexible integration with renewable energy sources. Digitalization, including real-time monitoring, predictive maintenance, and smart grid integration, is optimizing plant performance and reliability. Additionally, developments in carbon capture, hydrogen blending, and co-firing strategies are further reducing the environmental footprint of natural gas power generation, making it a key transitional technology in the global shift toward sustainable energy.
- Market Development: In September 2025, Electricity Supply Board (ESB) of Ireland and GE Vernova partnered on a major life extension and modernization project for the Dublin Bay power plant to boost performance, reliability, output, and support Ireland's Net Zero 2040 targets. Under a new service agreement, GE Vernova will deploy its GT26 High Efficiency (HE) upgrade, SEMIPOL technology for Static Excitation Equipment (SEE), and Startup Frequency Converter (SFC). The project, scheduled for completion in 2026, will modernize the facility, which was commissioned in 2002 and currently produces up to 415 MW with a single-shaft GT26 gas turbine.
- Market Diversification: In August 2025, GE Vernova will invest in its Quebec factories at Sorel-Tracy (hydropower) and La Prairie (grid) sites. The move aligns with Hydro-Quebec's USD 200 billion 2035 Action Plan, including USD 150 billion in capital expansion to upgrade the grid, boost hydropower and wind capacity, and modernize infrastructure. GE Vernova's expansion aims to strengthen energy resilience, meet customer needs, and support long-term energy security.
- Competitive Assessment: Assessment of rankings of some of the key players, including of GE Vernova (US), Siemens Energy (Germany), Tecogen, Inc. (US), Destinus Energy (US), Bechtel Corporation (US), Fluor Corporation (US), Worley (Australia), MITSUBISHI HEAVY INDUSTRIES, LTD. (Japan), Caterpillar Inc. (US), Wartsila (Finland), McDermott (US) and Clarke Energy (UK), among others.
TABLE OF CONTENTS
1 INTRODUCTION
- 1.1 STUDY OBJECTIVES
- 1.2 MARKET DEFINITION
- 1.3 STUDY SCOPE
- 1.3.1 MARKETS COVERED AND REGIONAL SCOPE
- 1.3.2 INCLUSIONS AND EXCLUSIONS
- 1.3.3 YEARS CONSIDERED
- 1.4 CURRENCY CONSIDERED
- 1.5 UNIT CONSIDERED
- 1.6 LIMITATIONS
- 1.7 STAKEHOLDERS
2 RESEARCH METHODOLOGY
- 2.1 RESEARCH DATA
- 2.1.1 SECONDARY DATA
- 2.1.1.1 List of key secondary sources
- 2.1.1.2 Key data from secondary sources
- 2.1.2 PRIMARY DATA
- 2.1.2.1 List of primary interview participants
- 2.1.2.2 Key industry insights
- 2.1.2.3 Key data from primary sources
- 2.1.2.4 Breakdown of primaries
- 2.1.1 SECONDARY DATA
- 2.2 MARKET SIZE ESTIMATION
- 2.2.1 BOTTOM-UP APPROACH
- 2.2.1.1 Regional analysis
- 2.2.1.2 Country analysis
- 2.2.1.3 Demand-side assumptions
- 2.2.1.4 Demand-side calculations
- 2.2.2 TOP-DOWN APPROACH
- 2.2.2.1 Supply-side assumptions
- 2.2.2.2 Supply-side calculations
- 2.2.1 BOTTOM-UP APPROACH
- 2.3 MARKET BREAKDOWN AND DATA TRIANGULATION
- 2.4 FORECAST
- 2.5 RESEARCH ASSUMPTIONS
- 2.6 RISK ANALYSIS
- 2.7 RESEARCH LIMITATIONS
3 EXECUTIVE SUMMARY
4 PREMIUM INSIGHTS
- 4.1 ATTRACTIVE OPPORTUNITIES FOR PLAYERS IN NATURAL GAS POWER GENERATION MARKET
- 4.2 NATURAL GAS POWER GENERATION MARKET, BY REGION
- 4.3 NATURAL GAS POWER GENERATION MARKET, BY FUEL TECHNOLOGY
- 4.4 NATURAL GAS POWER GENERATION MARKET, BY FUEL SOURCE
- 4.5 NATURAL GAS POWER GENERATION MARKET, BY POWER OUTPUT
- 4.6 NATURAL GAS POWER GENERATION MARKET, BY END-USE APPLICATION
- 4.7 NATURAL GAS POWER GENERATION MARKET IN ASIA PACIFIC, BY FUEL SOURCE AND COUNTRY
5 MARKET OVERVIEW
- 5.1 INTRODUCTION
- 5.2 MARKET DYNAMICS
- 5.2.1 DRIVERS
- 5.2.1.1 Shift from coal to cleaner energy alternatives
- 5.2.1.2 High efficiency of combined-cycle gas turbines
- 5.2.1.3 Expanding gas-fired capacity
- 5.2.2 RESTRAINTS
- 5.2.2.1 Volatile price of natural gas
- 5.2.2.2 High infrastructure costs
- 5.2.2.3 Alternative cheaper clean energy technologies
- 5.2.3 OPPORTUNITIES
- 5.2.3.1 Emphasis on securing sustainable energy future
- 5.2.3.2 Expansion of LNG infrastructure
- 5.2.3.3 Ongoing technological advancements in CCUS
- 5.2.4 CHALLENGES
- 5.2.4.1 Global commitments to achieve net-zero emissions
- 5.2.4.2 Fuel-related security challenges due to import reliance
- 5.2.1 DRIVERS
- 5.3 TRENDS/DISRUPTIONS IMPACTING CUSTOMER BUSINESS
- 5.4 SUPPLY CHAIN ANALYSIS
- 5.5 ECOSYSTEM ANALYSIS
- 5.6 TECHNOLOGY ANALYSIS
- 5.6.1 KEY TECHNOLOGIES
- 5.6.1.1 Carbon capture, utilization, and storage (CCUS) for gas plants
- 5.6.1.2 Hybrid power plants
- 5.6.2 ADJACENT TECHNOLOGIES
- 5.6.2.1 Natural gas pipeline & distribution infrastructure
- 5.6.2.2 Reciprocating engines
- 5.6.3 COMPLEMENTARY TECHNOLOGIES
- 5.6.3.1 Smart grids
- 5.6.3.2 Energy management systems
- 5.6.1 KEY TECHNOLOGIES
- 5.7 CASE STUDY ANALYSIS
- 5.7.1 REAL-TIME AND AI-ENABLED MONITORING OF STEAM SYSTEM FAULTS DELIVERS COST SAVINGS AND PREDICTIVE MAINTENANCE
- 5.7.2 ADVANCED GRID-BALANCING ASSETS ENHANCE FLEXIBILITY AND DECARBONIZATION IN CALIFORNIA'S GRID INFRASTRUCTURE
- 5.7.3 SCE HYBRID PLANT COMBINES BATTERY STORAGE AND PEAKER TURBINE FOR GRID FLEXIBILITY AND EMISSIONS REDUCTION
- 5.8 PATENT ANALYSIS
- 5.9 KEY CONFERENCES AND EVENTS, 2025-2026
- 5.10 PRICING ANALYSIS
- 5.10.1 INDICATIVE CAPITAL EXPENDITURE ON NATURAL GAS POWER PLANTS, BY POWER OUTPUT, 2024
- 5.10.2 AVERAGE CAPITAL EXPENDITURE ON NATURAL GAS POWER PLANTS, BY REGION, 2022-2024
- 5.11 TRADE ANALYSIS
- 5.11.1 IMPORT DATA (HS CODE 8411)
- 5.11.2 EXPORT DATA (HS CODE 8411)
- 5.12 TARIFF AND REGULATORY LANDSCAPE
- 5.12.1 TARIFF ANALYSIS
- 5.12.2 REGULATORY BODIES, GOVERNMENT AGENCIES, AND OTHER ORGANIZATIONS
- 5.12.3 REGULATIONS
- 5.13 PORTER'S FIVE FORCES ANALYSIS
- 5.13.1 THREAT OF NEW ENTRANTS
- 5.13.2 THREAT OF SUBSTITUTES
- 5.13.3 BARGAINING POWER OF SUPPLIERS
- 5.13.4 BARGAINING POWER OF BUYERS
- 5.13.5 INTENSITY OF COMPETITIVE RIVALRY
- 5.14 KEY STAKEHOLDERS AND BUYING CRITERIA
- 5.14.1 KEY STAKEHOLDERS IN BUYING PROCESS
- 5.14.2 BUYING CRITERIA
- 5.15 INVESTMENT AND FUNDING SCENARIO
- 5.16 IMPACT OF AI/GEN AI ON NATURAL GAS POWER GENERATION MARKET
- 5.16.1 ADOPTION OF AI/GEN AI IN NATURAL GAS POWER GENERATION END-USE APPLICATIONS
- 5.16.2 IMPACT OF AI/GEN AI ON NATURAL GAS POWER GENERATION SUPPLY CHAIN, BY REGION
- 5.17 GLOBAL MACROECONOMIC OUTLOOK
- 5.17.1 INTRODUCTION
- 5.17.2 FOCUS ON CARBON-NEUTRAL MOBILITY AND INDUSTRY
- 5.17.3 TECHNOLOGICAL ADVANCEMENTS
- 5.17.4 FINANCING AND GOVERNMENT POLICY SUPPORT
- 5.17.5 HIGH CAPEX AMID INFLATION
- 5.18 IMPACT OF 2025 US TARIFF ON NATURAL GAS POWER GENERATION MARKET
- 5.18.1 INTRODUCTION
- 5.18.2 KEY TARIFF RATES
- 5.18.3 PRICE IMPACT ANALYSIS
- 5.18.4 IMPACT ON COUNTRIES/REGIONS
- 5.18.4.1 US
- 5.18.4.2 Europe
- 5.18.4.3 Asia Pacific
- 5.18.5 IMPACT ON IMPORTS/EXPORTS
- 5.18.6 TARIFF SHIFTS AND GROWTH IN GLOBAL NATURAL GAS POWER GENERATION
- 5.18.7 IMPACT ON END-USE APPLICATIONS
6 NATURAL GAS POWER GENERATION MARKET, BY TECHNOLOGY
- 6.1 INTRODUCTION
- 6.2 COMBINED CYCLE
- 6.2.1 GROWING DEMAND FOR LOW-EMISSION POWER GENERATION SOLUTIONS TO FOSTER MARKET GROWTH
- 6.3 OPEN CYCLE
- 6.3.1 SUITABILITY FOR PEAKING POWER PLANTS AND BACKUP GENERATION TO BOOST DEMAND
- 6.4 COGENERATION
- 6.4.1 EMPHASIS ON COST SAVINGS TO DRIVE MARKET
7 NATURAL GAS POWER GENERATION MARKET, BY FUEL SOURCE
- 7.1 INTRODUCTION
- 7.2 PIPELINE NATURAL GAS
- 7.2.1 PROMOTION OF CLEANER ENERGY SOURCES TO SUPPORT MARKET GROWTH
- 7.3 LIQUEFIED NATURAL GAS
- 7.3.1 INNOVATIONS IN LIQUEFACTION, SHIPPING, AND REGASIFICATION TO FOSTER MARKET GROWTH
8 NATURAL GAS POWER GENERATION MARKET, BY POWER OUTPUT
- 8.1 INTRODUCTION
- 8.2 UP TO 50 MW
- 8.2.1 RISING DEMAND FOR DECENTRALIZED POWER SOLUTIONS TO DRIVE MARKET
- 8.3 51-200 MW
- 8.3.1 SUITABILITY FOR REGIONAL GRIDS, INDUSTRIAL CLUSTERS, AND URBAN CENTERS TO BOOST DEMAND
- 8.4 201-500 MW
- 8.4.1 LARGE-SCALE ELECTRICITY DEMAND FROM URBAN CENTERS, INDUSTRIAL HUBS, AND NATIONAL GRIDS TO FOSTER MARKET GROWTH
- 8.5 501-1,000 MW
- 8.5.1 INTEGRATION OF DIGITAL TWIN PLATFORMS TO OFFER GROWTH OPPORTUNITIES
- 8.6 ABOVE 1,000 MW
- 8.6.1 RAPID TECHNOLOGICAL AND DIGITAL ADVANCEMENTS TO BOOST DEMAND
9 NATURAL GAS POWER GENERATION MARKET, BY END-USE APPLICATION
- 9.1 INTRODUCTION
- 9.2 POWER UTILITIES
- 9.2.1 GOVERNMENT-BACKED CLEAN ENERGY INITIATIVES TO BOOST DEMAND
- 9.3 INDUSTRIAL
- 9.3.1 ADOPTION OF DIGITAL AND AUTOMATED CONTROL SYSTEMS TO FUEL MARKET GROWTH
- 9.4 RESIDENTIAL & COMMERCIAL
- 9.4.1 RISING DEMAND FOR DECENTRALIZED AND BACKUP POWER SOLUTIONS ACROSS URBAN CENTERS TO DRIVE MARKET
10 NATURAL GAS POWER GENERATION MARKET, BY REGION
- 10.1 INTRODUCTION
- 10.2 ASIA PACIFIC
- 10.2.1 CHINA
- 10.2.1.1 Increasing investment in modern gas-fired power plants to boost demand
- 10.2.2 INDONESIA
- 10.2.2.1 Emphasis on reducing carbon emissions to drive market
- 10.2.3 SOUTH KOREA
- 10.2.3.1 Expansion of combined-cycle gas turbine plants in coastal regions to fuel market growth
- 10.2.4 THAILAND
- 10.2.4.1 Rising demand in electricity generation and industrial consumption to foster market growth
- 10.2.5 JAPAN
- 10.2.5.1 Focus on minimizing dependency on fossil fuels to drive market
- 10.2.6 REST OF ASIA PACIFIC
- 10.2.1 CHINA
- 10.3 NORTH AMERICA
- 10.3.1 US
- 10.3.1.1 Surging consumption in electric power sector to fuel market growth
- 10.3.2 CANADA
- 10.3.2.1 Rising need to phase out coal-fired power plants to foster market growth
- 10.3.3 MEXICO
- 10.3.3.1 Emphasis on modernizing power fleet to boost demand
- 10.3.1 US
- 10.4 SOUTH AMERICA
- 10.4.1 BRAZIL
- 10.4.1.1 Growing applications in powering industrial growth and energy-intensive operations to fuel market growth
- 10.4.2 ARGENTINA
- 10.4.2.1 Rising demand for flexible energy sources to complement renewable energy sources to drive market
- 10.4.3 REST OF SOUTH AMERICA
- 10.4.1 BRAZIL
- 10.5 EUROPE
- 10.5.1 RUSSIA
- 10.5.1.1 Abundance of reserves and extensive pipeline network to boost demand
- 10.5.2 UK
- 10.5.2.1 Rapid electrification across transport, heating, and digital infrastructure to fuel market growth
- 10.5.3 GERMANY
- 10.5.3.1 Emphasis on modernizing high-efficiency gas infrastructure to support market growth
- 10.5.4 ITALY
- 10.5.4.1 Development of hydrogen-ready infrastructure to boost demand
- 10.5.5 FRANCE
- 10.5.5.1 Expansion of LNG infrastructure to foster market growth
- 10.5.6 REST OF EUROPE
- 10.5.1 RUSSIA
- 10.6 MIDDLE EAST & AFRICA
- 10.6.1 GCC
- 10.6.1.1 Saudi Arabia
- 10.6.1.1.1 Government initiatives to diversify energy mix to offer growth opportunities
- 10.6.1.2 UAE
- 10.6.1.2.1 Emphasis on modernizing natural gas infrastructure to drive market
- 10.6.1.3 Rest of GCC
- 10.6.1.1 Saudi Arabia
- 10.6.2 IRAN
- 10.6.2.1 Expansion of energy-intensive industries to drive market
- 10.6.3 ALGERIA
- 10.6.3.1 Presence of strong export-oriented gas industry to boost demand
- 10.6.4 NIGERIA
- 10.6.4.1 Increasing demand for reliable electricity to fuel economic development to drive market
- 10.6.5 REST OF MIDDLE EAST & AFRICA
- 10.6.1 GCC
11 COMPETITIVE LANDSCAPE
- 11.1 OVERVIEW
- 11.2 KEY PLAYER STRATEGIES/RIGHT TO WIN, 2021-2025
- 11.3 MARKET SHARE ANALYSIS, 2024
- 11.4 REVENUE ANALYSIS, 2020-2024
- 11.5 COMPANY VALUATION AND FINANCIAL METRICS
- 11.6 BRAND COMPARISON
- 11.7 COMPANY EVALUATION MATRIX: KEY PLAYERS, 2024
- 11.7.1 STARS
- 11.7.2 EMERGING LEADERS
- 11.7.3 PERVASIVE PLAYERS
- 11.7.4 PARTICIPANTS
- 11.7.5 COMPANY FOOTPRINT: KEY PLAYERS, 2024
- 11.7.5.1 Company footprint
- 11.7.5.2 Region footprint
- 11.7.5.3 End-use application footprint
- 11.7.5.4 Technology footprint
- 11.7.5.5 Fuel source footprint
- 11.8 COMPANY EVALUATION MATRIX: STARTUPS/SMES, 2024
- 11.8.1 PROGRESSIVE COMPANIES
- 11.8.2 RESPONSIVE COMPANIES
- 11.8.3 DYNAMIC COMPANIES
- 11.8.4 STARTING BLOCKS
- 11.8.5 COMPETITIVE BENCHMARKING: STARTUPS/SMES, 2024
- 11.8.5.1 Detailed list of key startups/SMEs
- 11.8.5.2 Competitive benchmarking of key startups/SMEs
- 11.9 COMPETITIVE SCENARIO
- 11.9.1 DEALS
- 11.9.2 OTHER DEVELOPMENTS
12 COMPANY PROFILES
- 12.1 KEY PLAYERS
- 12.1.1 GE VERNOVA
- 12.1.1.1 Business overview
- 12.1.1.2 Products/Solutions/Services offered
- 12.1.1.3 Recent developments
- 12.1.1.3.1 Deals
- 12.1.1.3.2 Other developments
- 12.1.1.4 MnM view
- 12.1.1.4.1 Key strengths/Right to win
- 12.1.1.4.2 Strategic choices
- 12.1.1.4.3 Weaknesses/Competitive threats
- 12.1.2 SIEMENS ENERGY
- 12.1.2.1 Business overview
- 12.1.2.2 Products/Solutions/Services offered
- 12.1.2.3 Recent developments
- 12.1.2.3.1 Developments
- 12.1.2.4 MnM view
- 12.1.2.4.1 Key strengths/Right to win
- 12.1.2.4.2 Strategic choices
- 12.1.2.4.3 Weaknesses/Competitive threats
- 12.1.3 MITSUBISHI HEAVY INDUSTRIES, LTD.
- 12.1.3.1 Business overview
- 12.1.3.2 Products/Solutions/Services offered
- 12.1.3.3 Recent developments
- 12.1.3.3.1 Developments
- 12.1.3.4 MnM view
- 12.1.3.4.1 Key strengths/Right to win
- 12.1.3.4.2 Strategic choices
- 12.1.3.4.3 Weaknesses/Competitive threats
- 12.1.4 WARTSILA
- 12.1.4.1 Business overview
- 12.1.4.2 Products/Solutions/Services offered
- 12.1.4.3 Recent developments
- 12.1.4.3.1 Developments
- 12.1.4.4 MnM view
- 12.1.4.4.1 Key strengths/Right to win
- 12.1.4.4.2 Strategic choices
- 12.1.4.4.3 Weaknesses/Competitive threats
- 12.1.5 ANSALDO ENERGIA
- 12.1.5.1 Business overview
- 12.1.5.2 Products/Solutions/Services offered
- 12.1.5.3 Recent developments
- 12.1.5.3.1 Developments
- 12.1.5.4 MnM view
- 12.1.5.4.1 Key strengths/Right to win
- 12.1.5.4.2 Strategic choices
- 12.1.5.4.3 Weaknesses/Competitive threats
- 12.1.6 TECOGEN, INC.
- 12.1.6.1 Business overview
- 12.1.6.2 Products/Solutions/Services offered
- 12.1.6.3 Recent developments
- 12.1.6.3.1 Deals
- 12.1.6.3.2 Other developments
- 12.1.7 DESTINUS ENERGY
- 12.1.7.1 Business overview
- 12.1.7.2 Products/Solutions/Services offered
- 12.1.7.3 Recent developments
- 12.1.7.3.1 Deals
- 12.1.8 BECHTEL CORPORATION
- 12.1.8.1 Business overview
- 12.1.8.2 Products/Solutions/Services offered
- 12.1.8.3 Recent developments
- 12.1.8.3.1 Developments
- 12.1.9 FLUOR CORPORATION
- 12.1.9.1 Business overview
- 12.1.9.2 Products/Solutions/Services offered
- 12.1.9.3 Recent developments
- 12.1.9.3.1 Developments
- 12.1.10 WORLEY
- 12.1.10.1 Business overview
- 12.1.10.2 Products/Solutions/Services offered
- 12.1.10.3 Recent developments
- 12.1.10.3.1 Developments
- 12.1.11 CATERPILLAR
- 12.1.11.1 Business overview
- 12.1.11.2 Products/Solutions/Services offered
- 12.1.12 MCDERMOTT
- 12.1.12.1 Business overview
- 12.1.12.2 Products/Solutions/Services offered
- 12.1.13 CLARKE ENERGY
- 12.1.13.1 Business overview
- 12.1.13.2 Products/Solutions/Services offered
- 12.1.14 BURNS & MCDONNELL
- 12.1.14.1 Business overview
- 12.1.14.2 Products/Solutions/Services offered
- 12.1.15 CALPINE
- 12.1.15.1 Business overview
- 12.1.15.2 Products/Solutions/Services offered
- 12.1.1 GE VERNOVA
- 12.2 OTHER PLAYERS
- 12.2.1 CAPSTONE GREEN ENERGY HOLDINGS, INC.
- 12.2.2 NAUTIX
- 12.2.3 2G ENERGY
- 12.2.4 BOSCH INDUSTRIEKESSEL GMBH
- 12.2.5 LARSEN & TOUBRO LIMITED
- 12.2.6 BHARAT HEAVY ELECTRICALS LIMITED
- 12.2.7 KAWASAKI HEAVY INDUSTRIES, LTD.
- 12.2.8 SULZER LTD
- 12.2.9 ALINTA ENERGY
- 12.2.10 LATVENERGO AS
- 12.2.11 GEORGIA POWER - SOUTHERN COMPANY
13 APPENDIX
- 13.1 INSIGHTS FROM INDUSTRY EXPERTS
- 13.2 DISCUSSION GUIDE
- 13.3 KNOWLEDGESTORE: MARKETSANDMARKETS' SUBSCRIPTION PORTAL
- 13.4 CUSTOMIZATION OPTIONS
- 13.5 RELATED REPORTS
- 13.6 AUTHOR DETAILS
