|
시장보고서
상품코드
1856024
구리 제품 시장 예측(-2035년) : 제품, 용도, 최종사용자 산업, 지역별Copper Products Market by Product, Application, End-Use Industry, and Region - Global Forecast to 2035 |
||||||
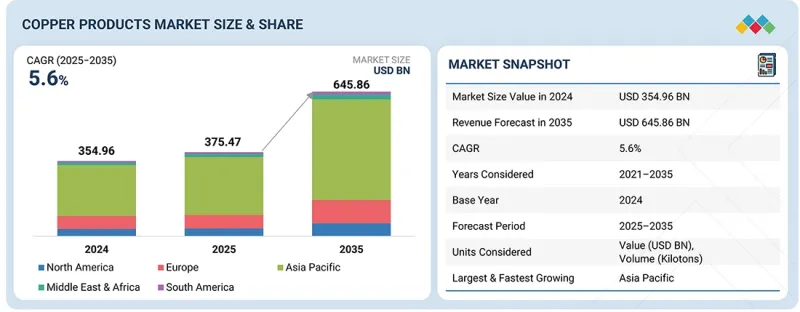
구리 제품 시장 규모는 2025년 3,754억 7,000만 달러에서 예측 기간 중 5.6%의 CAGR로 추이하며, 2035년에는 6,458억 6,000만 달러에 달할 것으로 예측됩니다.
구리 제품 시장은 전력, 건설, 전자, 자동차, 재생에너지 등의 산업에서 구리의 필수적인 역할로 인해 강력한 성장세를 보이고 있습니다. 구리는 우수한 전기 전도성과 열전도율, 내구성, 재사용성이 뛰어나 와이어, 튜브, 시트, 호일, 합금 등의 재료로 가장 선호되는 소재입니다. 또한 급속한 도시화와 세계 인프라 개발의 발전으로 전력망, 배관 설비, 건축자재에 대한 구리 수요가 크게 증가하고 있습니다.
| 조사 범위 | |
|---|---|
| 조사 대상 연도 | 2021-2035년 |
| 기준연도 | 2024년 |
| 예측 기간 | 2025-2030년 |
| 단위 | 금액(달러)·킬로톤 |
| 부문 | 유형, 최종사용자 산업, 용도, 지역 |
| 대상 지역 | 북미, 유럽, 아시아태평양, 중동 및 아프리카, 남미 |
동시에 전기자동차(EV), 재생에너지 시스템, 스마트 그리드의 채택이 가속화되면서 특히 배터리 및 충전 인프라를 위한 동선, 부스바, 동박 등에 새로운 기회가 창출되고 있습니다. 또한 전자 및 통신 분야의 성장도 수요를 더욱 증가시켜 PCB, 커넥터, 소형 전자 장치 등에서 구리는 필수적인 소재가 되었습니다. 또한 지속가능성과 순환 경제로의 전환에 따라 구리의 재활용이 주요 공급원으로 주목받고 있으며, 채굴에 대한 의존도를 낮추면서 증가하는 소비 수요에 대응하고 있습니다. 한편, 시장은 공급망의 불안정성, 생산시 높은 에너지 비용, 일부 용도에서 알루미늄 등 대체 소재와의 경쟁 등의 문제에 직면해 있습니다. 그럼에도 불구하고 청정에너지, 디지털화, 전기화에 대한 정부의 투자 확대가 지속되고 있으며, 구리 제품은 현대 사회의 인프라와 기술을 지원하는 핵심 소재로 자리매김하여 장기적이고 안정적인 시장 확대가 예상됩니다.
"제품별로는 동박 부문이 예측 기간 중 가장 높은 성장세를 보일 것으로 예측됩니다. "
동박은 첨단 기술 및 재생에너지 분야에서 중요한 역할을 하는 것을 배경으로 가장 빠르게 성장하는 제품 부문이 되었습니다. 전자 분야에서 동박은 PCB와 리튬이온 배터리에 필수적인 소재이며, 높은 전도성과 유연성으로 효율적인 에너지 전달과 컴팩트한 설계를 가능하게 합니다. 전기자동차(EV), 에너지 저장 시스템(ESS), CE 제품의 급속한 확대로 동박 수요가 크게 증가하고 있습니다. 또한 동박은 5G 인프라 및 첨단 통신 장비의 차폐재로도 활용이 확대되고 있으며, 전자기 간섭으로부터 보호에 기여하고 있습니다. 또한 경량성과 유연성으로 인해 플렉서블 일렉트로닉스 및 소형 전자기기에도 적합합니다. 전기화, 재생에너지 통합, 디지털화가 가속화됨에 따라 동박 시장은 앞으로 더욱 확대될 것으로 예측됩니다. 또한 전기자동차 배터리용으로 개발되고 있는 초박형 동박 등의 혁신도 진행되고 있으며, 동박은 차세대 기술에 필수적인 소재로서의 입지를 강화하고 있습니다.
"용도별로는 접지 부문이 예측 기간 중 가장 높은 성장률을 보일 것으로 예측됩니다. "
접지 부문은 주거, 상업, 산업 시설에서 전기 안전, 신뢰성, 법규 준수에 대한 중요성이 높아짐에 따라 가장 빠르게 성장할 것으로 예측됩니다. 구리는 높은 전기 전도성, 내식성, 내구성을 겸비하여 접지 시스템의 재료로 가장 우수한 선택입니다. 이를 통해 누전 및 단락 전류를 효과적으로 방산하여 설비 및 인명을 전기적 위험으로부터 보호합니다. 전 세계에서 도시화 및 스마트 시티 프로젝트가 진행됨에 따라 현대 건축, 데이터센터, 산업시설의 접지 솔루션 수요가 급증하고 있습니다. 또한 태양광, 풍력 등 재생에너지 설비 증가로 인해 안전하고 안정적인 접지시스템에 대한 요구도 확대되고 있습니다. 또한 전기자동차 충전 인프라 등 교통의 전기화도 성장 요인 중 하나이며, 안정적인 접지 연결은 운영상 필수적입니다. 각국 정부와 규제 당국도 안전 기준을 강화하고 있으며, 기업은 고품질 구리 접지 시스템을 도입하려는 움직임이 확산되고 있습니다. 이러한 요인들이 결합되어 접지 분야는 구리 제품 시장에서 가장 빠르게 성장하는 용도로 자리매김하고 있습니다.
"아시아태평양이 예측 기간 중 가장 빠르게 성장할 것으로 예상"
아시아태평양은 급속한 도시화, 산업화, 대규모 인프라 개발로 인해 가장 높은 성장률을 보일 것으로 예측됩니다. 특히 중국, 인도, 일본, 한국 등 주요 경제국에서는 전력망 확장, 재생에너지 프로젝트, 전기자동차(EV) 보급이 진행되면서 동선, 봉재, 동박 수요가 급증하고 있습니다. 또한 중국, 대만, 한국 등 전자기기 제조 거점에서는 반도체, PCB, CE 제품에 구리가 필수적이어서 소비 확대를 견인하고 있습니다. 또한 주택 건설 및 배관 프로젝트의 확대로 인해 구리 파이프와 튜브의 사용이 증가하고 있습니다. 정부 주도의 스마트그리드화, 전기화, 친환경 에너지 투자도 성장을 가속화하고 있으며, 아시아태평양은 생산 규모와 성장 속도를 겸비한 주요 시장으로 자리매김하고 있습니다.
세계의 구리 제품 시장을 조사했으며, 시장 개요, 시장 성장에 대한 각종 영향요인의 분석, 기술·특허의 동향, 법규제 환경, 사례 연구, 시장 규모 추이·예측, 각종 구분·지역/주요 국가별 상세 분석, 경쟁 구도, 주요 기업의 개요 등을 정리하여 전해드립니다.
자주 묻는 질문
목차
제1장 서론
제2장 조사 방법
제3장 개요
제4장 주요 인사이트
제5장 시장 개요
- 시장 역학
- 촉진요인
- 억제요인
- 기회
- 과제
- 구리 제품 시장에서 생성형 AI의 영향
제6장 업계 동향
- 고객 사업에 영향을 미치는 동향과 파괴적 변화
- 공급망 분석
- 미국의 2025년 관세
- 투자와 자금조달 시나리오
- 가격 분석
- 에코시스템 분석
- 기술 분석
- 특허 분석
- 무역 분석
- 주요 컨퍼런스와 이벤트
- 관세와 규제 상황
- Porter's Five Forces 분석
- 주요 이해관계자와 구입 기준
- 거시경제 전망
- 사례 연구 분석
제7장 구리 제품 시장 : 용도별
- 전도 용도
- 구조 용도
- 접지
- 실드
- 기타
- 해양
- 화학 처리
- 항균 용도
제8장 구리 제품 시장 : 제품별
- 바
- 와이어
- 로드
- 스트립
- 포일
- 튜브·파이프
- 합금 제품
- 개요
- 테이프
- 기타
- 플레이트
- 시트
제9장 구리 제품 시장 : 최종사용자 산업별
- 전력·송전
- 산업 기기·기계
- 야금·주조
- 일렉트로닉스
- 건축·건설
- 운송
- 배관
- 발전
- 기타
- 소비재
- 헬스케어
- 방위
제10장 구리 제품 시장 : 지역별
- 아시아태평양
- 중국
- 일본
- 인도
- 한국
- 기타
- 북미
- 미국
- 캐나다
- 멕시코
- 유럽
- 독일
- 이탈리아
- 프랑스
- 영국
- 스페인
- 기타
- 중동 및 아프리카
- GCC 국가
- 남아프리카공화국
- 기타
- 남미
- 아르헨티나
- 브라질
- 기타
제11장 경쟁 구도
- 주요 참여 기업의 전략/강점
- 시장 점유율 분석
- TOP 5사의 매출 분석
- 브랜드/제품 비교
- 기업 평가 매트릭스 : 주요 기업
- 기업 평가 매트릭스 : 스타트업/중소기업
- 기업 평가와 재무 지표
- 경쟁 시나리오
제12장 기업 개요
- 주요 기업
- MUELLER INDUSTRIES
- WIELAND GROUP
- HAILIANG GROUP
- KME GERMANY GMBH
- KGHM
- HINDALCO INDUSTRIES LTD.
- AURUBIS AG
- KOBE STEEL, LTD.
- MITSUBISHI MATERIALS CORPORATION
- NEXANS
- NINGBO JINTIAN COPPER(GROUP) CO., LTD.
- JIANGXI COPPER CORPORATION
- 기타 기업
- AVIVA METALS
- BARODA EXTRUSION LTD
- BHAGYANAGAR INDIA
- ELCOWIRE GROUP AB
- GUPTA METAL INDUSTRIES
- HINDUSTAN COPPER LIMITED
- INDIGO METALLOYS PVT.
- MADHAV COPPER
- MEHTA TUBES LTD.
- RAJSHREE METALS
- SHANGHAI METAL CORPORATION
- SOUTHWIRE COMPANY, LLC
- CUPORI
- HALCOR
- GOLDEN DRAGON PRECISE COPPER TUBE GROUP INC.
제13장 부록
KSA 25.11.12The copper products market is projected to grow from USD 375.47 billion in 2025 to USD 645.86 billion by 2035 at a CAGR of 5.6%. The copper products market is experiencing robust growth, driven by copper's indispensable role across the power, construction, electronics, automotive, and renewable energy industries. Its superior electrical and thermal conductivity, durability, and recyclability make it the preferred material for wires, tubes, sheets, foils, and alloys. Rapid urbanization and infrastructure development worldwide significantly boost the demand for copper in power grids, plumbing, and building materials.
| Scope of the Report | |
|---|---|
| Years Considered for the Study | 2021-2035 |
| Base Year | 2024 |
| Forecast Period | 2025-2030 |
| Units Considered | Value (USD Billion), Volume (Kiloton) |
| Segments | Type, End-Use Industry, Application, and Region |
| Regions covered | North America, Europe, Asia Pacific, Middle East & Africa, South America |
At the same time, the accelerating adoption of electric vehicles (EVs), renewable energy systems, and smart grids is unlocking new opportunities, particularly for copper wires, busbars, and foils in batteries and charging infrastructure. Electronics and telecommunication growth further strengthens demand, with copper vital for PCBs, connectors, and miniaturized devices. The shift toward sustainability and the circular economy has also made copper recycling a primary supply source, reducing dependence on mining while meeting rising consumption. However, the market faces challenges such as supply chain volatility, high energy costs in production, and competition from substitutes like aluminum in some applications. Despite these, strong government investments in clean energy, digitalization, and electrification continue to position copper products as critical enablers of modern infrastructure and technology, ensuring steady long-term market expansion.

"By product, the foils segment is projected to be the fastest-growing segment of the copper products market during the forecast period."
Foils are emerging as the fastest-growing product segment in the copper products market due to their critical role in high-tech and renewable applications. In electronics, copper foils are essential for printed circuit boards (PCBs) and lithium-ion batteries, where their high conductivity and flexibility enable efficient energy transfer and compact designs. The rapid expansion of electric vehicles (EVs), energy storage systems, and consumer electronics drives significant demand. Additionally, copper foils are increasingly used in shielding applications for 5G infrastructure and advanced communication devices, offering protection against electromagnetic interference. Their lightweight and adaptable properties are also suitable for flexible electronics and miniaturized devices. With the accelerating shift toward electrification, renewable integration, and digitalization, copper foils are expected to grow substantially. The segment also benefits from ongoing innovations in ultra-thin foils tailored for EV batteries, positioning it as a vital material in next-generation technologies.
"By application, earthing is projected to be the fastest-growing application segment in the copper products market during the forecast period."
The earthing segment is projected to be the fastest-growing application segment in the copper products market due to the rising emphasis on electrical safety, reliability, and regulatory compliance across residential, commercial, and industrial infrastructures. With its superior electrical conductivity, corrosion resistance, and durability, copper is the most preferred material for earthing systems. It ensures effective dissipation of fault currents and protects equipment and human life from electrical hazards. The growth of urbanization and smart city projects globally significantly boosts the demand for earthing solutions in modern buildings, data centers, and industrial complexes. Additionally, the rapid expansion of renewable energy installations, such as solar and wind farms, is accelerating the demand for efficient grounding systems, where copper is crucial in maintaining safety and system stability. The electrification of transportation, including electric vehicle (EV) charging infrastructure, further contributes to this growth, as reliable earthing is mandatory for uninterrupted operations. Governments and regulatory bodies are also tightening safety standards, compelling industries to adopt high-quality copper-based earthing systems. This combination of safety needs, infrastructure expansion, and renewable energy integration positions earthing as the fastest-growing application segment in the copper products market.
"By end-use industry, plumbing is projected to be the fastest-growing segment in the copper products market during the forecast period."
Plumbing is projected to be the fastest-growing end-use industry segment for the copper products market during the forecast period. This projection is inspired by copper's unique combination of durability, corrosion resistance, and antimicrobial properties. Copper pipes and tubes are widely preferred in plumbing systems for residential, commercial, and industrial buildings due to their long service life, resistance to scaling, and ability to withstand high pressure and temperature variations. Unlike plastic alternatives, copper does not degrade under UV light and offers proven reliability in hot and cold-water distribution systems. The rapid pace of urbanization and infrastructure development, especially in Asia Pacific, is a major growth driver, with large-scale housing projects, commercial complexes, and public utilities requiring reliable plumbing solutions. Growing awareness of water quality and hygiene also fuels the demand for copper, as its natural antimicrobial properties help prevent bacterial growth, ensuring safe water distribution. The trend toward green buildings and sustainable construction practices further boosts copper adoption, since it is 100% recyclable and aligns with environmental goals. In addition, the replacement of aging plumbing systems in developed regions like North America and Europe is creating steady demand for copper-based solutions. With rising investments in construction, modernization, and sustainable urban infrastructure, plumbing is set to remain the fastest-growing end-use industry segment for copper products.
"Asia Pacific is projected to be the fastest-growing regional market for copper products during the forecast period."
Asia Pacific is projected to be the fastest-growing market for copper products due to rapid urbanization, industrialization, and massive infrastructure development across key economies such as China, India, Japan, and South Korea. The region is witnessing a surging demand for copper wires, rods, and foils driven by the expansion of power transmission networks, renewable energy projects, and the widespread adoption of electric vehicles (EVs). Electronics manufacturing hubs in China, Taiwan, and South Korea heavily depend on copper for semiconductors, PCBs, and consumer electronics, further accelerating consumption. Additionally, large-scale construction and plumbing projects fueled by urban housing demand significantly increase the use of copper pipes and tubes. Government-backed investments in smart grids, electrification, and green energy add to this momentum. With its strong base of manufacturing industries, rising population, and ongoing infrastructure upgrades, Asia Pacific combines scale and speed.
Extensive primary interviews were conducted to determine and verify the market size for several segments and subsegments identified through secondary research.
A breakdown of the profiles of the primary interviewees is as follows:
- By Company Type: Tier 1 - 60%, Tier 2 - 25%, and Tier 3 - 15%
- By Designation: Directors - 20%, Managers - 30%, and Others - 50%
- By Region: North America - 20%, Europe - 30%, Asia Pacific - 30%, Middle East & Africa - 10%, and South America - 10%
Key players in the copper products market include Mueller Industries (US), Wieland Group (Germany), Hailiang Group (China), KME Group SpA (Italy), KGHM (Poland), Hindalco Industries Limited (India), Aurubis AG (Germany), Mitsubishi Materials Corporation (Japan), KOBE STEEL LTD. (Japan), Nexans (France), Ningbo Jintian Copper (Group) Co., Ltd. (China), and Jiangxi Copper Co., Ltd. (China).
Research Coverage
This report segments the market for copper products by product, application, end-use industry, and region. It provides estimations for the overall value of the market across various regions. A detailed analysis of key industry players has been conducted to provide insights into their business overviews, products & services, key strategies, product launches, expansions, and partnerships associated with the copper products market.
Key Benefits of Buying this Report
This research report focuses on various analysis levels: industry analysis (industry trends), market ranking analysis of top players, and company profiles. These levels provide an overall view of the competitive landscape, emerging and high-growth segments of the copper products market; high-growth regions; and market drivers, restraints, opportunities, and challenges.
The report provides insights into the following pointers:
- Analysis of Key Drivers and Opportunities: Key drivers include 100% recyclability of copper, reducing production costs, ensuring raw material stability, and aligning with sustainability goals and high consumption of copper in industries like construction and infrastructure. Key opportunities include rising adoption of AI, data centers, and cloud infrastructure, unlocking new opportunities, and rapid electric vehicle (EV) industry expansion.
- Analysis of key Restraints and Challenges: Key restraints include raw material availability & mining challenges, and availability of alternative materials like aluminum, polyethylene, and optical fiber, limiting growth. A key challenge to market growth would be a highly energy-intensive production process and supply chain constraints.
- Market Penetration: Comprehensive information on the copper products offered by top players in the global copper products market
- Product Development/Innovation: Detailed insights into upcoming technologies, research & development activities, and product launches in the copper products market
- Market Development: Comprehensive information about lucrative emerging markets across regions
- Market Diversification: Exhaustive information about products, untapped regions, and recent developments in the global copper products market
- Competitive Assessment: In-depth assessment of market share, strategies, products, and manufacturing capabilities of leading players in the copper products market
TABLE OF CONTENTS
1 INTRODUCTION
- 1.1 STUDY OBJECTIVES
- 1.2 MARKET DEFINITION
- 1.3 STUDY SCOPE
- 1.3.1 MARKET SEGMENTATION AND REGIONAL SCOPE
- 1.3.2 INCLUSIONS & EXCLUSIONS
- 1.4 YEARS CONSIDERED
- 1.5 CURRENCY CONSIDERED
- 1.6 UNITS CONSIDERED
- 1.7 RESEARCH LIMITATIONS
- 1.8 STAKEHOLDERS
2 RESEARCH METHODOLOGY
- 2.1 RESEARCH DATA
- 2.1.1 SECONDARY DATA
- 2.1.1.1 Key data from secondary sources
- 2.1.2 PRIMARY DATA
- 2.1.2.1 Key data from primary sources
- 2.1.2.2 Primary data sources
- 2.1.2.3 Key primary participants
- 2.1.2.4 Breakdown of interviews with experts
- 2.1.2.5 Key industry insights
- 2.1.1 SECONDARY DATA
- 2.2 BASE NUMBER CALCULATION
- 2.2.1 SUPPLY-SIDE APPROACH
- 2.2.2 DEMAND-SIDE APPROACH
- 2.3 FORECAST NUMBER CALCULATION
- 2.3.1 SUPPLY SIDE
- 2.3.2 DEMAND SIDE
- 2.4 MARKET SIZE ESTIMATION
- 2.4.1 BOTTOM-UP APPROACH
- 2.4.2 TOP-DOWN APPROACH
- 2.5 DATA TRIANGULATION
- 2.6 RESEARCH ASSUMPTIONS
- 2.7 GROWTH FORECAST
- 2.8 RISK ASSESSMENT
- 2.9 FACTOR ANALYSIS
- 2.9.1 INTRODUCTION
3 EXECUTIVE SUMMARY
4 PREMIUM INSIGHTS
- 4.1 ATTRACTIVE OPPORTUNITIES FOR PLAYERS IN COPPER PRODUCTS MARKET
- 4.2 COPPER PRODUCTS MARKET, BY PRODUCT
- 4.3 COPPER PRODUCTS MARKET, BY APPLICATION
- 4.4 COPPER PRODUCTS MARKET, BY END-USE INDUSTRY
- 4.5 COPPER PRODUCTS MARKET, BY COUNTRY
5 MARKET OVERVIEW
- 5.1 INTRODUCTION
- 5.2 MARKET DYNAMICS
- 5.2.1 DRIVERS
- 5.2.1.1 High consumption of copper for construction of infrastructure
- 5.2.1.2 Copper's 100% recyclability and exceptional performance
- 5.2.1.3 Industrialization and growing urbanization
- 5.2.2 RESTRAINTS
- 5.2.2.1 Limited raw material availability & mining challenges
- 5.2.2.2 Availability of alternative materials like aluminum, polyethylene, and optical fiber
- 5.2.3 OPPORTUNITIES
- 5.2.3.1 Rising adoption of AI, data centers, and cloud infrastructure
- 5.2.3.2 Rapid expansion of electric vehicle (EV) industry
- 5.2.4 CHALLENGES
- 5.2.4.1 High energy-intensive production process and supply chain challenges
- 5.2.1 DRIVERS
- 5.3 IMPACT OF GENERATIVE AI ON COPPER PRODUCTS MARKET
- 5.3.1 INTRODUCTION
- 5.3.2 CHEMICAL COMPANIES EMBRACING AI
- 5.3.3 ADOPTION OF GENERATIVE AI IN COPPER PRODUCTS MARKET
- 5.3.4 IMPACT OF GENERATIVE AI ON COPPER PRODUCTS MARKET
6 INDUSTRY TRENDS
- 6.1 INTRODUCTION
- 6.2 TRENDS & DISRUPTIONS IMPACTING CUSTOMER BUSINESS
- 6.3 SUPPLY CHAIN ANALYSIS
- 6.4 US 2025 TARIFF
- 6.4.1 INTRODUCTION
- 6.4.2 KEY TARIFF RATES
- 6.4.3 PRICE IMPACT ANALYSIS
- 6.4.4 IMPACT ON COUNTRY/REGION
- 6.4.4.1 North America
- 6.4.4.2 Europe
- 6.4.4.3 Asia Pacific
- 6.4.5 IMPACT ON END-USE INDUSTRIES
- 6.5 INVESTMENT & FUNDING SCENARIO
- 6.6 PRICING ANALYSIS
- 6.6.1 AVERAGE SELLING PRICE TREND, BY PRODUCT
- 6.6.2 AVERAGE SELLING PRICE OF KEY COPPER PRODUCTS, BY KEY PLAYER
- 6.6.3 AVERAGE SELLING PRICE TREND, BY REGION
- 6.7 ECOSYSTEM ANALYSIS
- 6.8 TECHNOLOGY ANALYSIS
- 6.8.1 KEY TECHNOLOGIES
- 6.8.2 COMPLEMENTARY TECHNOLOGIES
- 6.8.3 ADJACENT TECHNOLOGIES
- 6.9 PATENT ANALYSIS
- 6.9.1 METHODOLOGY
- 6.9.2 PATENTS GRANTED
- 6.9.3 INSIGHTS
- 6.9.4 LEGAL STATUS
- 6.9.5 JURISDICTION ANALYSIS
- 6.9.6 TOP APPLICANTS
- 6.10 TRADE ANALYSIS
- 6.10.1 IMPORT SCENARIO (HS CODE 740721)
- 6.10.2 EXPORT SCENARIO (HS CODE 740721)
- 6.10.3 IMPORT SCENARIO (HS CODE 740911)
- 6.10.4 EXPORT SCENARIO (HS CODE 740911)
- 6.10.5 IMPORT SCENARIO (HS CODE 741121)
- 6.10.6 EXPORT SCENARIO (HS CODE 741121)
- 6.10.7 IMPORT SCENARIO (HS CODE 740729)
- 6.10.8 EXPORT SCENARIO (HS CODE 740729)
- 6.10.9 IMPORT SCENARIO (HS CODE 741021)
- 6.10.10 EXPORT SCENARIO (HS CODE 741021)
- 6.11 KEY CONFERENCES & EVENTS
- 6.12 TARIFF AND REGULATORY LANDSCAPE
- 6.12.1 TARIFF ANALYSIS
- 6.12.2 REGULATORY BODIES, GOVERNMENT AGENCIES, AND OTHER ORGANIZATIONS
- 6.12.3 REGULATORY FRAMEWORK, BY REGION
- 6.13 PORTER'S FIVE FORCES ANALYSIS
- 6.13.1 THREAT FROM NEW ENTRANTS
- 6.13.2 THREAT FROM SUBSTITUTES
- 6.13.3 BARGAINING POWER OF SUPPLIERS
- 6.13.4 BARGAINING POWER OF BUYERS
- 6.13.5 INTENSITY OF COMPETITIVE RIVALRY
- 6.14 KEY STAKEHOLDERS & BUYING CRITERIA
- 6.14.1 KEY STAKEHOLDERS IN BUYING PROCESS
- 6.14.2 BUYING CRITERIA
- 6.15 MACROECONOMIC OUTLOOK
- 6.15.1 GLOBAL GDP TRENDS
- 6.16 CASE STUDY ANALYSIS
- 6.16.1 INSTALLATION OF COPPER TOUCH SURFACES IN MEJIRO DAY CARE CENTER
- 6.16.2 USE OF COPPER ALLOYS IN PUBLIC SPACES FOR ANTIMICROBIAL PROTECTION
- 6.16.3 IMPROVING HEAT PUMP SYSTEM PERFORMANCE THROUGH SMALL-DIAMETER COPPER TUBE AND DESIGN OPTIMIZATION
7 COPPER PRODUCTS MARKET, BY APPLICATION
- 7.1 INTRODUCTION
- 7.2 CONDUCTIVE USE
- 7.2.1 RISING GLOBAL ELECTRIFICATION AND EV PENETRATION TO DRIVE MARKET
- 7.3 STRUCTURAL USE
- 7.3.1 COPPER'S DURABILITY, RECYCLABILITY, AND AESTHETIC APPEAL TO BOOST ITS USE FOR SUSTAINABLE CONSTRUCTION AND INDUSTRIAL STRUCTURAL APPLICATIONS
- 7.4 EARTHING
- 7.4.1 EXPANDING ELECTRIFICATION AND RENEWABLE ENERGY PROJECTS TO BOOST DEMAND FOR COPPER IN RELIABLE EARTHING SYSTEMS
- 7.5 SHIELDING
- 7.5.1 EXPANSION OF 5G, IOT, AEROSPACE, AND MEDICAL ELECTRONICS TO DRIVE DEMAND FOR COPPER SHIELDING AGAINST EMI AND RFI
- 7.6 OTHER APPLICATIONS
- 7.6.1 MARINE
- 7.6.2 CHEMICAL PROCESSING
- 7.6.3 ANTIMICROBIAL APPLICATIONS
8 COPPER PRODUCTS MARKET, BY PRODUCT
- 8.1 INTRODUCTION
- 8.2 BARS
- 8.2.1 RISING DEMAND FROM ELECTRICAL INFRASTRUCTURE AND RENEWABLE ENERGY GRIDS TO SUSTAIN GROWTH
- 8.3 WIRES
- 8.3.1 GROWING ELECTRIFICATION, EV ADOPTION, AND RENEWABLE ENERGY PROJECTS TO BOOST DEMAND
- 8.4 RODS
- 8.4.1 INCREASING USE OF RODS AS FEEDSTOCK FOR WIRE AND CABLE PRODUCTION TO DRIVE CONSISTENT DEMAND
- 8.5 STRIPS
- 8.5.1 RISING DEMAND FROM RENEWABLE ENERGY AND ELECTRONICS INDUSTRIES TO ENHANCE USE OF COPPER STRIPS
- 8.6 FOILS
- 8.6.1 SURGE IN EV BATTERY PRODUCTION AND MINIATURIZED ELECTRONICS TO FUEL DEMAND
- 8.7 TUBES & PIPES
- 8.7.1 INCREASING CONSTRUCTION ACTIVITIES TO DRIVE CONSUMPTION OF COPPER TUBES AND PIPES
- 8.8 ALLOY PRODUCTS
- 8.8.1 DIVERSE APPLICATIONS ACROSS MARINE, AUTOMOTIVE, AND CONSTRUCTION SECTORS TO FUEL DEMAND
- 8.9 PROFILES
- 8.9.1 CUSTOMIZATION NEEDS IN ELECTRICAL SYSTEMS AND SUSTAINABLE CONSTRUCTION TO DRIVE MARKET
- 8.10 TAPES
- 8.10.1 GROWING USE OF COPPER TAPES FOR EMI/RFI SHIELDING TO BOOST MARKET
- 8.11 OTHER PRODUCTS
- 8.11.1 PLATES
- 8.11.2 SHEETS
9 COPPER PRODUCTS MARKET, BY END-USE INDUSTRY
- 9.1 INTRODUCTION
- 9.2 ELECTRICAL & POWER TRANSMISSION
- 9.2.1 GLOBAL ELECTRIFICATION INITIATIVES AND GRID MODERNIZATION TO DRIVE DEMAND FOR COPPER IN ELECTRICAL AND POWER TRANSMISSION
- 9.3 INDUSTRIAL EQUIPMENT & MACHINERY
- 9.3.1 RISING INDUSTRIAL AUTOMATION AND DEMAND FOR ENERGY-EFFICIENT MACHINERY TO BOOST USE OF COPPER IN INDUSTRIAL EQUIPMENT
- 9.4 METALLURGY & FOUNDRY
- 9.4.1 GROWING DEMAND FOR COPPER ALLOYS ACROSS AUTOMOTIVE, AEROSPACE, AND CONSTRUCTION INDUSTRIES TO SUPPORT USE OF COPPER
- 9.5 ELECTRONICS
- 9.5.1 PROLIFERATION OF 5G, IOT, AND ADVANCED ELECTRONICS TO DRIVE SUSTAINED DEMAND FOR COPPER
- 9.6 BUILDING & CONSTRUCTION
- 9.6.1 URBANIZATION, INFRASTRUCTURAL GROWTH, AND GREEN BUILDING INITIATIVES TO DRIVE MARKET
- 9.7 TRANSPORTATION
- 9.7.1 ELECTRIFICATION OF VEHICLES AND EXPANSION OF MODERN TRANSPORTATION INFRASTRUCTURE TO BOOST DEMAND
- 9.8 PLUMBING
- 9.8.1 GROWING URBAN INFRASTRUCTURE AND DEMAND FOR SAFE, DURABLE WATER AND HVAC SYSTEMS TO DRIVE DEMAND
- 9.9 POWER GENERATION
- 9.9.1 GLOBAL TRANSITION TO RENEWABLE ENERGY AND EFFICIENT POWER GENERATION TO DRIVE MARKET
- 9.10 OTHER END-USE INDUSTRIES
- 9.10.1 CONSUMER GOODS
- 9.10.2 HEALTHCARE
- 9.10.3 DEFENSE
10 COPPER PRODUCTS MARKET, BY REGION
- 10.1 INTRODUCTION
- 10.2 ASIA PACIFIC
- 10.2.1 CHINA
- 10.2.1.1 Rapid EV adoption, renewable energy expansion, and large-scale infrastructure development to drive market
- 10.2.2 JAPAN
- 10.2.2.1 Advancements in automotive market ecosystem to boost growth
- 10.2.3 INDIA
- 10.2.3.1 Increase in manufacturing of electronics and high infrastructure investments to drive market
- 10.2.4 SOUTH KOREA
- 10.2.4.1 Rapid EV electrification and manufacturing of high-performance semiconductors to drive market
- 10.2.5 REST OF ASIA PACIFIC
- 10.2.1 CHINA
- 10.3 NORTH AMERICA
- 10.3.1 US
- 10.3.1.1 Robust construction activity, thriving electronics sector, and ongoing power grid and renewable energy investments to drive market
- 10.3.2 CANADA
- 10.3.2.1 Steady growth in construction sector and significant investments in energy transition to boost growth
- 10.3.3 MEXICO
- 10.3.3.1 Rapid growth in EV sales and power, industrial, and infrastructure projects to boost market
- 10.3.1 US
- 10.4 EUROPE
- 10.4.1 GERMANY
- 10.4.1.1 Large-scale manufacturing and grid modernization to drive demand
- 10.4.2 ITALY
- 10.4.2.1 Large manufacturing cluster for machinery, electrical equipment, and automotive components to drive market
- 10.4.3 FRANCE
- 10.4.3.1 Transport electrification and government-led retrofitting programs to fuel demand for copper
- 10.4.4 UK
- 10.4.4.1 Rapid rollout of EV charging networks to underpin market growth
- 10.4.5 SPAIN
- 10.4.5.1 Expansion of renewable energy and EV production to boost demand for copper cables and components
- 10.4.6 REST OF EUROPE
- 10.4.1 GERMANY
- 10.5 MIDDLE EAST & AFRICA
- 10.5.1 GCC COUNTRIES
- 10.5.1.1 UAE
- 10.5.1.1.1 Expanding infrastructure and smart city projects to fuel demand
- 10.5.1.2 Saudi Arabia
- 10.5.1.2.1 Giga-projects like NEOM to intensify usage of copper in power, metallurgy, and desalination industries
- 10.5.1.3 Rest of GCC Countries
- 10.5.1.1 UAE
- 10.5.2 SOUTH AFRICA
- 10.5.2.1 Rising demand for copper for mining and infrastructure modernization programs to boost market
- 10.5.3 REST OF MIDDLE EAST & AFRICA
- 10.5.1 GCC COUNTRIES
- 10.6 SOUTH AMERICA
- 10.6.1 ARGENTINA
- 10.6.1.1 Rapid expansion in renewable energy to boost copper usage for housing and industrial development
- 10.6.2 BRAZIL
- 10.6.2.1 Expanding housing, automotive, and renewable energy projects backed by government infrastructure and clean energy programs to drive demand
- 10.6.3 REST OF SOUTH AMERICA
- 10.6.1 ARGENTINA
11 COMPETITIVE LANDSCAPE
- 11.1 INTRODUCTION
- 11.2 KEY PLAYER STRATEGIES/RIGHT TO WIN
- 11.3 MARKET SHARE ANALYSIS, 2024
- 11.4 REVENUE ANALYSIS OF TOP FIVE PLAYERS, 2020-2024
- 11.5 BRAND/PRODUCT COMPARISON
- 11.6 COMPANY EVALUATION MATRIX: KEY PLAYERS, 2024
- 11.6.1 STARS
- 11.6.2 EMERGING LEADERS
- 11.6.3 PERVASIVE PLAYERS
- 11.6.4 PARTICIPANTS
- 11.6.5 COMPANY FOOTPRINT: KEY PLAYERS, 2024
- 11.6.5.1 Company footprint
- 11.6.5.2 Region footprint
- 11.6.5.3 Product footprint
- 11.6.5.4 Application footprint
- 11.6.5.5 End-use industry footprint
- 11.7 COMPANY EVALUATION MATRIX: STARTUPS/SMES, 2024
- 11.7.1 PROGRESSIVE COMPANIES
- 11.7.2 RESPONSIVE COMPANIES
- 11.7.3 DYNAMIC COMPANIES
- 11.7.4 STARTING BLOCKS
- 11.7.5 COMPETITIVE BENCHMARKING: STARTUPS/SMES, 2024
- 11.7.5.1 Detailed list of key startups/SMEs, 2024
- 11.7.5.2 Competitive benchmarking of key startups/SMEs
- 11.8 COMPANY VALUATION AND FINANCIAL METRICS
- 11.9 COMPETITIVE SCENARIO
- 11.9.1 PRODUCT LAUNCHES
- 11.9.2 DEALS
- 11.9.3 EXPANSION
- 11.9.4 OTHER DEVELOPMENTS
12 COMPANY PROFILES
- 12.1 KEY PLAYERS
- 12.1.1 MUELLER INDUSTRIES
- 12.1.1.1 Business overview
- 12.1.1.2 Products/Solutions/Services offered
- 12.1.1.3 Recent developments
- 12.1.1.3.1 Deals
- 12.1.1.4 MnM view
- 12.1.1.4.1 Right to win
- 12.1.1.4.2 Strategic choices
- 12.1.1.4.3 Weaknesses and competitive threats
- 12.1.2 WIELAND GROUP
- 12.1.2.1 Business overview
- 12.1.2.2 Products/Solutions/Services offered
- 12.1.2.3 Recent developments
- 12.1.2.3.1 Product launches
- 12.1.2.3.2 Deals
- 12.1.2.3.3 Expansion
- 12.1.2.4 MnM view
- 12.1.2.4.1 Right to win
- 12.1.2.4.2 Strategic choices
- 12.1.2.4.3 Weaknesses and competitive threats
- 12.1.3 HAILIANG GROUP
- 12.1.3.1 Business overview
- 12.1.3.2 Products/Solutions/Services offered
- 12.1.3.3 Recent developments
- 12.1.3.3.1 Other developments
- 12.1.3.4 MnM view
- 12.1.3.4.1 Right to win
- 12.1.3.4.2 Strategic choices
- 12.1.3.4.3 Weaknesses and competitive threats
- 12.1.4 KME GERMANY GMBH
- 12.1.4.1 Business overview
- 12.1.4.2 Products/Solutions/Services offered
- 12.1.4.3 Recent developments
- 12.1.4.3.1 Deals
- 12.1.4.4 MnM view
- 12.1.4.4.1 Right to win
- 12.1.4.4.2 Strategic choices
- 12.1.4.4.3 Weaknesses and competitive threats
- 12.1.5 KGHM
- 12.1.5.1 Business overview
- 12.1.5.2 Products/Solutions/Services offered
- 12.1.5.3 Recent developments
- 12.1.5.3.1 Deals
- 12.1.5.3.2 Expansion
- 12.1.5.4 MnM view
- 12.1.5.4.1 Right to win
- 12.1.5.4.2 Strategic choices
- 12.1.5.4.3 Weaknesses and competitive threats
- 12.1.6 HINDALCO INDUSTRIES LTD.
- 12.1.6.1 Business overview
- 12.1.6.2 Products/Solutions/Services offered
- 12.1.6.3 Recent developments
- 12.1.6.3.1 Deals
- 12.1.6.3.2 Other developments
- 12.1.6.4 MnM view
- 12.1.6.4.1 Right to win
- 12.1.6.4.2 Strategic choices
- 12.1.6.4.3 Weaknesses and competitive threats
- 12.1.7 AURUBIS AG
- 12.1.7.1 Business overview
- 12.1.7.2 Products/Solutions/Services offered
- 12.1.7.3 Recent developments
- 12.1.7.3.1 Deals
- 12.1.7.3.2 Expansion
- 12.1.7.3.3 Other developments
- 12.1.7.4 MnM view
- 12.1.7.4.1 Right to win
- 12.1.7.4.2 Strategic choices
- 12.1.7.4.3 Weaknesses and competitive threats
- 12.1.8 KOBE STEEL, LTD.
- 12.1.8.1 Business overview
- 12.1.8.2 Products/Solutions/Services offered
- 12.1.8.3 Recent developments
- 12.1.8.3.1 Expansion
- 12.1.8.4 MnM view
- 12.1.8.4.1 Right to win
- 12.1.8.4.2 Strategic choices
- 12.1.8.4.3 Weaknesses and competitive threats
- 12.1.9 MITSUBISHI MATERIALS CORPORATION
- 12.1.9.1 Business overview
- 12.1.9.2 Products/Solutions/Services offered
- 12.1.9.3 Recent developments
- 12.1.9.3.1 Product launches
- 12.1.9.3.2 Deals
- 12.1.9.3.3 Expansion
- 12.1.9.4 MnM view
- 12.1.9.4.1 Right to win
- 12.1.9.4.2 Strategic choices
- 12.1.9.4.3 Weaknesses and competitive threats
- 12.1.10 NEXANS
- 12.1.10.1 Business overview
- 12.1.10.2 Products/Solutions/Services offered
- 12.1.10.3 Recent developments
- 12.1.10.3.1 Product launches
- 12.1.10.3.2 Deals
- 12.1.10.3.3 Other developments
- 12.1.10.4 MnM view
- 12.1.10.4.1 Right to win
- 12.1.10.4.2 Strategic choices
- 12.1.10.4.3 Weaknesses and competitive threats
- 12.1.11 NINGBO JINTIAN COPPER (GROUP) CO., LTD.
- 12.1.11.1 Business overview
- 12.1.11.2 Products/Solutions/Services offered
- 12.1.11.3 Recent developments
- 12.1.11.3.1 Expansion
- 12.1.11.3.2 Other developments
- 12.1.11.4 MnM view
- 12.1.11.4.1 Right to win
- 12.1.11.4.2 Strategic choices
- 12.1.11.4.3 Weaknesses and competitive threats
- 12.1.12 JIANGXI COPPER CORPORATION
- 12.1.12.1 Business overview
- 12.1.12.2 Products/Solutions/Services offered
- 12.1.12.3 Recent developments
- 12.1.12.3.1 Deals
- 12.1.12.3.2 Other developments
- 12.1.12.4 MnM view
- 12.1.12.4.1 Right to win
- 12.1.12.4.2 Strategic choices
- 12.1.12.4.3 Weaknesses and competitive threats
- 12.1.1 MUELLER INDUSTRIES
- 12.2 OTHER PLAYERS
- 12.2.1 AVIVA METALS
- 12.2.2 BARODA EXTRUSION LTD
- 12.2.3 BHAGYANAGAR INDIA
- 12.2.4 ELCOWIRE GROUP AB
- 12.2.5 GUPTA METAL INDUSTRIES
- 12.2.6 HINDUSTAN COPPER LIMITED
- 12.2.7 INDIGO METALLOYS PVT.
- 12.2.8 MADHAV COPPER
- 12.2.9 MEHTA TUBES LTD.
- 12.2.10 RAJSHREE METALS
- 12.2.11 SHANGHAI METAL CORPORATION
- 12.2.12 SOUTHWIRE COMPANY, LLC
- 12.2.13 CUPORI
- 12.2.14 HALCOR
- 12.2.15 GOLDEN DRAGON PRECISE COPPER TUBE GROUP INC.
13 APPENDIX
- 13.1 DISCUSSION GUIDE
- 13.2 KNOWLEDGESTORE: MARKETSANDMARKETS' SUBSCRIPTION PORTAL
- 13.3 CUSTOMIZATION OPTIONS
- 13.4 RELATED REPORTS
- 13.5 AUTHOR DETAILS