|
시장보고서
상품코드
1889162
고성능 굴절계 시장 : 유형, 연결성, 인터페이스 유형, 측정 원리, 온도 제어 시스템, 용도, 구성, 지역별High-end Refractometer Market By Type, Connectivity, Interface Type, Measurement Principle, Temperature Control System, Application, Configuration, Region - Global Forecast to 2032 |
||||||
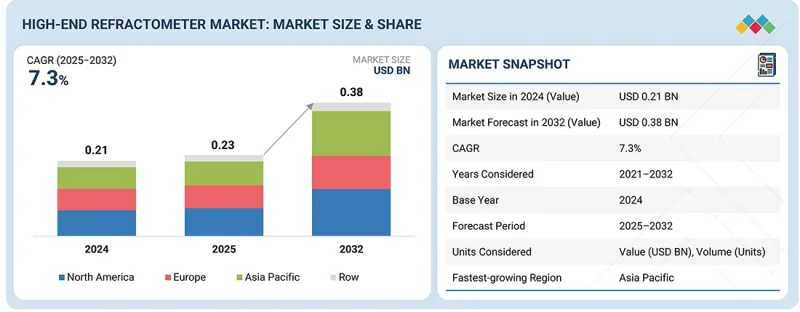
세계의 고성능 굴절계 시장의 규모는 예측 기간 동안 CAGR 7.3%로 성장하여 2025년 2억 3,000만 달러에서 2032년까지 3억 8,000만 달러에 이를 것으로 전망됩니다.
| 조사 범위 | |
|---|---|
| 조사 대상 기간 | 2020-2032년 |
| 기준연도 | 2024년 |
| 예측 기간 | 2025-2032년 |
| 단위 | 금액(달러) |
| 부문 | 유형별, 연결성별, 인터페이스 유형별, 지역별 |
| 대상 지역 | 북미, 유럽, 아시아태평양 및 기타 지역 |
이 성장은 주로 제약, 생명공학, 식품가공, 반도체, 특수화학 등의 분야에서 농도와 순도를 정밀하고 실시간으로 측정하고자 하는 요구 증가에 기인합니다. 게다가 IoT 대응 센서, 첨단 온도 보상 기술, 실시간 분석 기능의 통합으로 기존의 실험실 환경을 넘어 연속 제조 공정과 고정밀 화학 처리에 있어서의 고성능 굴절계의 응용 범위가 확대되고 있습니다.
"판매 채널별로 온라인 및 소매 부문이 예측 기간 동안 가장 빠르게 성장할 전망"
이러한 성장은 디지털 조달 전략으로의 현저한 전환, 전문적인 B2B 마켓플레이스에 대한 의존도 증가, 전자상거래 플랫폼을 통한 고성능 굴절계에 대한 접근성 향상으로 추진되고 있습니다. 제약, 생명공학, 식품가공, 특수화학 등 업계의 최종 사용자는 신속한 제품 비교, 투명한 가격 체계, 신속한 납기 등의 이점으로 온라인 채널에 집중되어 있습니다. 또한 제조업체가 운영하는 디지털 스토어 프론트의 증가와 종합적인 온라인 기술 문서가 도입을 더욱 촉진하고 예측 기간 동안 시장 성장의 중요한 추진력으로 온라인 및 소매 채널을 확립하고 있습니다.
"유형별로 인라인 프로세스 굴절계가 예측 기간 동안 가장 높은 성장률을 보여줄 전망"
인라인 프로세스 굴절계는 간헐적인 실험실 분석에서 품질 파라미터의 실시간 연속 모니터링으로의 전환을 배경으로 예측 기간 동안 가장 높은 CAGR을 나타낼 것으로 예측됩니다. 배관 및 반응기에서 직접 온도 보정된 농도 측정치를 즉시 제공하는 능력은 공정 제어를 강화하고 변동을 최소화할 수 있습니다. 이 기술은 제약, 생명공학, 식품가공, 반도체 제조 등 업계에서 견조한 채용이 진행되고 있으며 수요를 견인하고 있습니다. 디지털화의 진전과 연속 제조 환경에 있어서의 PAT(프로세스 분석 기술)의 도입이 가속하는 가운데, 인라인 굴절계는 엄격한 규제 적합 기준을 충족시키는 자동화 생산 공정를 확보하는 데 있어서 필수적인 존재가 되고 있습니다.
"지역별로는 아시아태평양이 2025년부터 2030년까지 가장 높은 CAGR을 기록할 전망"
아시아태평양은 급속한 산업화, 확대되는 제약 및 화학 생산, 식품 및 음료, 전자기기, 배터리 재료 산업에서의 견조한 성장에 힘입어 고성능 굴절계 시장에서 가장 급속도로 성장하고 있습니다. 중국, 일본, 인도, 한국 등의 국가들은 고정밀 연구소 인프라에 대한 투자 증가와 품질 관리 프로세스의 현대화의 혜택으로 주요 수요 견인 역할을 하고 있습니다. 이들 국가들은 고성능 QC 시설, ISO 준수 연구소, 첨단 연구센터에 대한 투자를 추진하고 있으며, 견고한 성능, 네트워크 연결성 및 검증 지원 소프트웨어를 갖춘 장비에 대한 수요를 촉진하고 있습니다. 제조업체가 생산 규모를 확대하고 수출 품질 기준을 강화하며 실시간 감시 기법을 채택함에 따라 아시아태평양은 세계의 고성능 굴절계 시장의 전략적 촉진요인으로 계속 상승하고 있습니다.
본 보고서에서는 세계의 고성능 굴절계 시장을 조사했으며, 시장 개요, 시장 성장에 대한 각종 영향요인 분석, 기술 및 특허 동향, 법적 규제 환경, 사례 연구, 시장의 규모의 추이와 예측, 지역 및 주요 국가별 각종 구분 및 상세 분석, 경쟁 구도, 주요 기업 프로파일 등을 정리했습니다.
자주 묻는 질문
목차
제1장 서론
제2장 조사 방법
제3장 주요 요약
제4장 중요 인사이트
제5장 시장 개요
- 시장 역학
- 성장 촉진요인
- 억제요인
- 기회
- 과제
- 관련 시장 및 이업종과의 분야 횡단적 기회
- Tier 1, 2, 3 기업의 전략적 움직임
제6장 업계 동향
- Porter's Five Forces 분석
- 거시경제지표
- 밸류체인 분석
- 생태계 분석
- 가격 분석
- 무역 분석
- 2025-2026년 주요 회의 및 이벤트
- 고객의 비즈니스에 영향을 미치는 동향 및 혁신
- 투자 및 자금조달 시나리오
- 사례 연구 분석
- 2025년 미국 관세의 영향 - 개요
제7장 시장 개요
- 규제 상황
제8장 전략적 혁신, 특허, 디지털 및 AI 도입
- 주요 신기술
- AI 기반 분석에 의한 이미지 굴절 측정
- 다파장 및 풀스펙트럼 굴절률 측정
- 고급 공정 제어(APC)를 갖춘 인라인 굴절계
- 보완적 기술
- 온도 제어 및 정밀 온도 조절 시스템
- 분광 플랫폼(UV-VIS, NIR, 라만, FTIR)
- 기술 및 제품 로드맵
- 특허 분석
- AI 및 생성형 AI가 고성능 굴절계 시장에 미치는 영향
제9장 고객정세와 구매행동
- 의사결정 프로세스
- 주요 이해관계자와 구매평가기준
- 채용 장벽과 내부 과제
- 다양한 분야로부터의 미충족 요구
제10장 고급 기능과 기술
- 소프트웨어 통합 및 데이터 관리
- 자동화와 원격 감시
- 다파장 및 스펙트럼 분석 기능
제11장 교정, 검증, 추적성 세분화
- 교정액과 인정 표준
- 교정 빈도와 현장 교정과 실험실 교정 워크플로
- 온보드 셀프 체크 및 검증 기능
- 산업용 규제 문서
- 타사 교정 서비스 제공업체 및 모바일 교정 실험실
제12장 고성능 굴절계의 각종 컴포넌트
- 프리즘 소재(사파이어 vs 유리)
- 광원(LED vs 레이저)
- 검출기(포토다이오드/CCD)
- 온도 센서(PT100)
- 신호 처리 장치 및 인클로저(스테인레스 스틸 316L)
- 씰(EPDM/FFKM)
- 위생기구
제13장 디지털 전환과 인더스트리 4.0의 통합
- 스마트 굴절계와 IoT 연결
- 클라우드 기반 데이터 관리
- 빅데이터 분석과 예측적 통찰
- 실험실 정보 관리 시스템(LIMS)과의 통합
- 전자 랩 노트 ELN 통합
- 원격 감시 및 제어
- 사이버 보안 고려 사항
- 디지털 트윈 기술
- 트레이닝과 유지보수를 위한 증강현실
- 모바일 애플리케이션 및 원격 액세스
제14장 고성능 굴절계 시장 : 자동화 레벨별
- 전자동 굴절계
- 반자동 굴절계
- 수동 샘플 투입 및 자동 측정
- 자동화와 제어의 균형
- 수동 고정밀 굴절계
제15장 고성능 굴절계 시장 : 구성별
- 벤치탑형
- 휴대용 및 핸드헬드형
- 하이브리드 및 모듈형
제16장 고성능 굴절계 시장 : 연결성별
- USB 연결
- 이더넷 및 LAN 연결
- 무선 연결
- WI-FI
- 블루투스
- RS-232 및 RS-485 시리얼 통신
제17장 고성능 굴절계 시장 : 인터페이스 유형별
- 터치스크린 디지털 디스플레이
- 물리적 컨트롤을 갖춘 디지털 디스플레이
- 아날로그 디스플레이
- PC 제어 시스템
- 모바일 앱 통합
제18장 고성능 굴절계 시장 : 측정 원리별
- 임계각법
- 간섭법에 근거한 굴절률 측정
- 광편향법
- 프레넬 반사법
제19장 고성능 굴절계 시장 : 판매 채널별
- 직접 판매
- 유통업체와 인테그레이터
- OEM 공급
- 온라인 및 소매
제20장 고성능 굴절계 시장 : 용도별
- 의약품 품질 관리
- 식품 및 음료 품질 시험
- 화학 조성 분석
- 석유 및 석유화학시험
- 학술연구
- 임상 및 의료 진단
- 보석 및 귀금속의 시험
- 정유 및 향료 시험
- 폴리머 및 플라스틱
- 페인트 및 코팅, 잉크
- 기타
제21장 고성능 굴절계 시장 : 유형별
- 아베 굴절계
- 디지털 핸드헬드 굴절계
- 자동 디지털 굴절계
- 인라인 프로세스 굴절계
- 실험실용 벤치 굴절계
- 다파장 굴절계
- 차동 굴절계
- 이미징 굴절계
제22장 고성능 굴절계 시장 : 지역별
- 북미
- 미국
- 캐나다
- 멕시코
- 유럽
- 독일
- 프랑스
- 영국
- 스페인
- 이탈리아
- 폴란드
- 북유럽
- 기타
- 아시아태평양
- 중국
- 일본
- 인도
- 한국
- 호주
- 기타
- 기타 세계 지역
- 중동
- 남미
- 아프리카
제23장 경쟁 구도
- 개요
- 주요 진입기업의 전략 및 강점
- 시장 점유율 분석
- 수익 분석
- 기업평가와 재무지표
- 브랜드 비교
- 기업평가 매트릭스 : 주요 기업
- 기업평가 매트릭스 : 스타트업 및 중소기업
- 경쟁 시나리오
제24장 기업 프로파일
- 주요 기업
- ANTON PAAR GMBH
- METTLER TOLEDO
- ATAGO CO., LTD.
- VAISALA
- REICHERT, INC.
- RUDOLPH RESEARCH ANALYTICAL
- A. KRUSS OPTRONIC GMBH
- HANNA INSTRUMENTS, INC.
- KYOTO ELECTRONICS MANUFACTURING CO., LTD.
- XYLEM ANALYTICS GERMANY SALES GMBH & CO. KG
- 기타 기업
- MISCO REFRACTOMETER
- THERMO FISHER SCIENTIFIC INC
- SHIMADZU CORPORATION
- XYLEM
- FUZHOU LINDIAN TECHNOLOGY DEVELOPMENT CO., LTD.
- KERN & SOHN GMBH
- MILWAUKEE INSTRUMENTS, INC.
- JP SELECTA SA
- SCHMIDT HAENSCH
- WATERS CORPORATION
- EMERSON ELECTRIC CO.
- MASELLI MISURE SPA
- VEE GEE SCIENTIFIC
- LAZAR SCIENTIFIC, INC.
- SPER SCIENTIFIC
- HM DIGITAL
제25장 부록
CSM 25.12.23The global high-end refractometer market is projected to grow from USD 0.23 billion in 2025 to USD 0.38 billion by 2032 at a CAGR of 7.3% during the forecast period.
| Scope of the Report | |
|---|---|
| Years Considered for the Study | 2020-2032 |
| Base Year | 2024 |
| Forecast Period | 2025-2032 |
| Units Considered | Value (USD Billion) |
| Segments | By Type, connectivity, interface type, and region |
| Regions covered | North America, Europe, APAC, RoW |
The growth can be largely attributed to the increasing need for precise, real-time measurements of concentration and purity in sectors such as pharmaceuticals, biotechnology, food processing, semiconductors, and specialty chemicals. Furthermore, the incorporation of IoT-enabled sensors, sophisticated temperature compensation techniques, and real-time analytics is facilitating the expanded application of high-performance refractometers in continuous manufacturing processes and high-precision chemical processing, moving beyond conventional laboratory environments.
"The online/retail segment is projected to be the fastest-growing sales channel during the forecast period."
The online/retail segment is projected to emerge as the fastest-growing channel in the high-end refractometer market. This growth is driven by a pronounced shift toward digital procurement strategies, an increasing dependence on specialized B2B marketplaces, and enhanced access to advanced refractometers via e-commerce platforms. End users in industries such as pharmaceuticals, biotechnology, food processing, and specialty chemicals are gravitating towards online channels due to the advantages of rapid product comparison, transparent pricing structures, and expedited delivery times. Moreover, the growing presence of manufacturer-operated digital storefronts, along with comprehensive online technical documentation, is further catalyzing adoption, establishing the online/retail channel as a pivotal driver of market growth during the forecast period.
"The inline process refractometer is projected to be the fastest-growing type during the forecast period."
Inline process refractometers are projected to exhibit the highest CAGR during the forecast period, driven by a transition from intermittent laboratory analyses to real-time, continuous monitoring of quality parameters. Their capability to provide immediate, temperature-compensated concentration metrics directly within pipelines and reactors facilitates enhanced process control and minimizes variability. This technology is witnessing robust adoption across industries such as pharmaceuticals, biotechnology, food processing, and semiconductor manufacturing, thereby fueling demand. With the increasing momentum of digitalization and the implementation of PAT in continuous manufacturing environments, inline refractometers are becoming indispensable for ensuring automated production processes that meet stringent regulatory compliance standards.
"The Asia Pacific is projected to register the highest CAGR in the high-end refractometer market between 2025 and 2030."
The Asia Pacific is the fastest-growing high-end refractometer market, supported by rapid industrialization, expanding pharmaceutical and chemical production, and strong growth across food & beverage, electronics, and battery material industries. Countries such as China, Japan, India, and South Korea serve as major demand drivers, benefiting from rising investments in high-precision laboratory infrastructure and the modernization of quality-control processes. These countries are investing in upgraded QC facilities, ISO-compliant laboratories, and advanced research centers, fueling demand for instruments with robust performance, network connectivity, and validation-ready software. As manufacturers scale production, enhance export quality standards, and adopt real-time monitoring practices, the Asia Pacific continues to emerge as a strategic growth driver for the global high-end refractometer market.
Extensive primary interviews were conducted with key industry experts in the high-end refractometer market space to determine and verify the market size for various segments and subsegments gathered through secondary research.
The breakdown of primary participants for the report is shown below.
- By Company Type: Tier 1 - 20%, Tier 2 - 45%, Tier 3 - 35%
- By Designation: C-level Executives - 35%, Directors - 25%, Others - 40%
- By Reion: North America - 20%, Europe - 25%, Asia Pacific - 25%, RoW - 10%
The high-end refractometer market is dominated by globally established players, such as Anton Paar GmbH (Austria), METTLER TOLEDO (US), Vaisala (Finland), ATAGO Co., Ltd. (Japan), Reichert, Inc. (US), Rudolph Research Analytical (US), Xylem Analytics Germany Sales GmbH & Co. KG (US), A. KRUSS Optronic GmbH (Germany), and Hanna Instruments, Inc. (US). The study includes an in-depth competitive analysis of these key players in the market, with their company profiles, recent developments, and key market strategies.
Study Coverage:
The report segments the high-end refractometer market and forecasts its size by type, automation level, sales channel, connectivity, interface type, measurement principle, temperature control system, application, configuration, and region.
The report discusses the market's drivers, restraints, opportunities, and challenges, and provides a detailed view of the market across North America, Europe, Asia Pacific, and the Rest of the World. It includes a value chain analysis of the key players and their competitive analysis in the high-end refractometer market ecosystem.
Key Benefits of Buying the Report:
- Analysis of key drivers (rising demand for ultra-precise concentration and purity measurement across pharmaceuticals and biotechnology industries; shift toward automation and digitalization of quality inspection in food, beverage, and industrial production), restraints (high initial cost and complex system integration; availability of alternative analytical technologies), opportunities (increasing transition toward inline and real-time concentration monitoring; product innovation around AI-based calibration and predictive measurement) challenges (precision stability under varying industrial conditions; standardization of measurement protocols across industries)
- Product Development/Innovation: Detailed insights into upcoming technologies, research and development activities, and product launches in the high-end refractometer market
- Market Development: Comprehensive information about lucrative markets across varied regions
- Market Diversification: Exhaustive information about new products, untapped geographies, recent developments, and investments in the high-end refractometer market
- Competitive Assessment: In-depth assessment of market share, growth strategies, and product offerings of leading players such as Anton Paar GmbH (Austria), METTLER TOLEDO (US), Vaisala (Finland), ATAGO Co., Ltd. (Japan), Reichert, Inc. (US), Rudolph Research Analytical (US), Xylem Analytics Germany Sales GmbH & Co. KG (US), A. KRUSS Optronic GmbH (Germany), and Hanna Instruments, Inc. (US)
TABLE OF CONTENTS
1 INTRODUCTION
- 1.1 STUDY OBJECTIVES
- 1.2 MARKET DEFINITION
- 1.3 STUDY SCOPE
- 1.3.1 MARKETS COVERED
- 1.3.2 INCLUSIONS AND EXCLUSIONS
- 1.3.3 YEARS CONSIDERED
- 1.4 CURRENCY CONSIDERED
- 1.5 LIMITATIONS
- 1.6 STAKEHOLDERS
2 RESEARCH METHODOLOGY
- 2.1 INTRODUCTION
- 2.2 RESEARCH DATA
- 2.2.1 SECONDARY DATA
- 2.2.1.1 List of major secondary sources
- 2.2.1.2 Key data from secondary sources
- 2.2.2 PRIMARY DATA
- 2.2.2.1 List of primary interview participants
- 2.2.2.2 Breakdown of primary interviews
- 2.2.2.3 Key data from primary sources
- 2.2.2.4 Key industry insights
- 2.2.1 SECONDARY DATA
- 2.3 FACTOR ANALYSIS
- 2.3.1 SUPPLY-SIDE ANALYSIS
- 2.3.2 DEMAND-SIDE ANALYSIS
- 2.4 MARKET SIZE ESTIMATION
- 2.4.1 BOTTOM-UP APPROACH
- 2.4.1.1 Approach to arrive at market size using bottom-up approach (demand side)
- 2.4.2 TOP-DOWN APPROACH
- 2.4.2.1 Approach to arrive at market size using top-down approach (supply side)
- 2.4.1 BOTTOM-UP APPROACH
- 2.5 DATA TRIANGULATION
- 2.6 RESEARCH ASSUMPTIONS
- 2.7 RESEARCH LIMITATIONS
- 2.8 RISK ANALYSIS
3 EXECUTIVE SUMMARY
- 3.1 KEY INSIGHTS AND MARKET HIGHLIGHTS
- 3.2 KEY MARKET PARTICIPANTS: INSIGHTS AND STRATEGIC DEVELOPMENTS
- 3.3 DISRUPTIVE TRENDS SHAPING MARKET
- 3.4 HIGH-GROWTH SEGMENTS AND EMERGING FRONTIERS
- 3.5 SNAPSHOT: GLOBAL MARKET SIZE, GROWTH RATE, AND FORECAST
4 PREMIUM INSIGHTS
- 4.1 ATTRACTIVE OPPORTUNITIES FOR PLAYERS IN HIGH-END REFRACTOMETER MARKET
- 4.2 HIGH-END REFRACTOMETER MARKET, BY AUTOMATION LEVEL
- 4.3 HIGH-END REFRACTOMETER MARKET, BY APPLICATION
- 4.4 HIGH-END REFRACTOMETER MARKET IN NORTH AMERICA, BY COUNTRY
- 4.5 HIGH-END REFRACTOMETER MARKET, BY GEOGRAPHY
5 MARKET OVERVIEW
- 5.1 INTRODUCTION
- 5.2 MARKET DYNAMICS
- 5.2.1 DRIVERS
- 5.2.1.1 Rising demand for ultra-precise concentration and purity measurement across pharmaceuticals and biotechnology industries
- 5.2.1.2 Shift toward automation and digitalization of quality inspection in food, beverage, and industrial production
- 5.2.1.3 Strong adoption in semiconductor, battery electrolyte, and chemical process monitoring
- 5.2.2 RESTRAINTS
- 5.2.2.1 High initial cost and complex system integration
- 5.2.2.2 Availability of alternative analytical technologies
- 5.2.3 OPPORTUNITIES
- 5.2.3.1 Increasing transition toward inline and real-time concentration monitoring
- 5.2.3.2 Product innovation around AI-based calibration and predictive measurement
- 5.2.4 CHALLENGES
- 5.2.4.1 Precision stability under varying industrial conditions
- 5.2.4.2 Standardization of measurement protocols across industries
- 5.2.1 DRIVERS
- 5.3 INTERCONNECTED MARKETS AND CROSS-SECTOR OPPORTUNITIES
- 5.4 STRATEGIC MOVES BY TIER 1/2/3 PLAYERS
6 INDUSTRY TRENDS
- 6.1 PORTER'S FIVE FORCES ANALYSIS
- 6.1.1 THREAT OF NEW ENTRANTS
- 6.1.2 THREAT OF SUBSTITUTES
- 6.1.3 BARGAINING POWER OF SUPPLIERS
- 6.1.4 BARGAINING POWER OF BUYERS
- 6.1.5 INTENSITY OF COMPETITIVE RIVALRY
- 6.2 MACROECONOMIC INDICATORS
- 6.2.1 INTRODUCTION
- 6.2.2 GDP TRENDS AND FORECAST
- 6.2.3 TRENDS IN POWER AND ENERGY SECTOR
- 6.3 VALUE CHAIN ANALYSIS
- 6.4 ECOSYSTEM ANALYSIS
- 6.5 PRICING ANALYSIS
- 6.5.1 PRICING RANGE OF HIGH-END REFRACTOMETERS PROVIDED BY KEY PLAYERS, BY TYPE, 2024
- 6.5.2 AVERAGE SELLING PRICE TREND OF HIGH-END REFRACTOMETERS, BY TYPE, 2021-2024
- 6.5.3 PRICING RANGE OF ABBE REFRACTOMETERS, BY REGION
- 6.6 TRADE ANALYSIS
- 6.6.1 IMPORT SCENARIO (HS CODE 9027)
- 6.6.2 EXPORT SCENARIO (HS CODE 9027)
- 6.7 KEY CONFERENCES AND EVENTS, 2025-2026
- 6.8 TRENDS/DISRUPTIONS IMPACTING CUSTOMER BUSINESS
- 6.9 INVESTMENT AND FUNDING SCENARIO
- 6.10 CASE STUDY ANALYSIS
- 6.10.1 NESTLE DEPLOYED VAISALA INLINE REFRACTOMETERS FOR CONTINUOUS BRIX CONTROL IN JUICE & DAIRY PRODUCTION
- 6.10.2 PFIZER INTEGRATED ANTON PAAR HIGH-PRECISION REFRACTOMETERS FOR API PURITY & BUFFER PREPARATION
- 6.10.3 COCA-COLA UTILIZED SCHMIDT + HAENSCH INLINE REFRACTOMETERS FOR SYRUP STANDARDIZATION
- 6.10.4 TSMC ADOPTED METTLER TOLEDO INLINE REFRACTOMETERS FOR CMP SLURRY & PHOTORESIST CONTROL
- 6.10.5 BASF USED ATAGO HIGH-RANGE DIGITAL REFRACTOMETERS FOR RESIN & SOLVENT QUALITY CONTROL
- 6.10.6 MONDELEZ INTERNATIONAL DEPLOYED RUDOLPH RESEARCH ANALYTICAL REFRACTOMETERS FOR CONFECTIONERY CONTROL
- 6.11 IMPACT OF 2025 US TARIFFS - OVERVIEW
- 6.11.1 INTRODUCTION
- 6.11.2 KEY TARIFF RATES
- 6.11.3 PRICE IMPACT ANALYSIS
- 6.11.4 IMPACT ON COUNTRIES/REGIONS
- 6.11.4.1 US
- 6.11.4.2 Europe
- 6.11.4.3 Asia Pacific
- 6.11.5 IMPACT ON END-USE INDUSTRIES
7 MARKET OVERVIEW
- 7.1 REGULATORY LANDSCAPE
- 7.1.1 REGULATORY BODIES, GOVERNMENT AGENCIES, AND OTHER ORGANIZATIONS
- 7.1.2 STANDARDS
8 STRATEGIC DISRUPTIONS, PATENTS, AND DIGITAL AND AI ADOPTION
- 8.1 KEY EMERGING TECHNOLOGIES
- 8.1.1 IMAGING REFRACTOMETRY WITH AI-BASED ANALYSIS
- 8.1.2 MULTI-WAVELENGTH AND FULL-SPECTRUM REFRACTOMETRY
- 8.1.3 INLINE REFRACTOMETERS WITH ADVANCED PROCESS CONTROL (APC)
- 8.2 COMPLEMENTARY TECHNOLOGIES
- 8.2.1 TEMPERATURE CONTROL AND PRECISION THERMOSTATING SYSTEMS
- 8.2.2 SPECTROSCOPY PLATFORMS (UV-VIS, NIR, RAMAN, FTIR)
- 8.3 TECHNOLOGY/PRODUCT ROADMAP
- 8.4 PATENT ANALYSIS
- 8.5 IMPACT OF AI/GEN AI ON HIGH-END REFRACTOMETER MARKET
9 CUSTOMER LANDSCAPE & BUYER BEHAVIOR
- 9.1 DECISION-MAKING PROCESS
- 9.2 KEY STAKEHOLDERS AND BUYING EVALUATION CRITERIA
- 9.2.1 KEY STAKEHOLDERS IN BUYING PROCESS
- 9.2.2 BUYING CRITERIA
- 9.3 ADOPTION BARRIERS & INTERNAL CHALLENGES
- 9.4 UNMET NEEDS FROM VARIOUS APPLICATIONS
10 ADVANCED FEATURES & TECHNOLOGIES
- 10.1 INTRODUCTION
- 10.2 SOFTWARE INTEGRATION AND DATA MANAGEMENT
- 10.3 AUTOMATION AND REMOTE MONITORING
- 10.4 MULTI-WAVELENGTH AND SPECTRAL ANALYSIS CAPABILITIES
11 CALIBRATION, VALIDATION, AND TRACEABILITY SEGMENTATION
- 11.1 INTRODUCTION
- 11.2 CALIBRATION LIQUIDS AND CERTIFIED STANDARDS
- 11.3 CALIBRATION FREQUENCY AND FIELD VS. LABORATORY CALIBRATION WORKFLOWS
- 11.4 ONBOARD SELF-CHECK AND VALIDATION FEATURES
- 11.5 DOCUMENTATION FOR REGULATED INDUSTRIES
- 11.6 THIRD-PARTY CALIBRATION SERVICE PROVIDERS AND MOBILE CALIBRATION LABS
12 DIFFERENT COMPONENTS OF HIGH-END REFRACTOMETERS
- 12.1 INTRODUCTION
- 12.2 PRISM MATERIAL (SAPPHIRE VS. GLASS)
- 12.3 LIGHT SOURCES (LED VS. LASER)
- 12.4 DETECTORS (PHOTODIODE/CCD)
- 12.5 TEMPERATURE SENSORS (PT100)
- 12.6 SIGNAL PROCESSORS AND ENCLOSURES (STAINLESS STEEL 316L)
- 12.7 SEALS (EPDM / FFKM)
- 12.8 SANITARY FITTINGS
13 DIGITAL TRANSFORMATION & INDUSTRY 4.0 INTEGRATION
- 13.1 INTRODUCTION
- 13.2 SMART REFRACTOMETERS AND IOT CONNECTIVITY
- 13.3 CLOUD-BASED DATA MANAGEMENT
- 13.4 BIG DATA ANALYTICS AND PREDICTIVE INSIGHTS
- 13.5 INTEGRATION WITH LABORATORY INFORMATION MANAGEMENT SYSTEMS (LIMS)
- 13.6 ELECTRONIC LABORATORY NOTEBOOK ELN INTEGRATION
- 13.7 REMOTE MONITORING AND CONTROL
- 13.8 CYBERSECURITY CONSIDERATIONS
- 13.9 DIGITAL TWIN TECHNOLOGY
- 13.10 AUGMENTED REALITY FOR TRAINING AND MAINTENANCE
- 13.11 MOBILE APPLICATIONS AND REMOTE ACCESS
14 HIGH-END REFRACTOMETER MARKET, BY AUTOMATION LEVEL
- 14.1 INTRODUCTION
- 14.2 FULLY AUTOMATIC REFRACTOMETER
- 14.2.1 RISING ADOPTION OF FULLY AUTOMATED OPTICAL SYSTEMS TO PROPEL DEMAND
- 14.3 SEMI-AUTOMATIC REFRACTOMETER
- 14.3.1 IDEAL FOR COMPLEX OR EXPERIMENTAL WORKFLOWS WHERE FLEXIBILITY IS CRUCIAL
- 14.3.2 MANUAL SAMPLE LOADING WITH AUTOMATIC MEASUREMENT
- 14.3.3 BALANCE OF AUTOMATION & CONTROL
- 14.4 MANUAL HIGH-PRECISION REFRACTOMETER
- 14.4.1 RISING RELIANCE ON ULTRA-ACCURATE MANUAL INSTRUMENTS TO DRIVE DEMAND
15 HIGH-END REFRACTOMETER MARKET, BY CONFIGURATION
- 15.1 INTRODUCTION
- 15.2 BENCHTOP CONFIGURATION
- 15.2.1 GROWING PREFERENCE FOR PRECISION-CENTRIC LAB INSTRUMENTS TO DRIVE GROWTH
- 15.3 PORTABLE/HANDHELD HIGH-ACCURACY CONFIGURATION
- 15.3.1 RISING ADOPTION OF COMPACT HIGH-ACCURACY TOOLS TO DRIVE GROWTH
- 15.4 HYBRID AND MODULAR CONFIGURATIONS
- 15.4.1 GROWING SHIFT TOWARD FLEXIBLE SYSTEM ARCHITECTURES TO DRIVE DEMAND
16 HIGH-END REFRACTOMETER MARKET, BY CONNECTIVITY
- 16.1 INTRODUCTION
- 16.2 USB CONNECTIVITY
- 16.2.1 GROWING USE OF DIRECT DATA TRANSFER INTERFACES TO DRIVE DEMAND
- 16.3 ETHERNET/LAN CONNECTIVITY
- 16.3.1 RISING NEED FOR NETWORK-READY ANALYTICAL INSTRUMENTS TO DRIVE DEMAND
- 16.4 WIRELESS CONNECTIVITY
- 16.4.1 WI-FI
- 16.4.1.1 Rising deployment of Wi-Fi-enabled smart laboratories to drive demand
- 16.4.2 BLUETOOTH
- 16.4.2.1 Growing preference for short-range wireless data exchange to drive demand
- 16.4.1 WI-FI
- 16.5 RS-232/RS-485 SERIAL COMMUNICATION.
- 16.5.1 RISING ADOPTION OF INDUSTRIAL COMMUNICATION STANDARDS TO DRIVE DEMAND
17 HIGH-END REFRACTOMETER MARKET, BY INTERFACE TYPE
- 17.1 INTRODUCTION
- 17.2 DIGITAL DISPLAY WITH TOUCHSCREEN
- 17.2.1 USER INTERFACE DESIGN
- 17.2.1.1 Rising importance of intuitive UI design in high-end systems to drive demand
- 17.2.2 EASE OF OPERATION
- 17.2.2.1 Growing focus on operator-friendly interaction to drive demand
- 17.2.1 USER INTERFACE DESIGN
- 17.3 DIGITAL DISPLAY WITH PHYSICAL CONTROLS
- 17.3.1 RISING USE OF HYBRID DIGITAL-PHYSICAL CONTROL INTERFACES TO DRIVE DEMAND
- 17.4 ANALOG DISPLAY
- 17.4.1 GROWING NICHE ADOPTION OF ANALOG OPTICAL READOUTS TO DRIVE DEMAND
- 17.5 PC-CONTROLLED SYSTEMS
- 17.5.1 ADVANCED DATA MANAGEMENT
- 17.5.1.1 Growing demand for high-fidelity digital data management to drive growth
- 17.5.2 LABORATORY NETWORK INTEGRATION
- 17.5.2.1 Rising need for seamless laboratory network connectivity to drive demand
- 17.5.1 ADVANCED DATA MANAGEMENT
- 17.6 MOBILE APP INTEGRATION
- 17.6.1 REMOTE MONITORING CAPABILITIES
- 17.6.1.1 Growing deployment of remote-accessible measurement platforms to drive demand
- 17.6.1 REMOTE MONITORING CAPABILITIES
18 HIGH-END REFRACTOMETER MARKET, BY MEASUREMENT PRINCIPLE
- 18.1 INTRODUCTION
- 18.1.1 CRITICAL ANGLE METHOD
- 18.1.1.1 Adaptability for both laboratory and industrial inline measurement to drive demand
- 18.1.2 INTERFEROMETRY-BASED REFRACTOMETRY
- 18.1.2.1 Effective for homogeneous, transparent samples requiring detailed characterization
- 18.1.3 LIGHT DEFLECTION METHOD
- 18.1.3.1 Fast response time, minimal maintenance requirements, and capability to withstand harsh process conditions to drive Demand
- 18.1.4 FRESNEL REFLECTION METHOD
- 18.1.4.1 Rising deployment of Fresnel reflection solutions in surface-sensitive applications to drive demand
- 18.1.1 CRITICAL ANGLE METHOD
19 HIGH-END REFRACTOMETER MARKET, BY SALES CHANNEL
- 19.1 INTRODUCTION
- 19.1.1 DIRECT SALES
- 19.1.1.1 Helps manufacturers introduce new-generation technologies
- 19.1.2 DISTRIBUTORS & INTEGRATORS
- 19.1.2.1 Enable wider participation in exhibitions, university collaborations, and government procurement channels
- 19.1.3 OEM SUPPLY
- 19.1.3.1 Helps instrument companies reach customers who do not buy refractometers directly
- 19.1.4 ONLINE/RETAIL
- 19.1.4.1 Eliminates negotiation cycles common in direct sales
- 19.1.1 DIRECT SALES
20 HIGH-END REFRACTOMETER MARKET, BY APPLICATION
- 20.1 INTRODUCTION
- 20.2 PHARMACEUTICAL QUALITY CONTROL
- 20.2.1 GROWING NEED FOR HIGH-PURITY MEASUREMENT ACCURACY IN PHARMA QC TO DRIVE DEMAND
- 20.3 FOOD & BEVERAGE QUALITY TESTING
- 20.3.1 FOCUS ON CLEAN-LABEL PRODUCTS AND TIGHTER PROCESS CONTROL TO DRIVE DEMAND
- 20.4 CHEMICAL COMPOSITION ANALYSIS
- 20.4.1 AUTOMATED AND DATA-DRIVEN CHEMICAL PROCESSES TO DRIVE DEMAND
- 20.5 PETROLEUM & PETROCHEMICAL TESTING
- 20.5.1 ENVIRONMENTALLY CONTROLLED OPERATIONS TO DRIVE DEMAND
- 20.6 ACADEMIC & SCIENTIFIC RESEARCH
- 20.6.1 GROWING ADOPTION OF ADVANCED OPTICAL INSTRUMENTS IN SCIENTIFIC STUDIES TO DRIVE DEMAND
- 20.7 CLINICAL & MEDICAL DIAGNOSTICS
- 20.7.1 ADOPTION OF DIGITAL REPORTING AND AUTOMATION TO DRIVE DEMAND
- 20.8 GEMSTONE & PRECIOUS MATERIAL TESTING
- 20.8.1 GROWING NEED FOR PRECISE GEMSTONE IDENTIFICATION TO DRIVE DEMAND
- 20.9 ESSENTIAL OILS & FRAGRANCE TESTING
- 20.9.1 RISING DEMAND FOR NATURAL AND PREMIUM FRAGRANCES TO DRIVE DEMAND
- 20.10 POLYMER & PLASTICS
- 20.10.1 R&D FOR INNOVATION IN HIGH-PERFORMANCE PLASTICS, COMPOSITES, AND COATINGS TO DRIVE DEMAND
- 20.11 PAINTING, COATINGS, AND INKS
- 20.11.1 RISING IMPORTANCE OF FORMULATION ACCURACY IN COATINGS TO DRIVE DEMAND
- 20.12 OTHER APPLICATIONS
21 HIGH-END REFRACTOMETER MARKET, BY TYPE
- 21.1 INTRODUCTION
- 21.2 ABBE REFRACTOMETER
- 21.2.1 RISING USE OF CLASSICAL OPTICAL STANDARDS IN RESEARCH AND CALIBRATION TO DRIVE DEMAND
- 21.3 DIGITAL HANDHELD REFRACTOMETER
- 21.3.1 COMPACT DESIGN, BATTERY OPERATION, AND QUICK RESPONSE TIME TO DRIVE DEMAND
- 21.4 AUTOMATIC DIGITAL REFRACTOMETER
- 21.4.1 ABILITY TO DELIVER CONSISTENT MEASUREMENTS UNDER CONTROLLED CONDITIONS TO DRIVE DEMAND
- 21.5 INLINE PROCESS REFRACTOMETER
- 21.5.1 GROWING FOCUS ON REAL-TIME PROCESS OPTIMIZATION TO DRIVE DEMAND
- 21.6 LABORATORY BENCH REFRACTOMETER
- 21.6.1 RISING REQUIREMENTS FOR ADVANCED QC AND MULTI-PARAMETER ANALYSIS TO DRIVE DEMAND
- 21.7 MULTI-WAVELENGTH REFRACTOMETER
- 21.7.1 VALUABLE FOR INDUSTRIES THAT REQUIRE PRECISION IN UNDERSTANDING CHROMATIC DISPERSION OR DESIGNING MATERIALS WITH SPECIFIC OPTICAL PROPERTIES
- 21.8 DIFFERENTIAL REFRACTOMETER
- 21.8.1 RISING NEED FOR HIGH-SENSITIVITY COMPARATIVE ANALYSIS TO DRIVE DEMAND
- 21.9 IMAGING REFRACTOMETER
- 21.9.1 ABILITY TO COMBINE REFRACTOMETRY WITH VISUAL ANALYSIS TO DRIVE DEMAND
22 HIGH-END REFRACTOMETER MARKET, BY REGION
- 22.1 INTRODUCTION
- 22.2 NORTH AMERICA
- 22.2.1 US
- 22.2.1.1 Strong presence of global refractometer manufacturers to support market growth
- 22.2.2 CANADA
- 22.2.2.1 Continuous investment in laboratory modernization and quality assurance programs to drive demand
- 22.2.3 MEXICO
- 22.2.3.1 Manufacturing expansion and export-oriented food industries to drive demand
- 22.2.1 US
- 22.3 EUROPE
- 22.3.1 GERMANY
- 22.3.1.1 Growing demand for precise refractive index measurement to support market expansion
- 22.3.2 FRANCE
- 22.3.2.1 Cosmetics, fragrances, and specialty chemicals industries to strengthen market momentum
- 22.3.3 UK
- 22.3.3.1 Advanced pharmaceutical ecosystem and research institutions to drive demand
- 22.3.4 SPAIN
- 22.3.4.1 Food processing and petrochemical modernization to drive adoption
- 22.3.5 ITALY
- 22.3.5.1 Cosmetics, specialty foods, and pharmaceuticals industries to drive demand
- 22.3.6 POLAND
- 22.3.6.1 Growing industrial modernization and laboratory upgrades to drive demand
- 22.3.7 NORDICS
- 22.3.7.1 Strong focus on biotechnology, sustainability, and advanced materials research to drive demand
- 22.3.8 REST OF EUROPE
- 22.3.1 GERMANY
- 22.4 ASIA PACIFIC
- 22.4.1 CHINA
- 22.4.1.1 Push toward automation and digital QC systems to fuel strong demand
- 22.4.2 JAPAN
- 22.4.2.1 Heavy reliance on refractive index analysis for polymer development to drive demand
- 22.4.3 INDIA
- 22.4.3.1 Growing pharmaceutical and food industries to increase high-end instrument adoption
- 22.4.4 SOUTH KOREA
- 22.4.4.1 Focus on advanced manufacturing technologies and continuous R&D to drive demand
- 22.4.5 AUSTRALIA
- 22.4.5.1 Growing emphasis on quality-driven industries and laboratory modernization to drive demand
- 22.4.6 REST OF ASIA PACIFIC
- 22.4.1 CHINA
- 22.5 REST OF THE WORLD (ROW)
- 22.5.1 MIDDLE EAST
- 22.5.1.1 Strong petrochemical base and rising industrial diversification to drive growth
- 22.5.1.2 GCC Countries
- 22.5.1.3 Other Countries
- 22.5.2 SOUTH AMERICA
- 22.5.2.1 Expanding food & beverage processing and petrochemical industries to drive growth
- 22.5.3 AFRICA
- 22.5.3.1 Emerging food, mining, and beverage industries to drive growth
- 22.5.1 MIDDLE EAST
23 COMPETITIVE LANDSCAPE
- 23.1 OVERVIEW
- 23.2 KEY PLAYER STRATEGIES/RIGHT TO WIN, 2021-2025
- 23.3 MARKET SHARE ANALYSIS, 2024
- 23.4 REVENUE ANALYSIS, 2021-2024
- 23.5 COMPANY VALUATION AND FINANCIAL METRICS, 2025
- 23.6 BRAND COMPARISON
- 23.7 COMPANY EVALUATION MATRIX: KEY PLAYERS, 2024
- 23.7.1 STARS
- 23.7.2 EMERGING LEADERS
- 23.7.3 PERVASIVE PLAYERS
- 23.7.4 PARTICIPANTS
- 23.7.5 COMPANY FOOTPRINT: KEY PLAYERS, 2024
- 23.7.5.1 Company footprint
- 23.7.5.2 Region footprint
- 23.7.5.3 Automation level footprint
- 23.7.5.4 Type footprint
- 23.7.5.5 Configuration footprint
- 23.8 COMPANY EVALUATION MATRIX: STARTUPS/SMES, 2024
- 23.8.1 PROGRESSIVE COMPANIES
- 23.8.2 RESPONSIVE COMPANIES
- 23.8.3 DYNAMIC COMPANIES
- 23.8.4 STARTING BLOCKS
- 23.8.5 COMPETITIVE BENCHMARKING: STARTUPS/SMES, 2024
- 23.8.5.1 List of key startups/SMEs
- 23.8.5.2 Competitive benchmarking of key startups/SMEs
- 23.9 COMPETITIVE SCENARIO
- 23.9.1 PRODUCT LAUNCHES/DEVELOPMENTS
- 23.9.2 DEALS
24 COMPANY PROFILES
- 24.1 KEY PLAYERS
- 24.1.1 ANTON PAAR GMBH
- 24.1.1.1 Business overview
- 24.1.1.2 Products/Solutions/Services offered
- 24.1.1.3 Recent developments
- 24.1.1.3.1 Product launches
- 24.1.1.3.2 Deals
- 24.1.1.4 MnM view
- 24.1.1.4.1 Right to win
- 24.1.1.4.2 Strategic choices
- 24.1.1.4.3 Weaknesses and competitive threats
- 24.1.2 METTLER TOLEDO
- 24.1.2.1 Business overview
- 24.1.2.2 Products/Solutions/Services offered
- 24.1.2.3 Recent developments
- 24.1.2.3.1 Product launches
- 24.1.2.3.2 Deals
- 24.1.2.4 MnM view
- 24.1.2.4.1 Right to win
- 24.1.2.4.2 Strategic choices
- 24.1.2.4.3 Weaknesses and competitive threats
- 24.1.3 ATAGO CO., LTD.
- 24.1.3.1 Business overview
- 24.1.3.2 Products/Solutions/Services offered
- 24.1.3.3 Recent developments
- 24.1.3.3.1 Product launches/upgrades
- 24.1.3.4 MnM view
- 24.1.3.4.1 Right to win
- 24.1.3.4.2 Strategic choices
- 24.1.3.4.3 Weaknesses and competitive threats
- 24.1.4 VAISALA
- 24.1.4.1 Business overview
- 24.1.4.2 Products/Solutions/Services offered
- 24.1.4.3 Recent developments
- 24.1.4.3.1 Product launches/enhancements
- 24.1.4.4 MnM view
- 24.1.4.4.1 Right to win
- 24.1.4.4.2 Strategic choices
- 24.1.4.4.3 Weaknesses and competitive threats
- 24.1.5 REICHERT, INC.
- 24.1.5.1 Business overview
- 24.1.5.2 Products/Solutions/Services offered
- 24.1.5.3 Recent developments
- 24.1.5.3.1 Product launches
- 24.1.5.4 MnM view
- 24.1.5.4.1 Right to win
- 24.1.5.4.2 Strategic choices
- 24.1.5.4.3 Weaknesses and competitive threats
- 24.1.6 RUDOLPH RESEARCH ANALYTICAL
- 24.1.6.1 Business overview
- 24.1.6.2 Products/Solutions/Services offered
- 24.1.6.3 Recent developments
- 24.1.6.3.1 Product launches
- 24.1.6.3.2 Deals
- 24.1.7 A. KRUSS OPTRONIC GMBH
- 24.1.7.1 Business overview
- 24.1.7.2 Products/Solutions/Services offered
- 24.1.7.3 Recent developments
- 24.1.7.3.1 Product launches
- 24.1.8 HANNA INSTRUMENTS, INC.
- 24.1.8.1 Business overview
- 24.1.8.2 Products/Solutions/Services offered
- 24.1.8.3 Recent developments
- 24.1.8.3.1 Product launches
- 24.1.9 KYOTO ELECTRONICS MANUFACTURING CO., LTD.
- 24.1.9.1 Business overview
- 24.1.9.2 Products/Services/Solutions offered
- 24.1.10 XYLEM ANALYTICS GERMANY SALES GMBH & CO. KG
- 24.1.10.1 Business overview
- 24.1.10.2 Products/Solutions/Services offered
- 24.1.10.3 Recent developments
- 24.1.10.3.1 Product launches
- 24.1.1 ANTON PAAR GMBH
- 24.2 OTHER PLAYERS
- 24.2.1 MISCO REFRACTOMETER
- 24.2.2 THERMO FISHER SCIENTIFIC INC
- 24.2.3 SHIMADZU CORPORATION
- 24.2.4 XYLEM
- 24.2.5 FUZHOU LINDIAN TECHNOLOGY DEVELOPMENT CO., LTD.
- 24.2.6 KERN & SOHN GMBH
- 24.2.7 MILWAUKEE INSTRUMENTS, INC.
- 24.2.8 JP SELECTA S.A.
- 24.2.9 SCHMIDT + HAENSCH
- 24.2.10 WATERS CORPORATION
- 24.2.11 EMERSON ELECTRIC CO.
- 24.2.12 MASELLI MISURE S.P.A
- 24.2.13 VEE GEE SCIENTIFIC
- 24.2.14 LAZAR SCIENTIFIC, INC.
- 24.2.15 SPER SCIENTIFIC
- 24.2.16 HM DIGITAL
25 APPENDIX
- 25.1 INSIGHTS FROM INDUSTRY EXPERTS
- 25.2 DISCUSSION GUIDE
- 25.3 KNOWLEDGESTORE: MARKETSANDMARKETS' SUBSCRIPTION PORTAL
- 25.4 CUSTOMIZATION OPTIONS
- 25.5 RELATED REPORTS
- 25.6 AUTHOR DETAILS
