


|
시장보고서
상품코드
1923691
바이오메탄 시장 : 원료별, 제조 공정별, 최종 사용별, 지역별 예측(-2030년)Biomethane Market by Feedstock (Agriculture Residue, Municipal Waste, Energy Crops), Production Process (Anaerobic Digestion & Fermentation, Thermal Gasification), End-use (Power generation, Transportation, Industrial), Region - Global Forecast to 2030 |
||||||
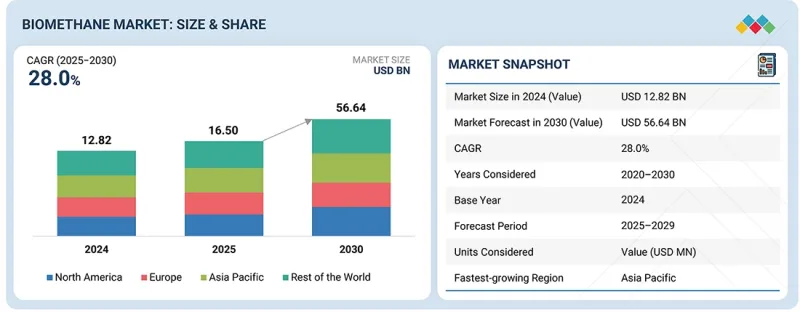
바이오메탄 시장 규모는 예측 기간 동안 CAGR은 28.0%를 나타낼 것으로 보이며, 성장하여 2025년 165억 달러로 평가되었고, 2030년에는 566억 4,000만 달러에 이를 것으로 전망됩니다.
바이오메탄 시장은 유기성 폐기물을 가치 있는 에너지 자원으로 전환하는 순환 경제 관행에 대한 관심이 높아짐에 따라 성장하고 있습니다. 매립지에 대한 제한이 가중되고 폐수 처리에 대한 규제가 더욱 엄격해짐에 따라 도시와 공장들은 대체 에너지로 바이오메탄을 선택하고 있습니다.
| 조사 범위 | |
|---|---|
| 조사 대상 기간 | 2020-2030년 |
| 기준 연도 | 2024년 |
| 예측 기간 | 2025-2030년 |
| 대상 단위 | 가치(100만/10억 달러), 수량(10억 입방 미터) |
| 부문 | 원료별, 제조 공정별, 최종 사용별, 지역별 |
| 대상 지역 | 유럽, 아시아태평양, 북미, 남미 및 세계 기타 지역 |
천연 가스 가격 변동으로 인해 에너지 소비자들은 공급원으로 국내 재생 가능 가스 시장을 모색할 필요가 있습니다. 정제, 액화 및 디지털 플랜트 최적화 기술의 발전은 이미 운영 효율성과 신뢰성을 향상시키고 있습니다. 한편, 재생 가능 가스를 위한 가스 그리드 상호 연결 및 인증 체계가 점점 더 많아지면서 시장이 더욱 투명하고 거래 가능해져 바이오메탄의 상업적 활용이 확대되고 있습니다.
열분해 가스화 방식은 다양한 종류의 건조 및 리그노셀룰로오스 원료를 재생 가능 가스로 전환할 수 있는 능력 덕분에 향후 몇 년간 바이오메탄 부문 중 가장 빠른 성장세를 보일 것으로 예상됩니다. 생물학적 공정과의 주요 차이점은 열분해 가스화가 산림 잔여물, 산업 폐기물 및 기타 소화하기 어려운 물질들을 쉽게 처리할 수 있어 전체 바이오메탄 원료 기반을 확대한다는 점입니다. 고급 폐기물 에너지화 시스템에 대한 관심 증가와 매립 규제 강화가 이 기술의 급속한 채택을 이끄는 주요 요인입니다. 기술 혁신으로 합성가스 수율과 품질이 향상되고 공정 간 연계성이 강화되어 운영 위험이 최소화되고 있습니다. 또한 저탄소 연료에 대한 투자 확대와 고급 재생 가스 기술을 지원하는 정책 프레임워크 도입으로 열 가스화 프로젝트의 상업적 타당성이 개선되고 있습니다.
에너지 소비 산업에서 비용 효율적인 탈탄소화 조치 채택이 주류 트렌드로 자리잡으면서, 산업 부문이 바이오메탄 시장에서 가장 큰 적용 영역이 될 것으로 전망됩니다. 다수의 산업 활동은 고온 가열이 필요한 운영 과정에서 천연가스에 크게 의존하고 있어, 가까운 미래에 전기화를 도입하는 것은 기술적으로 복잡하거나 지나치게 비싼 선택지가 될 수 있습니다. 바이오메탄은 기존 기계나 시설에 큰 변경 없이도 산업 부문의 스코프 1 배출량을 줄일 수 있는 직접적인 대안으로 쉽게 통합될 수 있습니다. 규제 준수, 탄소 배출세, 의무적 배출량 보고 등이 바이오메탄 사용 추세를 가속화하는 요인들입니다. 또한 바이오메탄 장기 공급 계약은 화석 연료 시장의 변동 속에서도 산업계에 안정적인 가격을 보장하며, 기업의 탄소중립 약속과 지속가능성 목표는 산업계로 하여금 재생 가능 가스를 탄소중립 목표 달성을 위한 실현 가능한 탈탄소화 옵션으로 고려하도록 촉진하고 있습니다.
지역별로는 유럽이 발전된 재생 가능 가스 생태계와 강력하고 유리한 정책 덕분에 바이오메탄 산업에서 두 번째로 큰 시장이 될 것으로 전망됩니다. 일부 유럽 국가들은 이미 이 기술의 선진적 도입을 달성했지만, 여전히 구형 기술 교체, 용량 업등급, 에너지 전환 계획에 바이오메탄 통합을 통해 확장이 지속되고 있습니다. 유럽 시장은 우수한 천연가스 공급 시스템, 명확히 정의된 지속가능성 인증 절차, 산업 및 운송과 같은 부문의 대규모 사용에 의해 뒷받침됩니다. 전력 회사, 대형 에너지 기업, 농업 협동조합 간의 협력은 여전히 시장을 주도하고 있습니다. 또한 유럽의 아산화질소 배출에 대한 우려, 외부 가스 의존도 감소 목표, 순환 경제에 대한 적극적인 지원 역시 글로벌 바이오메탄 수요 측면에서 이 지역을 선도적으로 만드는 요소이며, 이로 인해 유럽은 아시아태평양 및 기타 지역에 비해 다소 늦게 진입했음에도 시장의 주요 플레이어로 자리매김하고 있습니다.
조사 방법의 세부사항 :
주요 업계 관계자, 전문 지식을 가진 전문가, 주요 시장 진출기업의 경영 간부, 업계 컨설턴트 등 다양한 전문가에 대해 상세한 인터뷰를 실시했습니다. 이에 따라 중요한 정성적 및 정량적 정보를 수집 및 검증하여 장래 시장 전망을 평가했습니다.
바이오메탄 시장은 광범위한 지역 개발을 가진 소수의 주요 진출기업에 의해 지배되고 있습니다. 바이오 메탄 시장의 주요 진출기업은 Shell Biogas(영국), Air Liquide(프랑스), BP plc(영국), Gasum Ltd(핀란드), OPAL Fuels(미국), Waga Energy(프랑스), Vanguard Renewables(미국), Gothenburg Energy(스웨덴), WELTEC B Group(독일), ETW Energietechnik GmbH(독일), Clean Energy Fuels(미국), EQTEC PLC(아일랜드), GENeco(영국) 등이 있습니다.
조사 범위 :
본 보고서는 e-연료 시장을 규모, 용도 및 연료 유형별로 정의, 설명 및 예측합니다. 또한 시장에 대한 상세한 정성적 및 정량적 분석을 제공합니다. 주요 시장 촉진요인, 억제요인, 기회 및 과제에 대한 포괄적인 검토를 포함합니다. 또한 시장 경쟁 환경 분석, 시장 역학, 가치 측면의 시장 추정 및 바이오메탄 시장의 미래 동향 등 시장의 다양한 중요한 측면을 다룹니다.
이 보고서 구매의 주요 이점
- 바이오가스 시장은 특히 화석 가스 사용을 완전히 제거하기 어려운 지역에서 탈탄소화 및 친환경 에너지 시스템으로의 글로벌 전환에 주로 영향을 받습니다. 메탄 배출에 대한 우려 증가, 기후 변화, 에너지 안보 문제는 천연가스의 재생 가능하고 저탄소 가스 대안으로서 바이오메탄 사용을 가속화하고 있으며, 이에 따라 점점 더 많이 채택되고 있습니다. 바이오메탄은 농업 잔여물, 가축 분뇨, 도시 폐기물 등 다양한 폐기물 흐름에서 생산되어 발전 등뿐만 아니라 순환 경제 목표 달성에도 기여합니다. 기존 가스 인프라와의 완벽한 호환성 덕분에 운송, 산업용 난방, 발전, 그리드 주입 등 모든 분야에서 손쉽게 활용될 수 있습니다. 더욱 엄격해진 배출 규제 및 관련 정부 정책으로 인해 바이오메탄 프로젝트에 대한 투자가 점점 더 보편화되고 있습니다. 동시에 혐기성 분해, 가스 정제, 디지털 플랜트 최적화 기술의 발전은 공정 효율성과 확장성에 긍정적인 영향을 미치고 있습니다. 상기 요인들과 더불어 기업의 지속가능성 약속은 저탄소 시나리오로의 글로벌 에너지 전환을 주도하는 주요 동력이 되고 있으며, 이에 따라 바이오메탄은 점차 핵심 주체 중 하나로 부상하고 있습니다.
- 제품 개발/혁신 : 바이오메탄 산업은 생산 효율성뿐만 아니라 확장성과 환경적 성과까지 개선하기 위한 제품 및 공정 혁신을 통해 진전을 이루고 있습니다. 이 분야에서 가장 주목할 만한 발전은 기업들이 개발 중인 새로운 혐기성 분해 시스템입니다. 이 시스템들은 더 높은 메탄 생산량, 사용 가능한 원료 유형의 유연성 확대, 그리고 더 짧은 체류 시간을 특징으로 합니다. 또한, 막 분리, 압력 변동 흡착, 극저온 정제와 같은 바이오가스 정제 기술들은 모두 바이오메탄의 품질 요건을 충족하거나 초과했으며, 더 낮은 에너지 발자국으로 이를 달성했습니다. 시장 동향은 대규모 중앙집중식 인프라를 대체할 수 있는 소형 유연 바이오메탄 설비의 설치를 촉진하는 방향으로, 폐기물 발생지 근접성을 통해 장거리 고비용 운송 산업을 제거합니다. 자동화 및 디지털 모니터링 시스템 통합은 이미 구축되어 공정 실시간 최적화, 예측 기반 유지보수, 배출량 추적을 지원합니다. 또한 소화 잔류물 관리, 영양분 회수, 생물학적 메탄화 기술의 발전 역시 자원 효율성 향상에 기여하고 있습니다. 공동 소화 및 고급 폐기물 유입 활용에 대한 연구와 실험이 지속적으로 진행되며, 이는 실제로 원료 다양성을 증대시켜 바이오메탄이 순환형 및 저탄소 에너지 시스템에 기여하는 바를 확대하고 있습니다.
- 시장 개발 : 2025년 9월, 하파그로이드와 쉘 바이오가스는 전자의 탈탄소화 프로그램을 지원하기 위한 액화 바이오메탄 공급 다년 계약을 체결했습니다. 2023년 시작된 양사 간 협력으로 하파그로이드의 LNG 이중연료 선박은 기계 개조 없이도 친환경 선박 연료를 연소할 수 있게 되었습니다. 쉘은 이미 전 세계 22개 벙커링 장소에 액화 바이오메탄 공급 지점을 구축해 재생 가능 연료의 접근성을 더욱 높였습니다. ISCC EU 등 인증을 받은 바이오가스는 광범위한 생애주기 온실가스 감축 효과를 제공하여 선단 운영뿐만 아니라 고객 공급망의 배출량 감축도 강화합니다.
- 시장 다각화 : 토탈에너지는 2025년 5월 폴란드 최대 바이오가스 생산업체인 폴스카 그루파 비오가조바(PGB) 지분 절반을 히텍비전(HitecVision)에 매각하는 SPA(주식매매계약)를 체결했습니다. PGB는 이미 총 450GWh 이상의 바이오메탄 생산 능력을 보유한 20개 시설을 확보했으며, 2030년까지 2TWh 달성을 목표로 하고 있습니다. 이번 제휴는 PGB의 바이오메탄 시장 진출을 가속화할 뿐만 아니라, 재생에너지 투자 포트폴리오 개선을 위한 토탈에너지스의 자산 매각 전략과도 부합합니다. 한편 히텍비전은 아직 발전 단계에 있는 폴란드 바이오가스 시장에서 성장을 주도할 견고한 플랫폼을 확보할 기회를 잡았습니다.
자주 묻는 질문
목차
제1장 서론
제2장 주요 요약
제3장 중요 인사이트
제4장 시장 개요
- 시장 역학
- 상호연결된 시장과 분야간 기회
- Tier 1/2/3 참가 기업의 전략적 움직임
제5장 업계 동향
- Porter's Five Forces 분석
- 거시경제 전망
- 공급망 분석
- 생태계 분석
- 무역 분석
- 사례 연구 분석
- 주된 회의와 이벤트(2025-2026년)
- 가격 분석
- 고객의 비즈니스에 영향을 미치는 동향/혁신
- 투자 및 자금조달 시나리오
- 미국 관세의 영향(2025년) - 바이오메탄 시장
제6장 기술의 진보, AI별 영향, 특허, 혁신, 장래의 응용
- 주요 신기술
- 보완적 기술
- 인접 기술
- 기술/제품 로드맵
- 특허 분석
- 미래의 응용
- AI/생성형 AI가 바이오메탄 시장에 미치는 영향
제7장 규제 상황과 지속가능성에 관한 대처
- 지역 규제 및 규정 준수
- 지속가능성에 대한 노력
- 규제 정책이 지속가능성 이니셔티브에 미치는 영향
제8장 고객 환경 및 구매행동
- 의사결정 공정
- 구매 공정에 관여하는 주요 이해관계자와 그 평가기준
- 채택 장벽과 내부 과제
- 다양한 최종 사용자/최종 사용산업으로부터의 미충족 요구
- 시장 수익성
제9장 바이오메탄 시장의 유통 형태
- 파이프라인 인젝션
- 압축천연가스
- 액화 천연 가스
제10장 바이오메탄 시장의 최종 사용자 유형
- 산업
- 상업
- 주택
제11장 바이오메탄 시장(원료별)
- 에너지 작물
- 농업 잔류물 및 동물 비료
- 도시 폐기물
- 기타 원료
제12장 바이오메탄 시장(제조 공정별)
- 혐기성 소화와 발효
- 열가스화
- 기타
제13장 바이오메탄 시장(최종 사용별)
- 운송
- 발전
- 산업
제14장 바이오메탄 시장(지역별)
- 북미
- 미국
- 캐나다
- 멕시코
- 유럽
- 독일
- 영국
- 프랑스
- 덴마크
- 이탈리아
- 스웨덴
- 기타
- 아시아태평양
- 중국
- 인도
- 기타
- 기타 지역
- 중동 및 아프리카
- 남미
제15장 경쟁 구도
- 주요 참가 기업의 경쟁 전략, 강점(2022-2025년)
- 수익 분석(2020-2024년)
- 시장 점유율 분석(2024년)
- 기업평가와 재무재표
- 브랜드 비교
- 기업평가 매트릭스 : 주요 진입기업(2024년)
- 기업평가 매트릭스 : 스타트업, 중소기업(2024년)
- 경쟁 시나리오
제16장 기업 프로파일
- 주요 진출기업
- SHELL
- GASUM LTD
- AIR LIQUIDE
- BP PLC
- VERBIO SE
- TOTALENERGIES
- OPAL FUELS
- CHEVRON CORPORATION
- E.ON SE
- ENGIE
- VEOLIA
- KINDER MORGAN
- AMERESCO
- CLEAN ENERGY FUELS
- GOTEBORG ENERGI
- 기타 기업
- ENVITEC BIOGAS AG
- RAIZEN
- VANGUARD RENEWABLES
- ANAERGIA
- WAGA ENERGY
- WELTEC BIPOWER GMBH
- ETW ENERGIETECHNIK GMBH
- GENECO
- PLANET BIOGAS GROUP
- EQTEC PLC AND GROUP
제17장 조사 방법
제18장 부록
HBR 26.02.19The biomethane market is estimated to reach USD 56.64 billion by 2030 from USD 16.50 billion in 2025, at a CAGR of 28.0% during the forecast period. The biomethane market is being propelled by the rising focus on circular economy practices that transform organic waste into energy resources that are worth. The mounting limitations on landfills and more stringent regulations on wastewater treatment are leading cities and factories to biomethane as an alternative.
| Scope of the Report | |
|---|---|
| Years Considered for the Study | 2020-2030 |
| Base Year | 2024 |
| Forecast Period | 2025-2030 |
| Units Considered | Value (USD Million/Billion); Volume (BCM) |
| Segments | by Feedstock, Production Process, End-use, Region |
| Regions covered | Europe, Asia Pacific, North America, South America, Rest of the World |
Price swings in natural gas are making it necessary for energy consumers to explore the domestic renewable gas market as a supplier. Advances in upgrading, liquefaction, and digital plant optimization technologies are already leading to a better operational efficiency and reliability. Meanwhile, there are more and more gas grid interconnections and certification schemes for renewable gas that are making the market more transparent and tradable, thus facilitating the wider commercial use of biomethane.

"By production process, thermal gasification is projected to be the fastest-growing segment of the biomethane market during the forecast period."
The thermal gasification method, as a production process, is expected to occupy the fastest position among the biomethane segments during the coming years because of its capability to turn various kinds of dry and lignocellulosic feedstocks into renewable gas. The main difference from biological processes is that thermal gasification can easily process forestry residues, industrial waste, and other materials that are hard to digest, thus widening the overall biomethane feedstock base. The combination of increasing interest in advanced waste-to-energy systems and stricter regulations on landfilling is a major factor behind the rapid adoption of the technique. Innovations in technology are increasing the yield, quality of syngas, and interlinkage of the processes, thus minimizing risks to the operation. Moreover, the heightened investment in low-carbon fuels and the introduction of policy frameworks that favor advanced renewable gas technologies are improving the commercial viability of thermal gasification projects.
"The industrial segment is expected to remain the fastest segment by application"
The industrial segment is projected to be the largest application area in the biomethane market owing to the prevailing trend of the adoption of cost-effective decarbonization measures in the energy consuming industries. A number of industrial activities are very much dependent on natural gas for their operations that require high-temperature heating, thus making electrification either technically complicated or too expensive for the near future. Biomethane is a direct alternative that can be integrated easily and that helps the industrial sector to cut down their Scope 1 emissions without making any significant changes to existing machinery or facilities. Regulatory compliance, taxes on carbon emissions and compulsory emissions reporting are among the factors that have been speeding up the trend of biomethane usage. Apart from that, contracts for the long-term supply of biomethane have made it possible for industries to have a stable price during the ups and downs of the fossil fuel market, whereas the corporate net-zero pledges and sustainability targets are pushing the industries to consider renewable gas as a feasible option for decarbonization through which they could achieve their targets.
"By region, Europe is expected to be the second-largest region in the biomethane market during the forecast period."
By region, the biomethane industry is forecasted to have Europe as the second-largest market, thanks to its developed renewable gas ecosystem and robust and favorable policies. Some European countries have already achieved advanced deployment of the technology but still, the expansion continues through replacement of old technology, upgrading of capacities, and integration of biomethane into the energy transition plans. European market is supported by a good natural gas supply system, well-defined sustainability certification process, and large-scale use in sectors such as industrial, and transportation. The collaboration between the power companies, big energy firms, and farmers' cooperatives is still driving the market. Besides, Europe's worry about nitrous oxide emissions, its goal to be less dependent on gas from outside, and its being more supportive of the recycling economy are also factors that put the region at the forefront when it comes to global biomethane demand and thus, Europe's being a major player in the market despite it being a bit late in the game compared to the Asia-Pacific and other regions.
Breakdown of Primaries:
In-depth interviews have been conducted with various key industry participants, subject-matter experts, C-level executives of key market players, and industry consultants, among other experts, to obtain and verify critical qualitative and quantitative information and assess future market prospects. The distribution of primary interviews is as follows:
By Company Type: Tier 1- 65%, Tier 2- 24%, and Tier 3- 11%
By Designation: C-Level Executives - 30%, Managers- 25%, and Others- 45%
By Region: North America- 20%, Europe- 40%, Asia Pacific- 30%, and RoW- 10%
Note: Others include product engineers, product specialists, and engineering leads.
Note: The tiers of the companies are defined based on their total revenues as of 2023. Tier 1: > USD 1 billion, Tier 2: From USD 500 million to USD 1 billion, and Tier 3: < USD 500 million
The biomethane market is dominated by a few major players that have a wide regional presence. The leading players in the biomethane market are Shell Biogas (United Kingdom), Air Liquide (France), BP p.l.c. (UK), Gasum Ltd (Finland), OPAL Fuels (US), Waga Energy (France), Vanguard Renewables (United States), Gothenburg Energy (Sweden), WELTEC BIOPOWER GmbH (Germany), PlanET Biogas Group (Germany), ETW Energietechnik GmbH (Germany), Clean Energy Fuels (United States), EQTEC PLC (Ireland), and GENeco (UK), among others.
Study Coverage:
The report defines, describes, and forecasts the e-fuel market by size, application, and fuel type. It also offers a detailed qualitative and quantitative analysis of the market. The report provides a comprehensive review of the major market drivers, restraints, opportunities, and challenges. It also covers various important aspects of the market. These include an analysis of the competitive landscape, market dynamics, market estimates in terms of value, and future trends in the biomethane market.
Key Benefits of Buying the Report
- The biogas market is mainly influenced by the global shift to decarbonized and eco-friendly energy systems, especially in areas where it is difficult to eliminate the use of fossil gas completely. The increasing worries about methane getting emitted, along with climate change, and energy security, are fast-tracking the biomethane usage as a renewable, low-carbon gas alternative to natural gas and hence, it is being adopted more and more. Biomethane is being generated from various waste streams including agricultural residues, animal dung, and municipal waste, thereby not only power generation and more but also being able to achieve the circular economy goals. Its complete compatibility with the existing gas infrastructure allows it to be used effortlessly in all the mentioned areas viz. transport, industrial heating, power generation, and grid injection. The stricter emission regulations and other related government policies, have led to a situation where investment in biomethane projects is becoming more and more common. At the same time, the advancements in the technologies used for anaerobic digestion, gas upgrading, and digital plant optimization are having a positive impact on the efficiency and scalability of the process. Alongside the above-mentioned factors, the corporate sustainability commitments are becoming a major driving force behind the global energy transition to a low carbon scenario, and thus, biomethane is gradually being identified as one of the key players.
- Product Development/Innovation: The biomethane industry is making strides through product and process innovations that aim to improve not only the efficiency of production but also the scalability and environmental performance. Among the most significant developments in this area are the new anaerobic digestion systems that are being created by companies. These systems are characterized by higher methane yields, greater flexibility in the types of feedstock used, and shorter retention times. Moreover, biogas upgrading technologies such as membrane separation, pressure swing adsorption, and cryogenic upgrading have all met and exceeded the quality requirements for biomethane and have done so with a lower energy footprint. The market trend is to promote the installation of small and flexible biomethane units that can take the place of big and centralized infrastructures as they come closer to waste sources and thus eliminate the long and costly transportation industry. Automation and digital monitoring system integration are already in place, providing support for the optimization of the process in real-time, maintenance based on predictions, and tracking of emissions. Furthermore, advances in digestate management, nutrient recovery, and biological methanation are also contributing to the increase in resource efficiency. Research and experimentation are continuously exploring co-digestion and the use of advanced waste streams, which are in fact increasing feedstock diversity and thus the contribution of biomethane to circular and low-carbon energy systems.
- Market Development: In September 2025, Hapag-Lloyd and Shell Biogas signed a multi-year deal for liquefied biomethane delivery to support the former's decarbonization programme. The coalition between the two companies, which started in 2023, allows Hapag-Lloyd's LNG dual-fuelled ships, to burn the eco-friendly marine fuel without the need for any modification of their machinery. Shell has already set up liquefied biomethane supply points at 22 bunkering places across the globe, thereby making the renewable fuel even more available. The biogas certified by ISCC EU and the like provides extensive lifecycle GHG reductions which enhance the reduction of emissions in not just fleet operations but also in customer supply chains.
- Market Diversification: TotalEnergies, in May 2025, made a deal through an SPA to divest half of the shares in Polska Grupa Biogazowa (PGB) which is the main biogas producer in Poland, to HitecVision. PGB has already acquired 20 units whose combined biomethane capacity amounts to more than 450 GWh and is also looking to reach 2 TWh by 2030. The alliance not just hastens PGB's foray into biomethane but also goes hand in hand with TotalEnergies' farmdown strategy to improve the renewable investment portfolio, while HitecVision seizes the opportunity of having a solid platform for driving growth in the biogas market in Poland which is still in the developing phase.
- Competitive Assessment: Assessment of rankings of some of the key players, including of TotalEnergies (France), Veolia (France), Chevron Corporation (United States), Shell Biogas (United Kingdom), Air Liquide (France), BP p.l.c. (United Kingdom), Raizen (Brazil), Gasum Ltd (Finland), Anaergia (Canada), EnviTec Biogas AG (Germany), Kinder Morgan (United States), Ameresco (United States), ENGIE (France), E.ON SE (Germany), Verbio SE (Germany), OPAL Fuels (United States) among others.
TABLE OF CONTENTS
1 INTRODUCTION
- 1.1 STUDY OBJECTIVES
- 1.2 MARKET DEFINITION
- 1.3 MARKET SCOPE
- 1.3.1 MARKET SEGMENTATION AND REGIONAL SCOPE
- 1.3.2 INCLUSIONS AND EXCLUSIONS
- 1.3.3 YEARS CONSIDERED
- 1.4 CURRENCY CONSIDERED
- 1.5 UNITS CONSIDERED
- 1.6 STAKEHOLDERS
- 1.7 SUMMARY OF CHANGES
2 EXECUTIVE SUMMARY
- 2.1 MARKET HIGHLIGHTS AND KEY INSIGHTS
- 2.2 KEY MARKET PARTICIPANTS: MAPPING OF STRATEGIC DEVELOPMENTS
- 2.3 DISRUPTIVE TRENDS IN BIOMETHANE MARKET
- 2.4 HIGH-GROWTH SEGMENTS
- 2.5 REGIONAL SNAPSHOT: MARKET SIZE, GROWTH RATE, AND FORECAST
3 PREMIUM INSIGHTS
- 3.1 ATTRACTIVE OPPORTUNITIES FOR PLAYERS IN BIOMETHANE MARKET
- 3.2 BIOMETHANE MARKET, BY REGION
- 3.3 BIOMETHANE MARKET, BY FEEDSTOCK TYPE
- 3.4 BIOMETHANE MARKET, BY PRODUCTION PROCESS
- 3.5 BIOMETHANE MARKET, BY END-USE APPLICATION
- 3.6 BIOMETHANE MARKET IN EUROPE, BY END-USE APPLICATION AND COUNTRY
4 MARKET OVERVIEW
- 4.1 INTRODUCTION
- 4.2 MARKET DYNAMICS
- 4.2.1 DRIVERS
- 4.2.1.1 Turning organic waste into low-cost renewable gas
- 4.2.1.2 Increasing biomethane output through advanced processing technologies
- 4.2.1.3 Government support through binding policy, incentives, and market integration
- 4.2.2 RESTRAINTS
- 4.2.2.1 Limited sustainable feedstock availability
- 4.2.2.2 Competition from alternative low-carbon and renewable gases
- 4.2.3 OPPORTUNITIES
- 4.2.3.1 Rapid scale-up via grid injection & national targets
- 4.2.3.2 Growth in heavy-duty transport & CNG/LNG/LBG market (road, shipping, buses)
- 4.2.4 CHALLENGES
- 4.2.4.1 High CAPEX/uncertain project economics
- 4.2.4.2 Gas network and injection constraints
- 4.2.1 DRIVERS
- 4.3 INTERCONNECTED MARKETS AND CROSS-SECTOR OPPORTUNITIES
- 4.3.1 INTERCONNECTED MARKETS
- 4.3.2 CROSS-SECTOR OPPORTUNITIES
- 4.4 STRATEGIC MOVES BY TIER 1/2/3 PLAYERS
5 INDUSTRY TRENDS
- 5.1 PORTER'S FIVE FORCES ANALYSIS
- 5.1.1 THREAT OF SUBSTITUTES
- 5.1.2 BARGAINING POWER OF SUPPLIERS
- 5.1.3 BARGAINING POWER OF BUYERS
- 5.1.4 THREAT OF NEW ENTRANTS
- 5.1.5 INTENSITY OF COMPETITIVE RIVALRY
- 5.2 MACROECONOMIC OUTLOOK
- 5.2.1 INTRODUCTION
- 5.2.2 PUBLIC CLEAN ENERGY SPENDING
- 5.2.3 ENERGY PRICE VOLATILITY
- 5.2.4 WASTE MANAGEMENT COSTS
- 5.2.5 AGRICULTURAL ECONOMICS
- 5.3 SUPPLY CHAIN ANALYSIS
- 5.4 ECOSYSTEM ANALYSIS
- 5.5 TRADE ANALYSIS
- 5.5.1 EXPORT SCENARIO (HS CODE 271111)
- 5.5.2 IMPORT SCENARIO (HS CODE 271111)
- 5.6 CASE STUDY ANALYSIS
- 5.6.1 BIOMETHANE PRODUCTION AT STEUBEN COUNTY LANDFILL (WAGA ENERGY)
- 5.6.2 VANGUARD RENEWABLES & ASTRAZENECA RNG AGREEMENT
- 5.6.3 PERDUE FARMS BIOMETHANE FROM WASTEWATER (GREENGAS USA)
- 5.7 KEY CONFERENCES AND EVENTS, 2025-2026
- 5.8 PRICING ANALYSIS
- 5.8.1 INDICATIVE PRICING OF BIOMETHANE MARKET, BY END-USE APPLICATION, 2024
- 5.8.2 AVERAGE SELLING PRICE TREND OF BIOMETHANE, BY REGION, 2020-2024
- 5.9 TRENDS/DISRUPTIONS IMPACTING CUSTOMERS' BUSINESSES
- 5.10 INVESTMENT AND FUNDING SCENARIO
- 5.11 IMPACT OF 2025 US TARIFFS-BIOMETHANE MARKET
- 5.11.1 INTRODUCTION
- 5.11.2 KEY TARIFF RATES
- 5.11.3 PRICE IMPACT ANALYSIS
- 5.11.4 IMPACT ON COUNTRIES/REGIONS
- 5.11.4.1 US
- 5.11.4.2 Europe
- 5.11.4.3 Asia Pacific
- 5.11.5 IMPACT ON END-USER INDUSTRIES
6 TECHNOLOGICAL ADVANCEMENTS, AI-DRIVEN IMPACT, PATENTS, INNOVATIONS, AND FUTURE APPLICATIONS
- 6.1 KEY EMERGING TECHNOLOGIES
- 6.1.1 MEMBRANE SEPARATION TECHNOLOGY
- 6.1.2 CRYOGENIC SEPARATION TECHNOLOGY
- 6.1.3 FEEDSTOCK PRE-TREATMENT TECHNOLOGIES
- 6.2 COMPLEMENTARY TECHNOLOGIES
- 6.2.1 PROCESS MONITORING & CONTROL SYSTEMS
- 6.2.2 DIGESTATE TREATMENT TECHNOLOGIES
- 6.3 ADJACENT TECHNOLOGIES
- 6.3.1 BIOGAS-TO-LIQUID TECHNOLOGIES
- 6.3.2 CARBON CAPTURE & UTILIZATION/STORAGE (CCUS)
- 6.4 TECHNOLOGY/PRODUCT ROADMAP
- 6.4.1 SHORT-TERM (2025-2027) | COMMERCIAL SCALE-UP AND MARKET CONSOLIDATION
- 6.4.2 MID-TERM (2028-2030) | SYSTEM INTEGRATION & COST OPTIMIZATION PHASE
- 6.4.3 LONG-TERM (2030-2035+) | NET-ZERO ALIGNMENT & MARKET MATURITY PHASE
- 6.5 PATENT ANALYSIS
- 6.6 FUTURE APPLICATIONS
- 6.7 IMPACT OF AI/GEN AI ON BIOMETHANE MARKET
- 6.7.1 TOP USE CASES AND MARKET POTENTIAL
- 6.7.2 BEST PRACTICES FOLLOWED BY OEMS IN BIOMETHANE MARKET
- 6.7.3 CASE STUDIES OF AI IMPLEMENTATION IN BIOMETHANE MARKET
- 6.7.4 INTERCONNECTED ECOSYSTEMS AND IMPACT ON MARKET PLAYERS
7 REGULATORY LANDSCAPE AND SUSTAINABILITY INITIATIVES
- 7.1 REGIONAL REGULATIONS AND COMPLIANCE
- 7.1.1 REGULATORY BODIES, GOVERNMENT AGENCIES, AND OTHER ORGANIZATIONS
- 7.1.2 INDUSTRY STANDARDS
- 7.2 SUSTAINABILITY INITIATIVES
- 7.2.1 WASTE VALORIZATION AND CIRCULAR FEEDSTOCK UTILIZATION
- 7.2.2 LOW-EMISSION PRODUCTION, UPGRADING EFFICIENCY, AND LIFECYCLE OPTIMIZATION
- 7.3 IMPACT OF REGULATORY POLICIES ON SUSTAINABILITY INITIATIVES
8 CUSTOMER LANDSCAPE & BUYING BEHAVIOR
- 8.1 DECISION-MAKING PROCESS
- 8.2 KEY STAKEHOLDERS INVOLVED IN BUYING PROCESS AND THEIR EVALUATION CRITERIA
- 8.2.1 KEY STAKEHOLDERS IN BUYING PROCESS
- 8.2.2 BUYING CRITERIA
- 8.3 ADOPTION BARRIERS AND INTERNAL CHALLENGES
- 8.4 UNMET NEEDS FROM VARIOUS END-USER/END-USE INDUSTRIES
- 8.5 MARKET PROFITABILITY
9 DISTRIBUTION MODES IN BIOMETHANE MARKET
- 9.1 INTRODUCTION
- 9.2 PIPELINE INJECTION
- 9.3 COMPRESSED NATURAL GAS
- 9.4 LIQUEFIED NATURAL GAS
10 END-USER TYPES IN BIOMETHANE MARKET
- 10.1 INTRODUCTION
- 10.2 INDUSTRIAL
- 10.3 COMMERCIAL
- 10.4 RESIDENTIAL
11 BIOMETHANE MARKET, BY FEEDSTOCK
- 11.1 INTRODUCTION
- 11.2 ENERGY CROPS
- 11.2.1 ENERGY CROPS PROVIDE FEEDSTOCK RELIABILITY IN BIOMETHANE VALUE CHAIN
- 11.3 AGRICULTURAL RESIDUES & ANIMAL MANURE
- 11.3.1 AGRICULTURAL RESIDUES & ANIMAL MANURE ANCHOR SCALABLE AND LOW-RISK BIOMETHANE SUPPLY
- 11.4 MUNICIPAL WASTE
- 11.4.1 MUNICIPAL WASTE EMERGES AS PRIMARY ENGINE OF SCALABLE, URBAN BIOMETHANE DEPLOYMENT
- 11.5 OTHER FEEDSTOCKS
- 11.5.1 INDUSTRIAL ORGANIC WASTE
- 11.5.2 SEWAGE SLUDGE
- 11.5.3 WASTEWATER
12 BIOMETHANE MARKET, BY PRODUCTION PROCESS
- 12.1 INTRODUCTION
- 12.2 ANAEROBIC DIGESTION & FERMENTATION
- 12.2.1 ANAEROBIC DIGESTION AND FERMENTATION FORM THE BACKBONE OF GLOBAL BIOMETHANE PRODUCTION
- 12.3 THERMAL GASIFICATION
- 12.3.1 THERMAL GASIFICATION EXPANDS BIOMETHANE PRODUCTION BEYOND BIOLOGICAL PATHWAYS
- 12.4 OTHER PRODUCTION PROCESSES
13 BIOMETHANE MARKET, BY END-USE APPLICATION
- 13.1 INTRODUCTION
- 13.2 TRANSPORTATION
- 13.2.1 TRANSPORT APPLICATIONS POSITION BIOMETHANE AS A LEADING DROP-IN DECARBONIZATION FUEL FOR MOBILITY
- 13.3 POWER GENERATION
- 13.3.1 BIOMETHANE STRENGTHENS THE POWER GENERATION MIX AS A DISPATCHABLE, LOW-CARBON ALTERNATIVE TO NATURAL GAS
- 13.4 INDUSTRIAL
- 13.4.1 INDUSTRIAL ENERGY TRANSITION INITIATIVES AND GOVERNMENT STRATEGIES TO SUPPORT GROWTH
14 BIOMETHANE MARKET, BY REGION
- 14.1 INTRODUCTION
- 14.2 NORTH AMERICA
- 14.2.1 US
- 14.2.1.1 US biomethane market is policy-driven and led by transportation demand
- 14.2.2 CANADA
- 14.2.2.1 Canada is supporting indigenous-led clean energy projects to advance energy independence and emissions reduction
- 14.2.3 MEXICO
- 14.2.3.1 Promising opportunities with strong potential from abundant waste and biomass resources
- 14.2.1 US
- 14.3 EUROPE
- 14.3.1 GERMANY
- 14.3.1.1 Germany's large-scale grid injection and strong policy support ensure market leadership
- 14.3.2 UK
- 14.3.2.1 Despite strong decarbonization potential, growth remains constrained by policy uncertainty and restrictive feedstock regulations
- 14.3.3 FRANCE
- 14.3.3.1 Strong targets and binding supplier obligations make France Europe's fastest-growing biomethane market
- 14.3.4 DENMARK
- 14.3.4.1 Denmark aims to replace fossil gas fully, but faces slowed growth after subsidy withdrawal
- 14.3.5 ITALY
- 14.3.5.1 Italy is scaling biomethane through strong policy funding, agricultural integration, and transport readiness
- 14.3.6 SWEDEN
- 14.3.6.1 High CO2 taxes, long-term policy support, and significant reliance on imported biomethane to propel growth
- 14.3.7 REST OF EUROPE
- 14.3.1 GERMANY
- 14.4 ASIA PACIFIC
- 14.4.1 CHINA
- 14.4.1.1 China is transitioning biomethane from waste-based power use to an industry-driven decarbonization fuel led by state utilities
- 14.4.2 INDIA
- 14.4.2.1 Strong government support, CBG blending mandates, and waste-to-energy policies accelerate biomethane adoption
- 14.4.3 REST OF ASIA PACIFIC
- 14.4.1 CHINA
- 14.5 REST OF THE WORLD
- 14.5.1 MIDDLE EAST & AFRICA
- 14.5.1.1 Pipeline of pilot and commercial projects is projected to offer sustained growth in MEA markets
- 14.5.2 SOUTH AMERICA
- 14.5.2.1 Promising initiatives in Brazil, Chile, and Colombia to spearhead growth of biomethane usage
- 14.5.1 MIDDLE EAST & AFRICA
15 COMPETITIVE LANDSCAPE
- 15.1 INTRODUCTION
- 15.2 KEY PLAYER COMPETITIVE STRATEGIES/RIGHT TO WIN, 2022-2025
- 15.3 REVENUE ANALYSIS, 2020-2024
- 15.4 MARKET SHARE ANALYSIS, 2024
- 15.5 COMPANY VALUATION AND FINANCIAL METRICS
- 15.6 BRAND COMPARISON
- 15.7 COMPANY EVALUATION MATRIX: KEY PLAYERS, 2024
- 15.7.1 STARS
- 15.7.2 EMERGING LEADERS
- 15.7.3 PERVASIVE PLAYERS
- 15.7.4 PARTICIPANTS
- 15.7.5 COMPANY FOOTPRINT, KEY PLAYERS, 2024
- 15.7.5.1 Company footprint
- 15.7.5.2 Region footprint
- 15.7.5.3 Feedstock footprint
- 15.7.5.4 Production process footprint
- 15.7.5.5 End-use application footprint
- 15.8 COMPANY EVALUATION MATRIX: STARTUPS/SMES, 2024
- 15.8.1 PROGRESSIVE COMPANIES
- 15.8.2 RESPONSIVE COMPANIES
- 15.8.3 DYNAMIC COMPANIES
- 15.8.4 STARTING BLOCKS
- 15.8.5 COMPETITIVE BENCHMARKING: STARTUPS/SMES, 2024
- 15.8.5.1 Detailed list of key startups/SMEs
- 15.8.5.2 Competitive benchmarking of key startups/SMEs
- 15.9 COMPETITIVE SCENARIO
- 15.9.1 DEALS
- 15.9.2 EXPANSIONS
- 15.9.3 OTHER DEVELOPMENTS
16 COMPANY PROFILES
- 16.1 KEY PLAYERS
- 16.1.1 SHELL
- 16.1.1.1 Business overview
- 16.1.1.2 Products/Solutions/Services offered
- 16.1.1.3 Recent developments
- 16.1.1.3.1 Deals
- 16.1.1.4 MnM view
- 16.1.1.4.1 Key strengths/Right to win
- 16.1.1.4.2 Strategic choices
- 16.1.1.4.3 Weaknesses/Competitive threats
- 16.1.2 GASUM LTD
- 16.1.2.1 Business overview
- 16.1.2.2 Products/Solutions/Services offered
- 16.1.2.3 Recent developments
- 16.1.2.3.1 Deals
- 16.1.2.3.2 Expansions
- 16.1.2.3.3 Other developments
- 16.1.2.4 MnM view
- 16.1.2.4.1 Key strengths/Right to win
- 16.1.2.4.2 Strategic choices
- 16.1.2.4.3 Weaknesses/Competitive threats
- 16.1.3 AIR LIQUIDE
- 16.1.3.1 Business overview
- 16.1.3.2 Products/Solutions/Services offered
- 16.1.3.3 Recent developments
- 16.1.3.3.1 Expansions
- 16.1.3.4 MnM view
- 16.1.3.4.1 Key strengths/Right to win
- 16.1.3.4.2 Strategic choices
- 16.1.3.4.3 Weaknesses/Competitive threats
- 16.1.4 BP P.L.C.
- 16.1.4.1 Business overview
- 16.1.4.2 Products/Solutions/Services offered
- 16.1.4.3 Recent developments
- 16.1.4.3.1 Deals
- 16.1.4.3.2 Expansions
- 16.1.4.4 MnM view
- 16.1.4.4.1 Key strengths/Right to win
- 16.1.4.4.2 Strategic choices
- 16.1.4.4.3 Weaknesses/Competitive threats
- 16.1.5 VERBIO SE
- 16.1.5.1 Business overview
- 16.1.5.2 Products/Solutions/Services offered
- 16.1.5.3 Recent developments
- 16.1.5.3.1 Deals
- 16.1.5.3.2 Expansions
- 16.1.5.4 MnM view
- 16.1.5.4.1 Key strengths/Right to win
- 16.1.5.4.2 Strategic choices
- 16.1.5.4.3 Weaknesses/Competitive threats
- 16.1.6 TOTALENERGIES
- 16.1.6.1 Business overview
- 16.1.6.2 Products/Solutions/Services offered
- 16.1.6.3 Recent developments
- 16.1.6.3.1 Deals
- 16.1.6.3.2 Expansions
- 16.1.6.4 MnM view
- 16.1.6.4.1 Key strengths/Right to win
- 16.1.6.4.2 Strategic choices
- 16.1.6.4.3 Weaknesses/Competitive threats
- 16.1.7 OPAL FUELS
- 16.1.7.1 Business overview
- 16.1.7.2 Products/Solutions/Services offered
- 16.1.7.3 Recent developments
- 16.1.7.3.1 Deals
- 16.1.7.3.2 Expansions
- 16.1.7.3.3 Other developments
- 16.1.8 CHEVRON CORPORATION
- 16.1.8.1 Business overview
- 16.1.8.2 Products/Solutions/Services offered
- 16.1.8.3 Recent developments
- 16.1.8.3.1 Deals
- 16.1.8.3.2 Expansions
- 16.1.9 E.ON SE
- 16.1.9.1 Business overview
- 16.1.9.2 Products/Solutions/Services offered
- 16.1.10 ENGIE
- 16.1.10.1 Business overview
- 16.1.10.2 Products/Solutions/Services offered
- 16.1.10.3 Recent developments
- 16.1.10.3.1 Deals
- 16.1.10.3.2 Expansions
- 16.1.10.3.3 Other developments
- 16.1.11 VEOLIA
- 16.1.11.1 Business overview
- 16.1.11.2 Products/Solutions/Services offered
- 16.1.11.3 Recent developments
- 16.1.11.3.1 Deals
- 16.1.11.3.2 Other developments
- 16.1.12 KINDER MORGAN
- 16.1.12.1 Business overview
- 16.1.12.2 Products/Solutions/Services offered
- 16.1.12.3 Recent developments
- 16.1.12.3.1 Deals
- 16.1.13 AMERESCO
- 16.1.13.1 Business overview
- 16.1.13.2 Products/Solutions/Services offered
- 16.1.13.3 Recent developments
- 16.1.13.3.1 Deals
- 16.1.13.3.2 Expansions
- 16.1.13.3.3 Other developments
- 16.1.14 CLEAN ENERGY FUELS
- 16.1.14.1 Business overview
- 16.1.14.2 Products/Solutions/Services offered
- 16.1.14.3 Recent developments
- 16.1.14.3.1 Deals
- 16.1.14.3.2 Expansions
- 16.1.15 GOTEBORG ENERGI
- 16.1.15.1 Business overview
- 16.1.15.2 Products/Solutions/Services offered
- 16.1.15.3 Recent developments
- 16.1.15.3.1 Expansions
- 16.1.1 SHELL
- 16.2 OTHER PLAYERS
- 16.2.1 ENVITEC BIOGAS AG
- 16.2.2 RAIZEN
- 16.2.3 VANGUARD RENEWABLES
- 16.2.4 ANAERGIA
- 16.2.5 WAGA ENERGY
- 16.2.6 WELTEC BIPOWER GMBH
- 16.2.7 ETW ENERGIETECHNIK GMBH
- 16.2.8 GENECO
- 16.2.9 PLANET BIOGAS GROUP
- 16.2.10 EQTEC PLC AND GROUP
17 RESEARCH METHODOLOGY
- 17.1 RESEARCH DATA
- 17.2 SECONDARY AND PRIMARY RESEARCH
- 17.2.1 SECONDARY DATA
- 17.2.1.1 List of key secondary sources
- 17.2.1.2 Key data from secondary sources
- 17.2.2 PRIMARY DATA
- 17.2.2.1 List of primary interview participants
- 17.2.2.2 Key industry insights
- 17.2.2.3 Breakdown of primaries
- 17.2.2.4 Key data from primary sources
- 17.2.1 SECONDARY DATA
- 17.3 MARKET SIZE ESTIMATION METHODOLOGY
- 17.3.1 BOTTOM-UP APPROACH
- 17.3.2 TOP-DOWN APPROACH
- 17.3.3 DEMAND-SIDE ANALYSIS
- 17.3.3.1 Demand-side assumptions
- 17.3.3.2 Demand-side calculations
- 17.3.4 SUPPLY-SIDE ANALYSIS
- 17.3.4.1 Supply-side assumptions
- 17.3.4.2 Supply-side calculations
- 17.4 GROWTH FORECASTS
- 17.5 MARKET BREAKDOWN AND DATA TRIANGULATION
- 17.6 RESEARCH LIMITATIONS
- 17.7 RISK ANALYSIS
18 APPENDIX
- 18.1 INSIGHTS FROM INDUSTRY EXPERTS
- 18.2 DISCUSSION GUIDE
- 18.3 KNOWLEDGESTORE: MARKETSANDMARKETS' SUBSCRIPTION PORTAL
- 18.4 CUSTOMIZATION OPTIONS
- 18.5 RELATED REPORTS
- 18.6 AUTHOR DETAILS
