|
시장보고서
상품코드
1927589
광학 선별기 시장 : 제공별, 유형별, 플랫폼별, 용도별 - 예측(-2032년)Optical Sorter Market by Offering (Feed System, Optical System, Image Processing, Separation System), Type (Cameras, NIR, Hyperspectral, XRT), Platform (Belt, Freefall, Lane), Application (Food & Beverages, Recycling) - Global Forecast to 2032 |
||||||
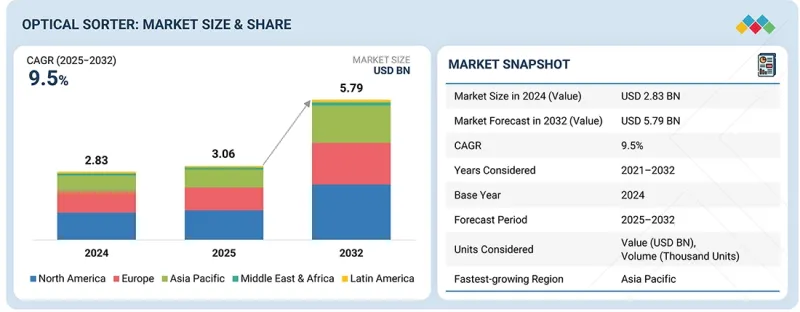
세계의 광학 선별기 시장 규모는 2025년 30억 6,000만 달러에서 2032년까지 57억 9,000만 달러에 이를 것으로 예측되어 CAGR 9.5%의 성장이 전망되고 있습니다.
최근 몇 년 동안 이 업계는 큰 발전을 이루었습니다. 자동화에 대한 관심이 높아지면서 재활용 산업의 생산성 향상에 기여하고 있습니다.
| 조사 범위 | |
|---|---|
| 조사 대상 기간 | 2021년-2032년 |
| 기준 연도 | 2024년 |
| 예측 기간 | 2025년-2032년 |
| 단위 | 10억 달러 |
| 부문 | 제공, 유형, 용도, 지역 |
| 대상 지역 | 북미, 유럽, 아시아태평양, 기타 지역 |
재활용 시설들이 더 많은 폐기물을 보다 효율적이고 비용 효율적인 방식으로 처리해야 한다는 압박에 직면한 가운데, 수작업 선별 공정으로는 충분하지 않다는 것이 밝혀지고 있습니다. 광학 선별기는 플라스틱, 유리, 금속 등의 재료를 빠르고 정확하게 분리하는 첨단 기술을 이용한 솔루션을 제공합니다. 이를 통해 처리 능력이 향상되고, 재료의 회수율과 순도가 향상되어 경제적, 환경적 목표를 달성할 수 있습니다.

"벨트 부문이 예측 기간 동안 가장 큰 시장 규모를 차지할 것으로 예측됩니다. "
플랫폼별로는 일관된 재료 공급과 우수한 선별 정확도로 인한 높은 처리 능력이 벨트 부문의 성장을 가속하고 있습니다. 벨트 기반 시스템은 정밀한 감지 및 배출을 지원하는 안정적이고 평평한 표면을 제공하여 식품 가공, 재활용, 광업 등 다양한 응용 분야에 적합합니다. 또한, 첨단 멀티 센서 기술과의 호환성, 깨지기 쉬운 재료 및 불규칙한 형태의 재료에 대한 친화적인 핸들링, 자동화된 생산 라인에 쉽게 통합할 수 있다는 점이 플랫폼 부문에서의 우위를 더욱 강화합니다.
"재활용 부문이 예측 기간 동안 가장 높은 성장률을 나타낼 것으로 예측됩니다. "
재활용에 대한 수요 증가는 폐기물 발생량 증가, 재활용 규제 강화, 순환 경제에 대한 전 세계적인 관심에 기인합니다. 정부와 지자체는 재료 회수율, 순도 수준, 운영 효율을 높이기 위해 첨단 선별 기술에 대한 투자를 확대하고 있습니다. 광학 선별기는 플라스틱, 종이, 금속, 전자 폐기물을 빠르고 정확하게 분리할 수 있고, 매립 의존도를 낮추고 인건비를 절감할 수 있어 재활용 시설에서 빠르게 도입되고 있습니다.
"북미는 예측 기간 동안 광학 선별기 시장에서 가장 큰 점유율을 차지할 것으로 예측됩니다. "
북미가 광학 선별기 시장에서 가장 큰 점유율을 차지할 것으로 예상되는 주요 원인은 북미의 높은 자동화 기술 채택률, 대규모 식품 가공, 재활용 및 광업 산업의 강력한 존재감, AI 및 센서 기반 선별 시스템의 조기 통합에 기인합니다. 미국, 캐나다 등의 국가에서는 식품 안전, 품질 관리, 폐기물 관리에 대한 규제가 엄격하고, 컴플라이언스 향상, 오염 감소, 업무 효율성 향상을 위해 고정밀 광학 선별 솔루션에 대한 지속적인 투자가 이루어지고 있습니다. 또한, 이 지역은 잘 구축된 산업 인프라, 자동화를 촉진하는 높은 인건비, 강력한 R&D 역량, 주요 광학 선별기 제조업체 및 기술 제공업체의 존재로 인해 여러 최종 사용 산업에서 기술 채택과 대규모 배포가 가속화되고 있습니다.
세계의 광학 선별기 시장에 대해 조사 분석했으며, 주요 촉진요인 및 저해요인, 제품 개발 및 혁신, 경쟁 구도에 대한 정보를 전해드립니다.
자주 묻는 질문
목차
제1장 서론
제2장 주요 요약
제3장 중요 지견
- 광학 선별기 시장 기업에 있어서 매력적인 기회
- 북미 광학 선별기 시장 : 용도별, 국가별
- 북미 광학 선별기 시장 : 용도별
- 광학 선별기 시장 : 지역별
제4장 시장 개요
- 시장 역학
- 성장 촉진요인
- 성장 억제요인
- 기회
- 과제
- 미충족 요구와 화이트 스페이스
- 연결된 시장과 부문간 기회
- Tier 1/2/3 기업의 전략적 움직임
제5장 업계 동향
- Porter의 Five Forces 분석
- 거시경제 전망
- GDP 동향과 예측
- 세계의 재활용 업계 동향
- 세계의 식품 및 음료 업계 동향
- 밸류체인 분석
- 생태계 분석
- 가격 결정 분석
- 광학 선별기 가격대 : 재활용 용도별(2024년)
- 광학 선별기 가격 동향 : 용도별(2021년-2024년)
- 광학 선별기 평균 판매 가격 동향 : 지역별(2021년-2024년)
- 무역 분석
- 수입 시나리오(HS코드 843710)
- 수출 시나리오(HS코드 843710)
- 주요 컨퍼런스 및 이벤트(2026년)
- 고객의 비즈니스에 영향을 미치는 동향/혼란
- 투자 및 자금조달 시나리오
- 사례 연구 분석
- 2025년 미국 관세의 영향 - 광학 선별기 시장
- 주요 관세율
- 가격 영향 분석
- 국가/지역에 대한 영향
- 용도에 대한 영향
제6장 기술 진보, AI에 의한 영향, 특허, 혁신, 향후 용도
- 주요 신기술
- 근적외선(NIR) 분광법
- 고해상도 카메라 시스템
- AI를 활용한 영상 분석
- 보완 기술
- 로봇 배출 시스템
- 자동 컨베이어 시스템
- 인접 기술
- X선선별 시스템
- 하이퍼 스펙트럼 이미징
- 기술/제품 로드맵
- 단기 : AI를 활용한 아키텍처 최적화와 클라우드 통합(2025년-2027년)
- 중기 : 이종 통합과 설계 에코시스템 확대(2027년-2030년)
- 장기 : 유니바사르리콘피규라브르콘퓨팅과 시스템 레벨에서의 융합(2030년-2035년 이후)
- 특허 분석(2015년-2024년)
- 광학 선별기 시장에 대한 AI/생성형 AI의 영향
- 주요 이용 사례와 시장 장래성
- 광학 선별기 시장 OEM 베스트 프랙티스
- 광학 선별기 시장 AI/생성형 AI도입에 관한 사례 연구
- 상호 접속된 에코시스템과 시장 기업에 대한 영향
- AI/생성형 AI가 통합된 광학 선별기 채택에 대한 고객 준비 상황
제7장 규제 상황
- 규제기관, 정부기관, 기타 조직
- 표준
- 정부 규제
- 인정
제8장 고객 상황과 구매 행동
- 의사결정 프로세스
- 바이어 이해관계자와 구입 평가 기준
- 구매 프로세스에 관여하는 주요 이해관계자와 그 평가 기준
- 구입 기준
- 채택 장벽과 내부 과제
- 다양한 용도 미충족 요구
제9장 광학식 선별 기술
- 하이퍼 스펙트럼 이미징
- RGB 이미징
- X선선별
- 기타 기술
제10장 광학 선별기 throughput 개요
- 1톤/h미만(소규모)
- 1-5톤/h(중규모)
- 6-20톤/h(대규모)
- 20톤/h초(메가 스케일)
제11장 광학 선별기 시장 : 제공별
- 하드웨어
- 소프트웨어 및 서비스
- 최종사용자 규모에 근거한 분류
제12장 광학 선별기 시장 : 유형별
- 기존 카메라
- NIR 선별기
- 하이퍼 스펙트럼 카메라·복합 선별기
- 레이저
- 기타 유형
제13장 광학 선별기 시장 : 플랫폼별
- 벨트
- 프리 폴
- 레인
- 하이브리드
제14장 광학 선별기 시장 : 용도별
- 식품 및 음료
- 재활용
- 광업
- 제약
- 기타 용도
제15장 광학 선별기 시장 : 지역별
- 북미
- 북미의 거시경제 전망
- 미국
- 캐나다
- 멕시코
- 유럽
- 유럽의 거시경제 전망
- 영국
- 독일
- 프랑스
- 스페인
- 이탈리아
- 폴란드
- 북유럽
- 기타 유럽
- 아시아태평양
- 아시아태평양의 거시경제 전망
- 중국
- 일본
- 한국
- 인도
- 호주
- 인도네시아
- 말레이시아
- 태국
- 베트남
- 기타 아시아태평양
- 기타 지역
- 기타 지역 거시경제 전망
- 중동
- 아프리카
- 남미
제16장 경쟁 구도
- 개요
- 주요 시장 진출기업의 전략/강점, 2023년 1월-2025년 9월
- 매출 분석(2020년-2024년)
- 시장 점유율 분석(2024년)
- 기업 평가와 재무 지표
- 브랜드/제품 비교
- 기업 평가 매트릭스 : 주요 기업(2024년)
- 기업 평가 매트릭스 : 스타트업/중소기업(2024년)
- 경쟁 시나리오
제17장 기업 개요
- 주요 기업
- BUHLER
- TOMRA SYSTEMS ASA
- STEINERT
- SESOTEC GROUP
- PELLENC ST
- HEFEI MEYER OPTOELECTRONIC TECHNOLOGY INC.
- BINDER+CO
- SATAKE CORPORATION
- HEFEI TAIHE INTELLIGENT TECHNOLOGY CO., LTD.
- CP MANUFACTURING, LLC
- REDWAVE
- KEY TECHNOLOGY
- 기타 기업
- NATIONAL RECOVERY TECHNOLOGIES, LLC
- RAYTEC VISION SPA
- ANGELON
- MAF RODA AGROBOTIC
- NEWTEC A/S
- CIMBRIA
- DAEWON GSI
- ELICA ASM
- TECHIK INSTRUMENT
- ALLGAIER WERKE
- UNITEC S.P.A.
- AWETA
- MACHINEX INDUSTRIES INC.
제18장 조사 방법
제19장 부록
LSH 26.02.20The optical sorter market is projected to grow from USD 3.06 billion in 2025 to USD 5.79 billion by 2032, at a CAGR of 9.5%. The industry has experienced significant advancements in recent years. The increasing focus on automation enhances productivity in the recycling industry.
| Scope of the Report | |
|---|---|
| Years Considered for the Study | 2021-2032 |
| Base Year | 2024 |
| Forecast Period | 2025-2032 |
| Units Considered | Value (USD Billion) |
| Segments | By Offering, Type, Application and Region |
| Regions covered | North America, Europe, APAC, RoW |
As recycling facilities face growing pressure to handle larger volumes of waste more efficiently and cost-effectively, manual sorting processes are proving insufficient. Optical sorters provide a technologically advanced solution, enabling the high-speed and accurate separation of materials such as plastics, glass, and metals. This improves throughput and boosts material recovery rates and purity, meeting economic and environmental objectives.
"The belt segment is projected to account for the largest market during the forecast period."
By platform, the growth of the belt segment is driven by its ability to handle high volumes with consistent material presentation and superior sorting accuracy. Belt-based systems provide a stable, flat surface that supports precise detection and ejection, making them suitable for a wide range of applications in food processing, recycling, and mining. Additionally, their compatibility with advanced multi-sensor technologies, gentle handling of fragile or irregular materials, and easy integration into automated production lines further reinforce their dominance in the platform segment.
"The recycling segment is projected to record the highest growth during the forecast period."
The growing demand for recycling applications is due to the rising waste generation, stricter recycling regulations, and strong global focus on circular economy initiatives. Governments and municipalities are increasingly investing in advanced sorting technologies to improve material recovery rates, purity levels, and operational efficiency. Optical sorters enable accurate separation of plastics, paper, metals, and e-waste at high speeds, reducing landfill dependency and manual labor, which is driving rapid adoption across recycling facilities.
"North America is projected to account for the largest share in the optical sorter market during the forecast period."
North America is projected to account for the largest share of the optical sorter market primarily due to the region's high adoption of advanced automation technologies, strong presence of large-scale food processing, recycling, and mining industries, and early integration of AI- and sensor-based sorting systems. Countries, such as the US and Canada, have stringent food safety, quality control, and waste management regulations, which drive continuous investment in high-precision optical sorting solutions to improve compliance, reduce contamination, and enhance operational efficiency. The region also benefits from a well-established industrial infrastructure, high labor costs that encourage automation, strong R&D capabilities, and the presence of leading optical sorter manufacturers and technology providers, all of which accelerate technology adoption and large-scale deployments across multiple end-use industries.
Given below is the breakdown of primary interviews:
- By Company Type: Tier 1 - 20%, Tier 2 - 45%, and Tier 3 - 35%
- By Designation: C-level Executives - 35%, Directors - 40%, and Others - 25%
- By Region: North America - 25%, Europe - 30%, Asia Pacific - 35%, and RoW - 10%
Prominent players profiled in this report include TOMRA Systems ASA (Norway), Hefei Meyer Optoelectronic Technology INC. (China), Buhler (Switzerland), STEINERT (Germany), Key Technology (US), Sesotec Group (Germany), PELLENC ST (France), Binder+Co (Austria), SATAKE CORPORATION (Japan), and Hefei Taihe Intelligent Technology Co., Ltd (China).
Research Coverage:
The report defines, describes, and forecasts the optical sorter market by offering (Hardware, software & services), type (Traditional cameras, NIR sorters, hyperspectral cameras & combined sorters, lasers, other types), platform (Belt, freefall, lane, hybrid), application (Food & beverages, recycling, mining, pharmaceutical, other applications), and region (North America, Europe, Asia Pacific, and RoW). It provides detailed information regarding drivers, restraints, opportunities, and challenges influencing the market's growth. Additionally, it analyzes competitive developments, including acquisitions, product launches, expansions, and actions taken by key players to grow in the market.
Reasons to Buy This Report:
The report will help market leaders/new entrants with information on the closest approximations of the revenue for the overall optical sorter market and its subsegments. The report will help stakeholders understand the competitive landscape and gain more insight to position their business better and plan suitable go-to-market strategies. The report will also help stakeholders understand the market's pulse and provide information on key drivers, restraints, opportunities, and challenges.
The report provides insights into the following points:
- Analysis of Key Drivers (Rising deployment of sustainable packaging solutions, high emphasis on environmental and sustainability goals), restraints (Low defect-detection accuracy or sensitivity, integration with IoT and AI technologies), opportunities (Implementation of stringent waste management regulations), and challenges (Limitations of infrared and other sorting technologies) in the optical sorter market
- Product Development/Innovation: Detailed insights into upcoming technologies, research & development activities, and product launches in the optical sorter market
- Market Development: Comprehensive information about lucrative markets across various regions
- Market Diversification: Exhaustive information about products launched, untapped geographies, recent developments, and investments in the optical sorter market
- Competitive Assessment: In-depth assessment of market share, growth strategies, and offering of leading players, including TOMRA Systems ASA (Norway), Hefei Meyer Optoelectronic Technology INC. (China), Buhler (Switzerland), STEINERT (Germany), and Key Technology (US) in the optical sorter market
TABLE OF CONTENTS
1 INTRODUCTION
- 1.1 STUDY OBJECTIVES
- 1.2 MARKET DEFINITION
- 1.3 STUDY SCOPE
- 1.3.1 MARKET SEGMENTATION AND REGIONAL SCOPE
- 1.3.2 INCLUSIONS AND EXCLUSIONS
- 1.3.3 YEARS CONSIDERED
- 1.4 CURRENCY CONSIDERED
- 1.5 UNIT CONSIDERED
- 1.6 STAKEHOLDERS
- 1.7 SUMMARY OF CHANGES
2 EXECUTIVE SUMMARY
- 2.1 MARKET HIGHLIGHTS AND KEY INSIGHTS
- 2.2 KEY MARKET PARTICIPANTS: MAPPING OF STRATEGIC DEVELOPMENTS
- 2.3 DISRUPTIVE TRENDS IN OPTICAL SORTER MARKET
- 2.4 HIGH-GROWTH SEGMENTS
- 2.5 REGIONAL SNAPSHOT: MARKET SIZE, GROWTH RATE, AND FORECAST
3 PREMIUM INSIGHTS
- 3.1 ATTRACTIVE OPPORTUNITIES FOR PLAYERS IN OPTICAL SORTER MARKET
- 3.2 OPTICAL SORTER MARKET IN NORTH AMERICA, BY APPLICATION AND COUNTRY
- 3.3 OPTICAL SORTER MARKET IN NORTH AMERICA, BY APPLICATION
- 3.4 OPTICAL SORTER MARKET, BY GEOGRAPHY
4 MARKET OVERVIEW
- 4.1 INTRODUCTION
- 4.2 MARKET DYNAMICS
- 4.2.1 DRIVERS
- 4.2.1.1 Growing focus on automation to increase productivity in recycling industry
- 4.2.1.2 Rising deployment of sustainable packaging solutions
- 4.2.1.3 High emphasis on environmental and sustainability goals
- 4.2.2 RESTRAINTS
- 4.2.2.1 Requirement for high upfront investment
- 4.2.2.2 Low defect-detection accuracy or sensitivity
- 4.2.2.3 Issues in sorting plastic waste
- 4.2.3 OPPORTUNITIES
- 4.2.3.1 Rapid advances in detection and imaging technologies
- 4.2.3.2 Implementation of stringent waste management regulations
- 4.2.3.3 Integration with IoT and AI technologies
- 4.2.4 CHALLENGES
- 4.2.4.1 Limitations of infrared and other sorting technologies
- 4.2.4.2 Disrupted supply chains and consumer health concerns
- 4.2.1 DRIVERS
- 4.3 UNMET NEEDS AND WHITE SPACES
- 4.4 INTERCONNECTED MARKETS AND CROSS-SECTOR OPPORTUNITIES
- 4.5 STRATEGIC MOVES BY TIER-1/2/3 PLAYERS
5 INDUSTRY TRENDS
- 5.1 INTRODUCTION
- 5.2 PORTER'S FIVE FORCES ANALYSIS
- 5.2.1 THREAT OF NEW ENTRANTS
- 5.2.2 THREAT OF SUBSTITUTES
- 5.2.3 BARGAINING POWER OF SUPPLIERS
- 5.2.4 BARGAINING POWER OF BUYERS
- 5.2.5 INTENSITY OF COMPETITIVE RIVALRY
- 5.3 MACROECONOMIC OUTLOOK
- 5.3.1 INTRODUCTION
- 5.3.2 GDP TRENDS AND FORECAST
- 5.3.3 TRENDS IN GLOBAL RECYCLING INDUSTRY
- 5.3.4 TRENDS IN GLOBAL FOOD & BEVERAGES INDUSTRY
- 5.4 VALUE CHAIN ANALYSIS
- 5.5 ECOSYSTEM ANALYSIS
- 5.6 PRICING ANALYSIS
- 5.6.1 PRICING RANGE OF OPTICAL SORTERS, BY RECYCLING APPLICATION, 2024
- 5.6.2 PRICING TREND OF OPTICAL SORTERS, BY APPLICATION, 2021-2024
- 5.6.3 AVERAGE SELLING PRICE TREND OF OPTICAL SORTERS, BY REGION, 2021-2024
- 5.7 TRADE ANALYSIS
- 5.7.1 IMPORT SCENARIO (HS CODE 843710)
- 5.7.2 EXPORT SCENARIO (HS CODE 843710)
- 5.8 KEY CONFERENCES AND EVENTS, 2026
- 5.9 TRENDS/DISRUPTIONS IMPACTING CUSTOMER BUSINESS
- 5.10 INVESTMENT AND FUNDING SCENARIO
- 5.11 CASE STUDY ANALYSIS
- 5.11.1 ANDEAN VALLEY ADOPTS BUHLER'S SORTEX OPTICAL- SORTING SOLUTION TO OPTIMIZE QUINOA PROCESSING
- 5.11.2 STEINBEIS POLYVERT USES SESOTEC'S ADVANCED SORTING TECHNOLOGY TO PRODUCE HIGH-QUALITY RECYCLED GRANULATE
- 5.11.3 ALBA AND HEFEI MEYER OPTOELECTRONIC TECHNOLOGY JOIN HANDS TO RECYCLE FOOD-GRADE RPET USING SORTING MACHINES
- 5.11.4 CIRREC AND TOMRA PARTNER TO INSTALL ADVANCED FLAKE SORTING UNITS TO ENABLE FINE POLYMER AND COLOR SEPARATION
- 5.11.5 PENN WASTE LEVERAGES PELLENC ST SORTERS TO ENHANCE OPERATIONAL THROUGHPUT
- 5.12 IMPACT OF 2025 US TARIFF - OPTICAL SORTER MARKET
- 5.12.1 INTRODUCTION
- 5.12.2 KEY TARIFF RATES
- 5.12.3 PRICE IMPACT ANALYSIS
- 5.12.4 IMPACT ON COUNTRIES/REGIONS
- 5.12.4.1 US
- 5.12.4.2 Europe
- 5.12.4.3 Asia Pacific
- 5.12.5 IMPACT ON APPLICATIONS
6 TECHNOLOGICAL ADVANCEMENTS, AI-DRIVEN IMPACTS, PATENTS, INNOVATIONS, AND FUTURE APPLICATIONS
- 6.1 KEY EMERGING TECHNOLOGIES
- 6.1.1 NEAR-INFRARED (NIR) SPECTROSCOPY
- 6.1.2 HIGH-RESOLUTION CAMERA SYSTEMS
- 6.1.3 AI-POWERED IMAGE ANALYTICS
- 6.2 COMPLEMENTARY TECHNOLOGIES
- 6.2.1 ROBOTIC EJECTION SYSTEMS
- 6.2.2 AUTOMATED CONVEYOR SYSTEMS
- 6.3 ADJACENT TECHNOLOGIES
- 6.3.1 X-RAY SORTING SYSTEMS
- 6.3.2 HYPERSPECTRAL IMAGING
- 6.4 TECHNOLOGY/PRODUCT ROADMAP
- 6.4.1 SHORT-TERM (2025-2027): AI ENABLED ARCHITECTURE OPTIMIZATION AND CLOUD INTEGRATION
- 6.4.2 MID-TERM (2027-2030): HETEROGENEOUS INTEGRATION & DESIGN ECOSYSTEM EXPANSION
- 6.4.3 LONG-TERM (2030-2035+): UNIVERSAL RECONFIGURABLE COMPUTING AND SYSTEM-LEVEL CONVERGENCE
- 6.5 PATENT ANALYSIS, 2015-2024
- 6.6 IMPACT OF AI/GEN AI ON OPTICAL SORTER MARKET
- 6.6.1 TOP USE CASES AND MARKET POTENTIAL
- 6.6.2 BEST PRACTICES FOLLOWED BY OEMS IN OPTICAL SORTER MARKET
- 6.6.3 CASE STUDIES RELATED TO AI/GEN AI IMPLEMENTATION IN OPTICAL SORTER MARKET
- 6.6.4 INTERCONNECTED ECOSYSTEM AND IMPACT ON MARKET PLAYERS
- 6.6.5 CLIENTS' READINESS TO ADOPT AI/GEN AI-INTEGRATED OPTICAL SORTERS
7 REGULATORY LANDSCAPE
- 7.1 INTRODUCTION
- 7.1.1 REGULATORY BODIES, GOVERNMENT AGENCIES, AND OTHER ORGANIZATIONS
- 7.1.2 STANDARDS
- 7.1.3 GOVERNMENT REGULATIONS
- 7.1.4 CERTIFICATIONS
8 CUSTOMER LANDSCAPE AND BUYER BEHAVIOR
- 8.1 DECISION-MAKING PROCESS
- 8.2 BUYER STAKEHOLDERS AND BUYING EVALUATION CRITERIA
- 8.2.1 KEY STAKEHOLDERS INVOLVED IN BUYING PROCESS AND THEIR EVALUATION CRITERIA
- 8.2.2 BUYING CRITERIA
- 8.3 ADOPTION BARRIERS AND INTERNAL CHALLENGES
- 8.4 UNMET NEEDS OF VARIOUS APPLICATIONS
9 OPTICAL SORTER TECHNOLOGIES
- 9.1 INTRODUCTION
- 9.2 HYPERSPECTRAL IMAGING
- 9.3 RED, GREEN, AND BLUE (RGB) IMAGING
- 9.4 X-RAY SORTING
- 9.5 OTHER TECHNOLOGIES
10 OVERVIEW OF OPTICAL SORTER THROUGHPUT
- 10.1 INTRODUCTION
- 10.2 <1 TON/HOUR (SMALL-SCALE)
- 10.3 1-5 TONS/HOUR (MEDIUM-SCALE)
- 10.4 6-20 TONS/HOUR (LARGE-SCALE)
- 10.5 >20 TONS/HOUR (MEGA-SCALE)
11 OPTICAL SORTER MARKET, BY OFFERING
- 11.1 INTRODUCTION
- 11.2 HARDWARE
- 11.2.1 ABILITY TO ENSURE SUPERIOR DETECTION AND REMOVAL OF CONTAMINANTS IN INDUSTRIES TO SPUR DEMAND
- 11.2.2 FEED SYSTEMS
- 11.2.3 OPTICAL SYSTEMS
- 11.2.4 IMAGE PROCESSING UNITS
- 11.2.5 SEPARATION SYSTEMS
- 11.3 SOFTWARE & SERVICES
- 11.3.1 RAPID INTEGRATION WITH INDUSTRIAL IOT PLATFORMS TO BOLSTER SEGMENTAL GROWTH
- 11.4 CLASSIFICATION BASED ON SCALE OF END USERS
- 11.4.1 LARGE-SCALE OPERATIONS
- 11.4.2 SMALL- AND MEDIUM-SCALE OPERATIONS
12 OPTICAL SORTER MARKET, BY TYPE
- 12.1 INTRODUCTION
- 12.2 TRADITIONAL CAMERAS
- 12.2.1 COST EFFICIENCY AND SIMPLICITY ATTRIBUTES TO FUEL SEGMENTAL GROWTH
- 12.3 NIR SORTERS
- 12.3.1 HIGH DEMAND FROM MODERN RECYCLING FACILITIES TO BOLSTER SEGMENTAL GROWTH
- 12.4 HYPERSPECTRAL CAMERAS & COMBINED SORTERS
- 12.4.1 RISING NEED TO ACCURATELY PROCESS COMPLEX WASTE STREAMS TO AUGMENT SEGMENTAL GROWTH
- 12.5 LASERS
- 12.5.1 FOCUS ON MEETING STRINGENT QUALITY STANDARDS IN RECYCLING OPERATIONS TO BOOST SEGMENTAL GROWTH
- 12.6 OTHER TYPES
13 OPTICAL SORTER MARKET, BY PLATFORM
- 13.1 INTRODUCTION
- 13.2 BELT
- 13.2.1 GROWING EMPHASIS ON ENERGY-EFFICIENT OPERATIONS AND DOWNTIME REDUCTION TO CONTRIBUTE TO SEGMENTAL GROWTH
- 13.3 FREEFALL
- 13.3.1 RISING AUTOMATION IN RECYCLING INDUSTRIES TO EXPEDITE SEGMENTAL GROWTH
- 13.4 LANE
- 13.4.1 INCREASING USE IN FOOD PROCESSING TO ACCELERATE SEGMENTAL GROWTH
- 13.5 HYBRID
- 13.5.1 INCREASING WASTE COMPLEXITY, REGULATORY PRESSURES, AND CORPORATE SUSTAINABILITY TARGETS TO SPUR DEMAND
14 OPTICAL SORTER MARKET, BY APPLICATION
- 14.1 INTRODUCTION
- 14.2 FOOD & BEVERAGE
- 14.2.1 VEGETABLES & FRUITS
- 14.2.1.1 Focus on minimizing waste and complying with stringent safety regulations to fuel segmental growth
- 14.2.2 DRIED FRUITS & NUTS
- 14.2.2.1 Increasing consumption of high-purity healthy snacks to augment segmental growth
- 14.2.3 MEATS & SEAFOODS
- 14.2.3.1 Shift toward packaged, processed, and ready-to-cook products to foster segmental growth
- 14.2.4 GRAINS, CEREALS & PULSES
- 14.2.4.1 Increasing consumer preference for clean-label packaged staples to expedite segmental growth
- 14.2.5 DAIRY PRODUCTS
- 14.2.5.1 Rising need to detect impurities, discoloration, and foreign particles to augment segmental growth
- 14.2.6 SPICES
- 14.2.6.1 Requirement to meet stringent quality certifications, residue safety standards, and uniform color grading to drive market
- 14.2.7 PROCESSED FOODS
- 14.2.7.1 Mounting demand for convenience foods and frozen meals to bolster segmental growth
- 14.2.1 VEGETABLES & FRUITS
- 14.3 RECYCLING
- 14.3.1 PLASTICS
- 14.3.1.1 Rising need for high-purity recycled products to accelerate segmental growth
- 14.3.1.2 PET recycling
- 14.3.1.3 Film recycling
- 14.3.1.4 Other plastics
- 14.3.2 PAPERS
- 14.3.2.1 Strong focus on reducing manual labor costs and enhancing throughput to contribute to segmental growth
- 14.3.3 ORGANIC WASTES
- 14.3.3.1 Rising implementation of composting and bioenergy initiatives to boost segmental growth
- 14.3.4 CONSTRUCTION & DEMOLITION
- 14.3.4.1 Increasing government regulations promoting sustainable construction and waste management to drive market
- 14.3.5 E-SCRAPS
- 14.3.5.1 Rapid increase in electronic waste generation and focus on resource recovery to drive market
- 14.3.6 METALS
- 14.3.6.1 High emphasis on enhancing recycling efficiency to facilitate segmental growth
- 14.3.6.2 WEEE sorting
- 14.3.6.3 ASR sorting
- 14.3.6.4 Aluminum recycling
- 14.3.7 GLASS
- 14.3.7.1 Utilization of high-precision sensor technology to augment segmental growth
- 14.3.8 WASTES
- 14.3.8.1 Need to comply with environmental regulations to boost segmental growth
- 14.3.1 PLASTICS
- 14.4 MINING
- 14.4.1 INDUSTRIAL MINERALS
- 14.4.1.1 Reliance on advanced technologies to improve downstream processing yields to foster segmental growth
- 14.4.2 PRECIOUS METALS
- 14.4.2.1 Increasing extraction efficiency requirements to accelerate segmental growth
- 14.4.3 OTHER MINING APPLICATIONS
- 14.4.1 INDUSTRIAL MINERALS
- 14.5 PHARMACEUTICAL
- 14.5.1 TABLET & CAPSULE INSPECTION
- 14.5.1.1 Deployment of innovative technologies to detect micro-defects to fuel segmental growth
- 14.5.2 PACKAGING INSPECTION
- 14.5.2.1 Growing need for automated packaging verification to meet safety and serialization regulations to drive market
- 14.5.3 MEDICAL DEVICE COMPONENT SORTING
- 14.5.3.1 Rising production of precision devices requiring high-accuracy component validation to boost segmental growth
- 14.5.4 DRUG SUBSTANCE PURIFICATION
- 14.5.4.1 Emphasis on cleaner purification streams and reducing downstream filtration burdens to expedite segmental growth
- 14.5.1 TABLET & CAPSULE INSPECTION
- 14.6 OTHER APPLICATIONS
15 OPTICAL SORTER MARKET, BY REGION
- 15.1 INTRODUCTION
- 15.2 NORTH AMERICA
- 15.2.1 MACROECONOMIC OUTLOOK FOR NORTH AMERICA
- 15.2.2 US
- 15.2.2.1 Increasing waste generation and environmental goals to bolster market growth
- 15.2.3 CANADA
- 15.2.3.1 High pressure to address plastic pollution to accelerate market growth
- 15.2.4 MEXICO
- 15.2.4.1 Evolving regulatory frameworks to curb waste to boost market growth
- 15.3 EUROPE
- 15.3.1 MACROECONOMIC OUTLOOK FOR EUROPE
- 15.3.2 UK
- 15.3.2.1 Rising regulatory pressure on waste management to accelerate market growth
- 15.3.3 GERMANY
- 15.3.3.1 Rapid industrial innovation to contribute to market growth
- 15.3.4 FRANCE
- 15.3.4.1 Increasing urban populations and evolving lifestyles to augment market growth
- 15.3.5 SPAIN
- 15.3.5.1 Mounting investment in recycling initiatives to expedite market growth
- 15.3.6 ITALY
- 15.3.6.1 High expertise in advanced plastic-recycling technologies to boost market growth
- 15.3.7 POLAND
- 15.3.7.1 Strong focus on meeting hygiene, quality control, and throughput requirements to fuel market growth
- 15.3.8 NORDICS
- 15.3.8.1 Regulatory frameworks and circular economy policies to accelerate market growth
- 15.3.9 REST OF EUROPE
- 15.4 ASIA PACIFIC
- 15.4.1 MACROECONOMIC OUTLOOK FOR ASIA PACIFIC
- 15.4.2 CHINA
- 15.4.2.1 Rapid industrialization and domestic plastic recycling rate to augment market growth
- 15.4.3 JAPAN
- 15.4.3.1 Increasing need to minimize errors and enhance efficiency in industries to drive market
- 15.4.4 SOUTH KOREA
- 15.4.4.1 Government policies to provide long-term, low-interest loans to small recycling firms to fuel market growth
- 15.4.5 INDIA
- 15.4.5.1 Mounting demand for fast-moving consumer goods to bolster market growth
- 15.4.6 AUSTRALIA
- 15.4.6.1 Growing emphasis on effective waste management to expedite market growth
- 15.4.7 INDONESIA
- 15.4.7.1 Strong focus on development of recycling infrastructure to accelerate market growth
- 15.4.8 MALAYSIA
- 15.4.8.1 Shift preference toward advanced recycling to contribute to market growth
- 15.4.9 THAILAND
- 15.4.9.1 High commitment to increase recycling volumes to drive market
- 15.4.10 VIETNAM
- 15.4.10.1 Growing awareness of environmental issues and regulatory pressure to expedite market growth
- 15.4.11 REST OF ASIA PACIFIC
- 15.5 ROW
- 15.5.1 MACROECONOMIC OUTLOOK FOR ROW
- 15.5.2 MIDDLE EAST
- 15.5.2.1 Bahrain
- 15.5.2.1.1 Strong focus on improving waste management ecosystem to facilitate market growth
- 15.5.2.2 Kuwait
- 15.5.2.2.1 Growing awareness of food safety and quality standards to boost market growth
- 15.5.2.3 Oman
- 15.5.2.3.1 Increasing focus on food quality and safety to expedite market growth
- 15.5.2.4 Qatar
- 15.5.2.4.1 Greater emphasis on productivity, quality assurance, and streamlined operations in industries to drive market
- 15.5.2.5 Saudi Arabia
- 15.5.2.5.1 Rising adoption of automation technologies to augment market growth
- 15.5.2.6 UAE
- 15.5.2.6.1 Sustainability, advanced recycling, and automation targets to bolster market growth
- 15.5.2.7 Rest of Middle East
- 15.5.2.1 Bahrain
- 15.5.3 AFRICA
- 15.5.3.1 South Africa
- 15.5.3.1.1 Emergence as major producer and global exporter of precious minerals to drive market
- 15.5.3.2 Other African countries
- 15.5.3.1 South Africa
- 15.5.4 SOUTH AMERICA
- 15.5.4.1 Brazil
- 15.5.4.1.1 Rise in plastic waste production to boost market growth
- 15.5.4.2 Argentina
- 15.5.4.2.1 Growing demand for recycled plastic products to expedite market growth
- 15.5.4.3 Rest of South America
- 15.5.4.1 Brazil
16 COMPETITIVE LANDSCAPE
- 16.1 OVERVIEW
- 16.2 KEY PLAYER STRATEGIES/RIGHT TO WIN, JANUARY 2023-SEPTEMBER 2025
- 16.3 REVENUE ANALYSIS, 2020-2024
- 16.4 MARKET SHARE ANALYSIS, 2024
- 16.5 COMPANY VALUATION AND FINANCIAL METRICS
- 16.6 BRAND/PRODUCT COMPARISON
- 16.7 COMPANY EVALUATION MATRIX: KEY PLAYERS, 2024
- 16.7.1 STARS
- 16.7.2 EMERGING LEADERS
- 16.7.3 PERVASIVE PLAYERS
- 16.7.4 PARTICIPANTS
- 16.7.5 COMPANY FOOTPRINT: KEY PLAYERS, 2024
- 16.7.5.1 Company footprint
- 16.7.5.2 Region footprint
- 16.7.5.3 Application footprint
- 16.7.5.4 Type footprint
- 16.7.5.5 Offering footprint
- 16.7.5.6 Platform footprint
- 16.8 COMPANY EVALUATION MATRIX: STARTUPS/SMES, 2024
- 16.8.1 PROGRESSIVE COMPANIES
- 16.8.2 RESPONSIVE COMPANIES
- 16.8.3 DYNAMIC COMPANIES
- 16.8.4 STARTING BLOCKS
- 16.8.5 COMPETITIVE BENCHMARKING: STARTUPS/SMES, 2024
- 16.8.5.1 Detailed list of startups/SMEs
- 16.8.5.2 Competitive benchmarking of key startups/SMEs
- 16.9 COMPETITIVE SCENARIO
- 16.9.1 PRODUCT LAUNCHES
- 16.9.2 DEALS
- 16.9.3 EXPANSIONS
17 COMPANY PROFILES
- 17.1 KEY PLAYERS
- 17.1.1 BUHLER
- 17.1.1.1 Business overview
- 17.1.1.2 Products/Solutions/Services offered
- 17.1.1.3 Recent developments
- 17.1.1.3.1 Product launches
- 17.1.1.3.2 Deals
- 17.1.1.3.3 Expansions
- 17.1.1.4 MnM view
- 17.1.1.4.1 Key strengths/Right to win
- 17.1.1.4.2 Strategic choices
- 17.1.1.4.3 Weaknesses/Competitive threats
- 17.1.2 TOMRA SYSTEMS ASA
- 17.1.2.1 Business overview
- 17.1.2.2 Products/Solutions/Services offered
- 17.1.2.3 Recent developments
- 17.1.2.3.1 Product launches
- 17.1.2.3.2 Deals
- 17.1.2.3.3 Expansions
- 17.1.2.4 MnM view
- 17.1.2.4.1 Key strengths/Right to win
- 17.1.2.4.2 Strategic choices
- 17.1.2.4.3 Weaknesses/Competitive threats
- 17.1.3 STEINERT
- 17.1.3.1 Business overview
- 17.1.3.2 Products/Solutions/Services offered
- 17.1.3.3 Recent developments
- 17.1.3.3.1 Product launches
- 17.1.3.3.2 Deals
- 17.1.3.3.3 Expansions
- 17.1.3.4 MnM view
- 17.1.3.4.1 Key strengths/Right to win
- 17.1.3.4.2 Strategic choices
- 17.1.3.4.3 Weaknesses/Competitive threats
- 17.1.4 SESOTEC GROUP
- 17.1.4.1 Business overview
- 17.1.4.2 Products/Solutions/Services offered
- 17.1.4.3 Recent developments
- 17.1.4.3.1 Product launches
- 17.1.4.3.2 Deals
- 17.1.4.4 MnM view
- 17.1.4.4.1 Key strengths/Right to win
- 17.1.4.4.2 Strategic choices
- 17.1.4.4.3 Weaknesses/Competitive threats
- 17.1.5 PELLENC ST
- 17.1.5.1 Business overview
- 17.1.5.2 Products/Solutions/Services offered
- 17.1.5.3 Recent developments
- 17.1.5.3.1 Product launches
- 17.1.5.3.2 Deals
- 17.1.5.3.3 Expansions
- 17.1.5.4 MnM view
- 17.1.5.4.1 Key strengths/Right to win
- 17.1.5.4.2 Strategic choices
- 17.1.5.4.3 Weaknesses/Competitive threats
- 17.1.6 HEFEI MEYER OPTOELECTRONIC TECHNOLOGY INC.
- 17.1.6.1 Business overview
- 17.1.6.2 Products/Solutions/Services offered
- 17.1.6.3 Recent developments
- 17.1.6.3.1 Deals
- 17.1.6.3.2 Expansions
- 17.1.7 BINDER+CO
- 17.1.7.1 Business overview
- 17.1.7.2 Products/Solutions/Services offered
- 17.1.8 SATAKE CORPORATION
- 17.1.8.1 Business overview
- 17.1.8.2 Products/Solutions/Services offered
- 17.1.8.3 Recent developments
- 17.1.8.3.1 Product launches
- 17.1.8.3.2 Deals
- 17.1.9 HEFEI TAIHE INTELLIGENT TECHNOLOGY CO., LTD.
- 17.1.9.1 Business overview
- 17.1.9.2 Products/Solutions/Services offered
- 17.1.10 CP MANUFACTURING, LLC
- 17.1.10.1 Business overview
- 17.1.10.2 Products/Solutions/Services offered
- 17.1.10.3 Recent developments
- 17.1.10.3.1 Product launches
- 17.1.10.3.2 Deals
- 17.1.10.3.3 Expansions
- 17.1.11 REDWAVE
- 17.1.11.1 Business overview
- 17.1.11.2 Products/Solutions/Services offered
- 17.1.11.3 Recent developments
- 17.1.11.3.1 Product launches
- 17.1.11.3.2 Deals
- 17.1.12 KEY TECHNOLOGY
- 17.1.12.1 Business overview
- 17.1.12.2 Products/Solutions/Services offered
- 17.1.12.3 Recent developments
- 17.1.12.3.1 Product launches
- 17.1.12.3.2 Deals
- 17.1.1 BUHLER
- 17.2 OTHER PLAYERS
- 17.2.1 NATIONAL RECOVERY TECHNOLOGIES, LLC
- 17.2.2 RAYTEC VISION SPA
- 17.2.3 ANGELON
- 17.2.4 MAF RODA AGROBOTIC
- 17.2.5 NEWTEC A/S
- 17.2.6 CIMBRIA
- 17.2.7 DAEWON GSI
- 17.2.8 ELICA ASM
- 17.2.9 TECHIK INSTRUMENT
- 17.2.10 ALLGAIER WERKE
- 17.2.11 UNITEC S.P.A.
- 17.2.12 AWETA
- 17.2.13 MACHINEX INDUSTRIES INC.
18 RESEARCH METHODOLOGY
- 18.1 RESEARCH DATA
- 18.1.1 SECONDARY DATA
- 18.1.1.1 List of key secondary sources
- 18.1.1.2 Key data from secondary sources
- 18.1.2 PRIMARY DATA
- 18.1.2.1 List of primary interview participants
- 18.1.2.2 Key data from primary sources
- 18.1.2.3 Breakdown of primaries
- 18.1.2.4 Key industry insights
- 18.1.3 SECONDARY AND PRIMARY RESEARCH
- 18.1.1 SECONDARY DATA
- 18.2 MARKET SIZE ESTIMATION
- 18.2.1 BOTTOM-UP APPROACH
- 18.2.1.1 Approach to arrive at market size using bottom-up analysis (demand side)
- 18.2.2 TOP-DOWN APPROACH
- 18.2.2.1 Approach to arrive at market size using top-down analysis (supply side)
- 18.2.1 BOTTOM-UP APPROACH
- 18.3 MARKET FORECAST APPROACH
- 18.3.1 SUPPLY SIDE
- 18.3.2 DEMAND SIDE
- 18.4 DATA TRIANGULATION
- 18.5 RESEARCH ASSUMPTIONS
- 18.6 RESEARCH LIMITATIONS
- 18.7 RISK ANALYSIS
19 APPENDIX
- 19.1 DISCUSSION GUIDE
- 19.2 KNOWLEDGESTORE: MARKETSANDMARKETS' SUBSCRIPTION PORTAL
- 19.3 CUSTOMIZATION OPTIONS
- 19.4 RELATED REPORTS
- 19.5 AUTHOR DETAILS
