|
시장보고서
상품코드
1984861
수처리 화학제품 시장 : 유형별, 원료별, 최종사용자별, 지역별 - 예측(-2030년)Water Treatment Chemicals Market by Type (Flocculants & Coagulants, Corrosion Inhibitors, Scale Inhibitors, Biocides & Disinfectants, Chelating Agents), Source, End User (Residential, Commercial & Industrial), And Region - Global Forecast to 2030 |
||||||
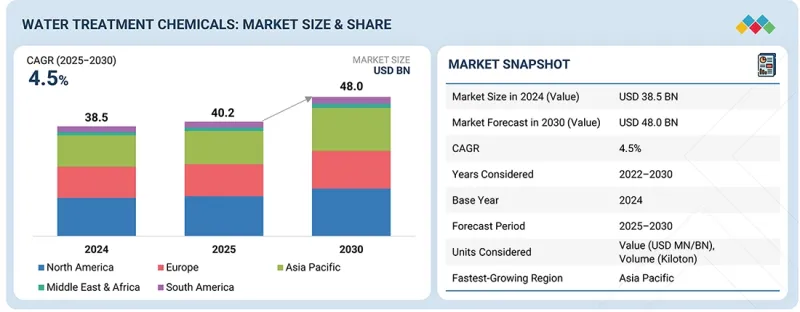
세계의 수처리 화학제품 시장 규모는 2025년 402억 달러에서 2030년까지 480억 달러에 이를 것으로 예측되어 예측 기간에 CAGR로 4.5%의 성장이 전망되고 있습니다.
| 조사 범위 | |
|---|---|
| 조사 대상 기간 | 2022-2031년 |
| 기준 연도 | 2025년 |
| 예측 기간 | 2026-2031년 |
| 단위 | 100만 달러, 개(Unit) |
| 부문 | 유형, 원료, 최종사용자, 용도, 지역 |
| 대상 지역 | 북미, 유럽, 아시아태평양, 남미, 기타 지역 |
냉각수 처리는 여러 고성장 산업에서 폭넓은 적용 가능성과 지속적인 운영 수요로 인해 수처리 화학물질 시장에서 용도별 시장 점유율 2위를 차지할 것으로 예측됩니다. 발전소, 정유공장, 석유화학 콤비나트, 제조시설, 상업용 건물, 데이터센터는 모두 주요 열부하를 처리하기 위해 지속적인 열 제거 능력을 유지할 수 있는 냉각 시스템이 필요합니다. 이러한 시스템은 물의 지속적인 순환을 통해 작동하기 때문에 스케일, 부식, 바이오 파울링, 미생물 증식 등의 지속적인 문제가 발생하여 화학적 처리가 필요합니다. 환경 규제를 충족하기 위해 물 소비를 줄이는 고순환 냉각 시스템의 채택이 증가함에 따라 용존 고형물 농도가 높아지고 시스템 당 화학물질 수요도 증가하고 있습니다.

"최종 사용자별로는 주택 부문이 예측 기간 동안 금액 기준으로 두 번째로 큰 시장 점유율을 차지할 것으로 예측됩니다. "
주거용 최종 사용자 부문은 가정용 물 소비 및 수질 관리와 관련된 대규모의 지속적인 수요 기반에 힘입어 수처리제 시장에서 두 번째로 큰 점유율을 차지할 것으로 예측됩니다. 신흥 시장의 주택 개발 및 도시화는 도시 상수도 시스템에 대한 수요 증가를 가져왔고, 그 결과 식수 처리, 배수지 보존 및 폐수 처리에 사용되는 약품에 대한 수요가 증가하고 있습니다. 각지의 노후화된 배관과 불안정한 급수의 조합은 오염, 부식, 바이오필름의 발생 위험을 높이는 상황을 만들어내고 있으며, 소독제, 부식방지제, pH 조절제를 통한 처리가 필요합니다. 식수 안전에 대한 대중의 인식이 높아짐에 따라 위생 습관과 수인성 전염병 전파에 대한 우려로 인해 지자체는 수처리 규제를 강화하고 있으며, 그 결과 가정용 화학제품에 대한 요구가 증가하고 있습니다.
"지역별로는 중동 및 아프리카가 예측 기간 동안 금액 기준으로 수처리 화학제품 시장에서 두 번째로 높은 성장률을 보일 것으로 예측됩니다. "
시장 전망에 따르면, 중동 및 아프리카의 수처리약품 시장은 구조적인 물 부족과 급속한 처리능력 확대, 투자 정책으로 인해 기존 시장과 다른 성장 여건이 형성되어 지역별로 두 번째로 높은 성장률을 나타낼 것으로 예측됩니다. 이 지역은 해수 담수화, 염수 처리, 폐수 재사용 등 비재래식 수자원에 의존하고 있습니다. 이러한 공정은 화학물질을 많이 사용하기 때문에 스케일 방지제, 부식 방지제, 특수 첨가제가 필요합니다. 신도시, 산업 회랑, 정유공장, 발전소 건설은 설계 초기 단계부터 수처리 시스템을 통합하여 전체 프로젝트에서 화학물질 소비를 증가시키고 있습니다. 아프리카의 도시 인구 증가와 전기화 프로그램은 화학물질 사용 수준이 낮은 도시 상하수도 및 폐수 처리에 대한 투자를 촉진하여 화학물질 사용에 대한 강력한 수요를 창출할 것으로 예측됩니다.
세계의 수처리약품 시장에 대해 조사 분석했으며, 주요 촉진요인 및 저해요인, 제품 개발 및 혁신, 경쟁 구도 등의 정보를 전해드립니다.
자주 묻는 질문
목차
제1장 서론
제2장 주요 요약
제3장 중요 지견
제4장 시장 개요
제5장 기술 진보, AI의 영향, 특허, 혁신, 향후 용도
제6장 규제 상황과 지속가능성 이니셔티브
제7장 고객 현황과 구매 행동
제8장 수처리 화학제품 시장 : 원료별
제9장 수처리 화학제품 시장 : 용도별
제10장 수처리 화학제품 시장 : 유형별
제11장 수처리 화학제품 시장 : 최종사용자별
제12장 수처리 화학제품 시장 : 지역별
제13장 경쟁 구도
제14장 기업 개요
제15장 조사 방법
제16장 부록
LSH 26.04.13The water treatment chemicals market is projected to grow from USD 40.2 billion in 2025 to USD 48.0 billion by 2030, at a CAGR of 4.5% during the forecast period.
| Scope of the Report | |
|---|---|
| Years Considered for the Study | 2022-2031 |
| Base Year | 2025 |
| Forecast Period | 2026-2031 |
| Units Considered | Value (USD million) and volume (no. of units) |
| Segments | By Type, Source, End User, Application and Region |
| Regions covered | North America, Europe, Asia Pacific, South America, and Rest of the World (RoW) |
Cooling water treatment is expected to account for the second-largest market share by application in the water treatment chemicals market, driven by its broad applicability across multiple high-growth industries and continuous operational demand. The power plants, refineries, petrochemical complexes, manufacturing facilities, commercial buildings, and data centers all require cooling systems that maintain continuous heat removal capacity to handle their major thermal loads. The systems operate through continuous water circulation, which results in ongoing complications from scaling, corrosion, biofouling, and microbial growth that require chemical treatment. The increasing adoption of high-cycle cooling systems, which reduce water consumption to meet environmental regulations, results in more concentrated dissolved solids and higher chemical requirements per system.
''Based on end user, the residential segment is expected to have the second-largest market share, in terms of value, during the forecast period.''
The residential end-user segment is expected to hold the second-largest share in the water treatment chemicals market, driven by a large, consistently recurring demand base tied to household water consumption and quality management. The housing development, together with urbanization, in emerging markets results in increased demand for municipal water systems, leading to higher chemical requirements for drinking water treatment, safeguarding distribution systems, and wastewater processing. The combination of old pipelines and irregular water supply across various areas creates conditions that increase the likelihood of contamination, corrosion, and biofilm development, requiring treatment with disinfectants, corrosion protectors, and pH-regulating substances. The rising public understanding of drinking water safety, along with hygiene practices and waterborne disease transmission, has led municipalities to enforce stricter water treatment regulations, resulting in higher residential chemical requirements.
"Based on region, the Middle East & Africa is expected to have the second fastest-growing market for water treatment chemicals, in terms of value, during the forecast period."
The water treatment chemicals market in the Middle East and Africa will experience the second-highest regional growth, according to market projections, driven by structural water shortages and rapid capacity expansions and investment policies, which create growth conditions distinct from those in established markets. The region depends on non-conventional water sources, including seawater desalination, brackish water treatment, and treated wastewater reuse, because these processes are chemical-intensive and require antiscalants, corrosion inhibitors, and specialty additives. The construction of new cities, industrial corridors, refineries, and power plants includes water treatment systems from the earliest design stage, leading to higher chemical consumption across the projects. The growing urban population in Africa, together with electrification programs, will boost municipal water supply and wastewater treatment investments that use chemicals at a low level of adoption, thereby creating a strong need for chemical use.
This study has been validated through primary interviews with industry experts globally. These primary sources have been divided into the following three categories:
- By Company Type: Tier 1 - 60%, Tier 2 - 20%, and Tier 3 - 20%
- By Designation: C Level - 33%, Director Level - 33%, and Managers - 34%
- By Region: North America 20%, Europe 25%, Asia Pacific 25%, the Middle East & Africa - 15%, and Latin America - 15%
The report provides a comprehensive analysis of company profiles:
Prominent companies include Kemira (Finland), Ecolab (US), Veolia (France), BASF (Germany), Dow Inc (US), Solenis (US), Nouryon (Netherlands), Kurita Water Industries Ltd. (Japan), SNF Floerger (France), and Baker Hughes Company (US), among others.
Research Coverage
This research report categorizes the water treatment chemicals market by type (flocculants & coagulants, corrosion inhibitors, scale inhibitors, biocides & disinfectants, chelating agents, anti-foaming agents, pH stabilizers & adjusters, others), source (synthetic, bio-based), application (boiler water treatment, cooling water treatment, raw water treatment, water desalination, others), end user (residential, commercial, industrial), and region (North America, Europe, Asia Pacific, Middle East & Africa, and South America). The scope of the report includes detailed information about the major factors influencing the growth of the water treatment chemicals market, such as drivers, restraints, challenges, and opportunities. A thorough examination of key industry players has been conducted to provide insights into their business overviews, solutions, services, key strategies, contracts, partnerships, and agreements. Product launches, mergers & acquisitions, and recent developments in the water treatment chemical market are all covered. This report includes a competitive analysis of upcoming startups in the water treatment chemicals market ecosystem.
Reasons to buy this report:
The report will help market leaders/new entrants in this market by providing information on the closest approximations of revenue for the overall water treatment chemicals market and its subsegments. This report will help stakeholders understand the competitive landscape and gain deeper insights to better position their businesses and plan suitable go-to-market strategies. The report also helps stakeholders understand the market pulse and provides information on key drivers, restraints, challenges, and opportunities.
The report provides insights on the following pointers:
- Analysis of key drivers (Increasing demand for chemically treated water in various end-use industries, Growing focus on water reuse and scarcity management), restraints (Availability of alternative water treatment technologies, High cost of water treatment processes) opportunities (Growing population and rapid urbanization in emerging economies, Increasing demand for specialty formulations), and challenges (Difficulties associated with eco-friendly formulations).
- Product Development/Innovation: Detailed insights on upcoming technologies, research & development activities, and service launches in the water treatment chemicals market.
- Market Development: Comprehensive information about lucrative markets - the report analyzes the water treatment chemicals market across varied regions.
- Market Diversification: Exhaustive information about services, untapped geographies, recent developments, and investments in the water treatment chemicals market
- Competitive Assessment: In-depth assessment of market shares, growth strategies and service offerings of leading players like Kemira (Finland), Ecolab (US), Veolia (France), BASF (Germany), Dow Inc (US), Solenis (US), Nouryon (Netherlands), Kurita Water Industries Ltd. (Japan), SNF Floerger (France), and Baker Hughes Company (US), among others in the water treatment chemicals market.
TABLE OF CONTENTS
1 INTRODUCTION
- 1.1 STUDY OBJECTIVES
- 1.2 MARKET DEFINITION
- 1.3 STUDY SCOPE
- 1.3.1 WATER TREATMENT CHEMICALS MARKET SEGMENTATION AND REGIONAL SCOPE
- 1.3.2 INCLUSIONS AND EXCLUSIONS
- 1.3.3 YEARS CONSIDERED
- 1.3.4 CURRENCY CONSIDERED
- 1.3.5 UNITS CONSIDERED
- 1.4 STAKEHOLDERS
- 1.5 SUMMARY OF CHANGES
2 EXECUTIVE SUMMARY
- 2.1 KEY MARKET PARTICIPANTS: MAPPING OF STRATEGIC DEVELOPMENTS
- 2.2 DISRUPTIVE TRENDS IN WATER TREATMENT CHEMICALS MARKET
- 2.3 HIGH-GROWTH SEGMENTS
- 2.4 REGIONAL SNAPSHOT: MARKET SIZE, GROWTH RATE, AND FORECAST
3 PREMIUM INSIGHTS
- 3.1 ATTRACTIVE OPPORTUNITIES FOR PLAYERS IN WATER TREATMENT CHEMICALS MARKET
- 3.2 WATER TREATMENT CHEMICALS MARKET, BY SOURCE
- 3.3 WATER TREATMENT CHEMICALS MARKET, BY APPLICATION
- 3.4 WATER TREATMENT CHEMICALS MARKET, BY TYPE
- 3.5 WATER TREATMENT CHEMICALS MARKET, BY END USER
- 3.6 WATER TREATMENT CHEMICALS MARKET, BY COUNTRY
4 MARKET OVERVIEW
- 4.1 INTRODUCTION
- 4.2 MARKET DYNAMICS
- 4.2.1 DRIVERS
- 4.2.1.1 Increasing demand for chemically treated water in various end-use industries
- 4.2.1.2 Growing focus on water reuse and scarcity management
- 4.2.1.3 Stringent water and wastewater regulations
- 4.2.1.4 Rising public health awareness and prevention of waterborne diseases
- 4.2.1.5 Rising demand for water treatment chemicals due to increasing water pollution
- 4.2.2 RESTRAINTS
- 4.2.2.1 Increasing scrutiny on toxicity and long-term ecological impact
- 4.2.2.2 Availability of alternative water treatment technologies
- 4.2.2.3 High cost of water treatment processes
- 4.2.3 OPPORTUNITIES
- 4.2.3.1 Rising investments in smart water management and industrial water optimization
- 4.2.3.2 Growing population and rapid urbanization in emerging economies
- 4.2.3.3 Increasing demand for specialty formulations
- 4.2.3.4 Rising need for water recycling and reuse
- 4.2.4 CHALLENGES
- 4.2.4.1 Disposal challenges of chemical sludge and treatment residues
- 4.2.4.2 Difficulties associated with eco-friendly formulations
- 4.2.1 DRIVERS
- 4.3 UNMET NEEDS AND WHITE SPACES
- 4.3.1 UNMET NEEDS IN WATER TREATMENT CHEMICALS MARKET
- 4.3.2 WHITE SPACE OPPORTUNITIES
- 4.4 INTERCONNECTED MARKETS AND CROSS-SECTOR OPPORTUNITIES
- 4.4.1 INTERCONNECTED MARKETS
- 4.4.2 CROSS-SECTOR OPPORTUNITIES
- 4.5 STRATEGIC MOVES BY TIER-1/2/3 PLAYERS
- 4.5.1 KEY MOVES AND STRATEGIC FOCUS
- 4.6 PORTER'S FIVE FORCES ANALYSIS
- 4.6.1 THREAT OF NEW ENTRANTS
- 4.6.2 THREAT OF SUBSTITUTES
- 4.6.3 BARGAINING POWER OF SUPPLIERS
- 4.6.4 BARGAINING POWER OF BUYERS
- 4.6.5 INTENSITY OF COMPETITIVE RIVALRY
- 4.7 VALUE CHAIN ANALYSIS
- 4.8 ECOSYSTEM
- 4.9 PRICING ANALYSIS
- 4.9.1 AVERAGE SELLING PRICE, BY KEY PLAYER
- 4.9.2 AVERAGE SELLING PRICE, BY REGION
- 4.9.3 AVERAGE SELLING PRICE, BY APPLICATION
- 4.10 MACROECONOMIC INDICATORS
- 4.10.1 GLOBAL GDP TRENDS
- 4.11 IMPACT OF 2025 US TARIFFS ON WATER TREATMENT CHEMICALS MARKET
- 4.11.1 INTRODUCTION
- 4.11.2 KEY TARIFF RATES
- 4.11.3 PRICE IMPACT ANALYSIS
- 4.11.4 IMPACT ON COUNTRIES/REGIONS
- 4.11.4.1 US
- 4.11.4.2 Europe
- 4.11.4.3 Asia Pacific
- 4.11.5 IMPACT ON END-USE INDUSTRIES
- 4.12 TRADE ANALYSIS
- 4.12.1 IMPORT SCENARIO (HS CODE 842121)
- 4.12.2 EXPORT SCENARIO (HS CODE 842121)
- 4.12.3 IMPORT SCENARIO (HS CODE 382499)
- 4.12.4 EXPORT SCENARIO (HS CODE 382499)
- 4.13 TRENDS/DISRUPTIONS IMPACTING CUSTOMER BUSINESS
- 4.14 INVESTMENT AND FUNDING SCENARIO
- 4.15 CASE STUDIES
- 4.15.1 IMPROVING MILL WATER TREATMENT EFFICIENCY USING ADVANCED COAGULANTS
- 4.15.2 RAW WATER TREATMENT OPTIMIZATION BY NALCO WATER IN US TISSUE MILL
- 4.15.3 KEMIRA DESIGNS EFFECTIVE WATER TREATMENT SOLUTION FOR PAPER MILL
- 4.16 KEY CONFERENCES & EVENTS, 2026-2027
5 TECHNOLOGICAL ADVANCEMENTS, AI-DRIVEN IMPACT, PATENTS, INNOVATIONS, AND FUTURE APPLICATIONS
- 5.1 TECHNOLOGY ANALYSIS
- 5.1.1 KEY TECHNOLOGIES
- 5.1.1.1 Advanced oxidation process technology
- 5.1.1.2 Biosphere chlorine stabilizers for biofilm control
- 5.1.2 COMPLEMENTARY TECHNOLOGIES
- 5.1.2.1 Smart metering and leak detection technology
- 5.1.3 ADJACENT TECHNOLOGIES
- 5.1.3.1 Sewage mining and water reuse for irrigation
- 5.1.1 KEY TECHNOLOGIES
- 5.2 TECHNOLOGY/PRODUCT ROADMAP
- 5.2.1 UPSTREAM TECHNOLOGY ROADMAP: FEEDSTOCK, FORMULATION, AND PRODUCTION
- 5.2.2 FUEL, WATER, AND EMISSIONS MANAGEMENT PRODUCT ROADMAP
- 5.2.3 PRODUCTION, WATER, AND EMISSIONS MANAGEMENT PRODUCT ROADMAP
- 5.3 PATENT ANALYSIS
- 5.3.1 LEGAL STATUS OF PATENTS
- 5.3.2 JURISDICTION ANALYSIS
- 5.4 FUTURE APPLICATIONS
- 5.4.1 ADVANCED WATER REUSE & CIRCULAR WATER SYSTEMS
- 5.4.2 DESALINATION & BRACKISH WATER TREATMENT
- 5.4.3 TREATMENT OF EMERGING AND PERSISTENT CONTAMINANTS
- 5.4.4 SUPPORT FOR MEMBRANE AND ADVANCED FILTRATION TECHNOLOGIES
- 5.4.5 COOLING WATER AND PROCESS WATER MANAGEMENT IN INDUSTRIAL FACILITIES
- 5.5 IMPACT OF AI/GEN AI ON WATER TREATMENT CHEMICALS MARKET
- 5.5.1 TOP USE CASES AND MARKET POTENTIAL
- 5.5.2 BEST PRACTICES IN WATER TREATMENT CHEMICALS PROCESSING
- 5.5.3 CASE STUDIES OF AI IMPLEMENTATION IN WATER TREATMENT CHEMICALS MARKET
- 5.5.4 INTERCONNECTED ADJACENT ECOSYSTEM AND IMPACT ON MARKET PLAYERS
- 5.5.5 CLIENTS' READINESS TO ADOPT GENERATIVE AI IN WATER TREATMENT MARKET
6 REGULATORY LANDSCAPE AND SUSTAINABILITY INITIATIVES
- 6.1 REGIONAL REGULATIONS AND COMPLIANCE
- 6.1.1 REGULATORY BODIES, GOVERNMENT AGENCIES, AND OTHER ORGANIZATIONS
- 6.1.2 INDUSTRY STANDARDS
- 6.2 SUSTAINABILITY INITIATIVES
- 6.3 IMPACT OF REGULATORY POLICIES AND SUSTAINABILITY INITIATIVES
- 6.4 CERTIFICATIONS, LABELING, AND ECO-STANDARDS
7 CUSTOMER LANDSCAPE & BUYER BEHAVIOR
- 7.1 INTRODUCTION
- 7.2 DECISION-MAKING PROCESS
- 7.3 KEY STAKEHOLDERS AND BUYING CRITERIA
- 7.3.1 KEY STAKEHOLDERS IN BUYING PROCESS
- 7.3.2 BUYING CRITERIA
- 7.4 ADOPTION BARRIERS & INTERNAL CHALLENGES
- 7.5 UNMET NEEDS IN VARIOUS END-USE INDUSTRIES
- 7.6 MARKET PROFITABILITY
- 7.6.1 REVENUE POTENTIAL
- 7.6.2 COST DYNAMICS
- 7.6.3 MARGIN OPPORTUNITIES IN KEY END-USE INDUSTRIES
8 WATER TREATMENT CHEMICALS MARKET, BY SOURCE
- 8.1 INTRODUCTION
- 8.2 BIO-BASED
- 8.2.1 INCREASE IN DEMAND TO REDUCE ENVIRONMENTAL IMPACT
- 8.3 SYNTHETIC
- 8.3.1 SYNTHETIC CUSTOMIZATION IN AGRICULTURE TO ELECTRONICS AND MANUFACTURING SECTORS
9 WATER TREATMENT CHEMICALS MARKET, BY APPLICATION
- 9.1 INTRODUCTION
- 9.2 BOILER WATER TREATMENT
- 9.2.1 PREVENTION OF SCALE FORMATION, CORROSION, AND MICROBIOLOGICAL GROWTH
- 9.3 COOLING WATER TREATMENT
- 9.3.1 LOWERING OPERATIONAL COSTS AND IMPROVING COOLING EFFICIENCY OF COOLING SYSTEMS
- 9.4 RAW WATER TREATMENT
- 9.4.1 HIGH DEMAND FOR REMOVING IMPURITIES
- 9.5 WATER DESALINATION
- 9.5.1 GROWING DEMAND FOR DESALINATION DUE TO FRESHWATER SCARCITY
- 9.6 OTHER APPLICATIONS
10 WATER TREATMENT CHEMICALS MARKET, BY TYPE
- 10.1 INTRODUCTION
- 10.2 COAGULANTS & FLOCCULANTS
- 10.2.1 EFFECTIVENESS IN CLARIFYING WATER AND REMOVING TURBIDITY AND HEAVY METALS
- 10.2.2 ORGANIC COAGULANTS
- 10.2.2.1 Polyamine
- 10.2.2.2 PolyDADMAC
- 10.2.3 INORGANIC COAGULANTS
- 10.2.3.1 Aluminum sulfate
- 10.2.3.2 Polyaluminum chloride
- 10.2.3.3 Ferric chloride
- 10.2.3.4 Other inorganic coagulants
- 10.2.4 FLOCCULANTS
- 10.2.4.1 Anionic flocculants
- 10.2.4.2 Cationic flocculants
- 10.2.4.3 Non-ionic flocculants
- 10.2.4.4 Amphoteric flocculants
- 10.3 CORROSION INHIBITORS
- 10.3.1 INCREASED NEED FOR WATER RECYCLING
- 10.3.2 ANODIC INHIBITORS
- 10.3.3 CATHODIC INHIBITORS
- 10.4 SCALE INHIBITORS
- 10.4.1 PREVENTION OF SCALE DEPOSITS IN EQUIPMENT
- 10.4.2 PHOSPHONATES
- 10.4.3 CARBOXYLATES/ACRYLIC
- 10.4.4 OTHER SCALE INHIBITORS
- 10.5 BIOCIDES & DISINFECTANTS
- 10.5.1 HIGH DEMAND FOR REMOVAL OF CONTAMINANTS FROM WATER
- 10.5.2 OXIDIZING
- 10.5.3 NON-OXIDIZING
- 10.5.4 DISINFECTANTS
- 10.6 CHELATING AGENTS
- 10.6.1 BINDING WITH METAL IONS IN WATER, PREVENTING CORROSION, PRECIPITATION, OR SCALE FORMATION
- 10.7 ANTI-FOAMING AGENTS
- 10.7.1 ENSURING PROCESS EFFICIENCY AND REDUCING MAINTENANCE REQUIREMENTS & SAFETY HAZARDS
- 10.8 PH ADJUSTERS & STABILIZERS
- 10.8.1 MAINTENANCE OF PH LEVELS DURING DISINFECTION, COAGULATION, AND CORROSION CONTROL PROCESSES
- 10.9 OTHER TYPES
11 WATER TREATMENT CHEMICALS MARKET, BY END USER
- 11.1 INTRODUCTION
- 11.2 RESIDENTIAL
- 11.2.1 INCREASE IN NEED FOR TREATED WATER TO DRIVE DEMAND FOR CHEMICALS
- 11.3 COMMERCIAL
- 11.3.1 SAFEGUARDING EQUIPMENT, ENSURING REGULATORY COMPLIANCE, AND MAINTAINING WATER QUALITY TO DRIVE MARKET
- 11.3.2 HOTELS & RESTAURANTS
- 11.3.3 HOSPITALS
- 11.3.4 OFFICE SPACES
- 11.3.5 SWIMMING POOLS
- 11.3.6 OTHER COMMERCIAL END USERS
- 11.4 INDUSTRIAL
- 11.4.1 REGULATORY COMPLIANCE, PROCESS OPTIMIZATION, AND CORROSION & SCALE PREVENTION TO DRIVE MARKET
- 11.4.2 MUNICIPAL
- 11.4.3 POWER
- 11.4.4 OIL & GAS
- 11.4.5 MINING & MINERAL PROCESSING
- 11.4.6 CHEMICALS & FERTILIZERS
- 11.4.7 FOOD & BEVERAGE
- 11.4.8 PULP & PAPER
- 11.4.9 OTHER INDUSTRIAL END USERS
12 WATER TREATMENT CHEMICALS MARKET, BY REGION
- 12.1 INTRODUCTION
- 12.2 NORTH AMERICA
- 12.2.1 US
- 12.2.1.1 Rising demand from power generation industry
- 12.2.2 CANADA
- 12.2.2.1 Rapid growth of oil & gas industry
- 12.2.3 MEXICO
- 12.2.3.1 Urbanization, industrial growth, and improved water & environmental regulations
- 12.2.1 US
- 12.3 EUROPE
- 12.3.1 GERMANY
- 12.3.1.1 Extensive municipal systems and water-intensive industrial base
- 12.3.2 ITALY
- 12.3.2.1 Investments in upgrading systems
- 12.3.3 FRANCE
- 12.3.3.1 Industrial water recycling and re-use projects
- 12.3.4 SPAIN
- 12.3.4.1 Growing focus on water reuse
- 12.3.5 UK
- 12.3.5.1 Government focus on sustainability
- 12.3.6 RUSSIA
- 12.3.6.1 Significant use in energy, metal, and chemical industries
- 12.3.7 REST OF EUROPE
- 12.3.1 GERMANY
- 12.4 ASIA PACIFIC
- 12.4.1 CHINA
- 12.4.1.1 Largest market for water treatment chemicals
- 12.4.2 INDIA
- 12.4.2.1 Growth of sewage treatment facilities and drinking water system expansion
- 12.4.3 JAPAN
- 12.4.3.1 Industrial sector to drive demand
- 12.4.4 SOUTH KOREA
- 12.4.4.1 Expansion of electronics industry
- 12.4.5 INDONESIA
- 12.4.5.1 Public and donor-funded investments in new treatment facilities
- 12.4.6 REST OF ASIA PACIFIC
- 12.4.1 CHINA
- 12.5 MIDDLE EAST & AFRICA
- 12.5.1 GCC COUNTRIES
- 12.5.1.1 Saudi Arabia
- 12.5.1.1.1 New cities, industrial zones, and tourism development
- 12.5.1.2 UAE
- 12.5.1.2.1 Focus on water recycling, energy-saving solutions, and modern desalination technologies
- 12.5.1.3 Rest of GCC countries
- 12.5.1.1 Saudi Arabia
- 12.5.2 SOUTH AFRICA
- 12.5.2.1 Growing mining & power generation industry
- 12.5.3 EGYPT
- 12.5.3.1 High demand from agriculture sector
- 12.5.4 REST OF MIDDLE EAST & AFRICA
- 12.5.1 GCC COUNTRIES
- 12.6 SOUTH AMERICA
- 12.6.1 BRAZIL
- 12.6.1.1 Population scale, industrial base, and ongoing sanitation reforms
- 12.6.2 ARGENTINA
- 12.6.2.1 Growing food & beverage industry
- 12.6.3 REST OF SOUTH AMERICA
- 12.6.1 BRAZIL
13 COMPETITIVE LANDSCAPE
- 13.1 INTRODUCTION
- 13.1.1 KEY PLAYER STRATEGIES/RIGHT TO WIN, 2021-2025
- 13.2 REVENUE ANALYSIS, 2022-2024
- 13.3 MARKET SHARE ANALYSIS, 2024
- 13.4 COMPANY VALUATION AND FINANCIAL METRICS
- 13.5 PRODUCT COMPARISON
- 13.6 COMPANY EVALUATION MATRIX: KEY PLAYERS, 2024
- 13.6.1 STARS
- 13.6.2 EMERGING LEADERS
- 13.6.3 PERVASIVE PLAYERS
- 13.6.4 PARTICIPANTS
- 13.6.5 COMPANY FOOTPRINT: KEY PLAYERS
- 13.6.5.1 Company footprint
- 13.6.5.2 Region footprint
- 13.6.5.3 Source footprint
- 13.6.5.4 Type footprint
- 13.6.5.5 Application footprint
- 13.6.5.6 End user footprint
- 13.7 COMPANY EVALUATION MATRIX: STARTUPS/SMES, 2024
- 13.7.1 PROGRESSIVE COMPANIES
- 13.7.2 RESPONSIVE COMPANIES
- 13.7.3 DYNAMIC COMPANIES
- 13.7.4 STARTING BLOCKS
- 13.7.5 COMPETITIVE BENCHMARKING
- 13.7.5.1 Detailed list of key startups/SMEs
- 13.7.5.2 Competitive benchmarking of startups/SMEs
- 13.8 COMPETITIVE SCENARIO
- 13.8.1 PRODUCT LAUNCHES
- 13.8.2 DEALS
- 13.8.3 EXPANSIONS
14 COMPANY PROFILES
- 14.1 KEY PLAYERS
- 14.1.1 ECOLAB
- 14.1.1.1 Business overview
- 14.1.1.2 Products/Solutions/Services offered
- 14.1.1.2.1 Deals
- 14.1.1.2.2 Expansions
- 14.1.1.3 MNM view
- 14.1.1.3.1 Right to win
- 14.1.1.3.2 Strategic choices
- 14.1.1.3.3 Weaknesses and competitive threats
- 14.1.2 VEOLIA
- 14.1.2.1 Business overview
- 14.1.2.2 Products/Solutions/Services offered
- 14.1.2.3 Recent developments
- 14.1.2.3.1 Deals
- 14.1.2.3.2 Other developments
- 14.1.2.3.3 Expansions
- 14.1.2.4 MNM view
- 14.1.2.4.1 Right to win
- 14.1.2.4.2 Strategic choices
- 14.1.2.4.3 Weaknesses and competitive threats
- 14.1.3 BASF
- 14.1.3.1 Business overview
- 14.1.3.2 Products/Solutions/Services offered
- 14.1.3.3 Recent developments
- 14.1.3.3.1 Deals
- 14.1.3.3.2 Expansions
- 14.1.3.3.3 Other developments
- 14.1.3.4 MNM view
- 14.1.3.4.1 Right to win
- 14.1.3.4.2 Strategic choices
- 14.1.3.4.3 Weaknesses and competitive threats
- 14.1.4 DOW INC.
- 14.1.4.1 Business overview
- 14.1.4.2 Products/Solutions/Services offered
- 14.1.4.3 Recent developments
- 14.1.4.3.1 Product launches
- 14.1.4.3.2 Deals
- 14.1.4.4 MNM view
- 14.1.4.4.1 Right to win
- 14.1.4.4.2 Strategic choices
- 14.1.4.4.3 Weaknesses and competitive threats
- 14.1.5 KEMIRA
- 14.1.5.1 Business overview
- 14.1.5.2 Products/Solutions/Services offered
- 14.1.5.3 Recent developments
- 14.1.5.3.1 Deals
- 14.1.5.3.2 Expansions
- 14.1.5.4 MnM view
- 14.1.5.4.1 Right to win
- 14.1.5.4.2 Strategic choices
- 14.1.5.4.3 Weaknesses and competitive threats
- 14.1.6 SOLENIS
- 14.1.6.1 Business overview
- 14.1.6.2 Products/Solutions/Services offered
- 14.1.6.3 Recent developments
- 14.1.6.3.1 Deals
- 14.1.6.3.2 Other developments
- 14.1.6.4 MnM view
- 14.1.7 SOLVAY
- 14.1.7.1 Business overview
- 14.1.7.2 Products/Solutions/Services offered
- 14.1.7.3 Recent developments
- 14.1.7.3.1 Deals
- 14.1.7.4 MnM view
- 14.1.8 NOURYON
- 14.1.8.1 Business overview
- 14.1.8.2 Products/Solutions/Services offered
- 14.1.8.2.1 Deals
- 14.1.8.2.2 Expansions
- 14.1.8.3 MnM view
- 14.1.9 KURITA WATER INDUSTRIES LTD.
- 14.1.9.1 Business overview
- 14.1.9.2 Products/Solutions/Services offered
- 14.1.9.3 Recent developments
- 14.1.9.3.1 Deals
- 14.1.9.3.2 Expansions
- 14.1.9.4 MnM view
- 14.1.10 SNF FLOERGER
- 14.1.10.1 Business overview
- 14.1.10.2 Products/Solutions/Services offered
- 14.1.10.3 Recent developments
- 14.1.10.3.1 Deals
- 14.1.10.4 MnM view
- 14.1.11 SYENSQO
- 14.1.11.1 Business overview
- 14.1.11.2 Products/Solutions/Services offered
- 14.1.11.3 MnM view
- 14.1.12 ARXADA
- 14.1.12.1 Business overview
- 14.1.12.2 Products/Solutions/Services offered
- 14.1.12.3 Recent developments
- 14.1.12.3.1 Deals
- 14.1.12.4 MnM view
- 14.1.13 CORTEC CORPORATION
- 14.1.13.1 Business overview
- 14.1.13.2 Products/Solutions/Services offered
- 14.1.13.3 MnM view
- 14.1.1 ECOLAB
- 14.2 OTHER PLAYERS
- 14.2.1 ARIES CHEMICAL, INC.
- 14.2.2 BUCKMAN
- 14.2.3 DORF KETAL
- 14.2.4 FERALCO AB
- 14.2.5 GEO SPECIALTY CHEMICALS
- 14.2.6 HYDRITE CHEMICAL
- 14.2.7 INNOSPEC INC.
- 14.2.8 ION EXCHANGE (INDIA) LTD.
- 14.2.9 ITALMATCH CHEMICALS S.P.A.
- 14.2.10 IXOM
- 14.2.11 MCC CHEMICALS, INC.
- 14.2.12 ROEMEX LIMITED
- 14.2.13 THERMAX LIMITED
- 14.2.14 UNIPHOS CHEMICALS
15 RESEARCH METHODOLOGY
- 15.1 RESEARCH DATA
- 15.1.1 SECONDARY DATA
- 15.1.1.1 List of key secondary sources
- 15.1.1.2 Key data from secondary sources
- 15.1.2 PRIMARY DATA
- 15.1.2.1 Key data from primary sources
- 15.1.2.2 List of primary interview participants-demand and supply sides
- 15.1.2.3 Key industry insights
- 15.1.2.4 Breakdown of interviews with experts
- 15.1.1 SECONDARY DATA
- 15.2 MARKET SIZE ESTIMATION
- 15.2.1 BOTTOM-UP APPROACH & TOP-DOWN APPROACH
- 15.3 FORECAST NUMBER CALCULATION
- 15.4 DATA TRIANGULATION
- 15.5 FACTOR ANALYSIS
- 15.6 RESEARCH ASSUMPTIONS
- 15.7 RESEARCH LIMITATIONS & RISKS
16 APPENDIX
- 16.1 DISCUSSION GUIDE
- 16.2 KNOWLEDGESTORE: MARKETSANDMARKETS' SUBSCRIPTION PORTAL
- 16.3 CUSTOMIZATION OPTIONS
- 16.4 RELATED REPORTS
- 16.5 AUTHOR DETAILS

