|
시장보고서
상품코드
2024210
암모니아 시장 : 유형별, 판매 채널별, 최종 이용 산업별, 지역별 - 세계 예측(-2031년)Ammonia Market by Type (Anhydrous, Aqueous), Sales Channel (Direct and Indirect), End-use Industry (Agriculture, Textile, Refrigeration, Mining, and Pharmaceutical), and Region - Global Forecast to 2031 |
||||||
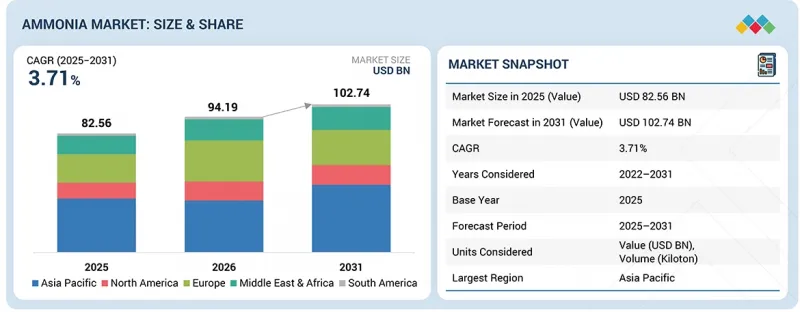
세계의 암모니아 시장 규모는 2025년 825억 6,000만 달러에서 2031년까지 1,027억 4,000만 달러에 달할 것으로 예측되며, 예측 기간 동안 CAGR로 3.71%의 성장이 전망됩니다.
| 조사 범위 | |
|---|---|
| 조사 대상 기간 | 2022-2031년 |
| 기준 연도 | 2025년 |
| 예측 기간 | 2026-2031년 |
| 단위 | 10억 달러, 킬로톤 |
| 부문 | 유형, 판매 채널, 최종 이용 산업, 지역 |
| 대상 지역 | 북미, 아시아태평양, 유럽, 중동 및 아프리카, 남미 |
암모니아 수요는 인구 증가와 식량 수요 확대에 따른 농업 소비 증가와 냉장 수요 증가에 의해 촉진되고 있습니다.

"수용액 부문은 예측 기간 동안 두 번째로 큰 부문이 될 것으로 예상됩니다."
시장에서 두 번째로 큰 암모니아 유형은 암모니아수이며, 그 주요 이유는 산업에서 광범위하게 사용되고 무수 암모니아에 비해 취급이 비교적 안전하다는 점입니다. 질소 농도가 낮기 때문에 벌크 비료 생산에는 사용할 수 없지만 수처리, 섬유, 섬유, 의약품, 세정용 화학제품 등 다른 산업에서 널리 사용되고 있습니다. 선진국의 규제 프레임워크는 작업 조건과 위험물 취급에 있어 안전성을 중시하는 방향으로 전환되고 있으며, 그 결과 휘발성이 낮고 보관 및 운송이 용이한 암모니아수의 사용이 촉진되고 있습니다. 이는 농업에서 대규모 사용이 아닌 소규모의 통제된 암모니아 사용을 필요로 하는 산업에 특히 적합한 선택입니다. 또한, 암모니아수는 질소산화물 선택적 촉매환원(SCR) 등 배출가스 규제 대책에도 사용되어 산업용 및 환경용으로 유용하게 사용되고 있습니다. 그러나 이러한 장점에도 불구하고 비료로서의 질소 공급 효율이 낮기 때문에 시장을 독점할 정도는 아닙니다. 농업이 여전히 세계 최대의 암모니아 수요처인 만큼 고농도 무수 암모니아가 주요 제품으로 수요를 유지하고 있으며, 암모니아수는 2위의 점유율을 차지하며 성장세를 이어가고 있는 분야입니다.
"간접 판매 부문이 예측 기간 동안 두 번째로 큰 부문이 될 것으로 예상됩니다."
간접 판매 채널은 1차 공급이 아닌 유통에서 중요하기 때문에 암모니아 시장에서 2번째로 큰 규모를 차지하고 있습니다. 벌크 암모니아는 일반적으로 제조업체에서 주요 비료 제조업체 및 산업 소비자에게 직접 판매되지만, 소규모 최종사용자, 특히 농업 종사자에게 공급할 때는 판매업자, 도매업자, 소매업자를 포함한 간접 경로가 필수적입니다. 많은 국가, 특히 개발도상국의 농부들은 암모니아로 만든 비료를 얻기 위해 현지 판매업체나 협동조합에 의존하고 있습니다. 이를 통해 라스트 마일 배송에서 간접판매가 필수적인 탄탄한 다운스트림 네트워크가 형성되고 있습니다. 이 부문은 농촌 인프라 개발, 농업 투입물의 보급, 비료의 가용성을 높이는 정부 프로그램에 힘입어 성장하고 있습니다. 하지만 암모니아는 매우 위험한 화학제품으로 특별한 방법으로 보관 및 운송해야 하기 때문에 대량으로 대량으로 취급하는 것은 제한되어 있습니다. 또한, 제조업체와 대형 바이어 간의 집중 조달 시스템 및 장기 계약으로 업스트림 공정에서 중개업체에 대한 의존도를 최소화하고 있습니다. 결과적으로 간접판매는 유통과 접근성 측면에서 필수적인 역할을 하고 있지만, 효율성, 규모, 비용적 이점으로 인해 주류가 된 직접판매에 비해 그 중요성이 낮아지고 있습니다.
"섬유 부문은 예측 기간 동안 두 번째로 큰 부문이 될 것으로 예상됩니다."
암모니아의 두 번째로 큰 최종 사용 분야는 섬유 산업입니다. 이는 여러 직물의 가공 및 마무리 공정에 사용되기 때문인데, 그 규모는 농업에 비해 훨씬 작습니다. 암모니아가 사용되는 공정에는 섬유 처리, pH 조절, 염료의 정착, 직물의 강도, 부드러움, 내구성을 높이기 위한 마무리 등이 포함됩니다. 이 부문은 섬유 생산의 증가와 밀접한 관계가 있습니다. 특히 아시아태평양에서는 중국, 인도, 방글라데시 등의 국가들이 세계 주요 생산국이 되었습니다. 암모니아의 가공 응용 분야에서의 사용은 전 세계 의류 수요 증가, 수출 확대, 고품질 및 고기능성 섬유로의 전환에 의해 촉진되고 있습니다. 또한, 개발도상국의 섬유산업에 대한 정부 지원과 산업화 정책도 안정적인 수요 성장에 기여하고 있습니다. 그러나 농업에 비해 섬유 산업의 암모니아 사용량은 매우 적고, 수요는 경기 순환과 세계 무역의 영향을 받기 쉬운 경향이 있습니다. 농업과 같은 수요 기반 부문은 항상 암모니아 소비의 가장 큰 비중을 차지하고 있습니다. 따라서 여전히 성장하고 있고 암모니아 수요에 기여하고 있는 섬유 산업은 상대적으로 규모가 작고 산업 활동에 의존하고 있기 때문에 2위를 차지하고 있습니다.
세계의 암모니아 시장에 대해 조사 분석했으며, 주요 촉진요인 및 억제요인, 제품 개발 및 혁신, 경쟁 구도에 대한 정보를 전해드립니다.
자주 묻는 질문
목차
제1장 소개
제2장 주요 요약
제3장 중요한 인사이트
제4장 시장 개요
제5장 업계 동향
제6장 기술의 진보, AI에 의한 영향, 특허, 혁신, 향후 용도
제7장 지속가능성과 규제 상황
제8장 고객 상황과 구매 행동
제9장 암모니아 시장 : 유형별
제10장 암모니아 시장 : 판매 채널별
제11장 암모니아 시장 : 최종 이용 산업별
제12장 암모니아 시장 : 지역별
제13장 경쟁 구도
제14장 기업 개요
제15장 조사 방법
제16장 부록
KSM 26.05.19The ammonia market is projected to grow from USD 82.56 billion in 2025 to USD 102.74 billion by 2031, at a CAGR of 3.71% during the forecast period.
| Scope of the Report | |
|---|---|
| Years Considered for the Study | 2022-2031 |
| Base Year | 2025 |
| Forecast Period | 2026-2031 |
| Units Considered | Value (USD Billion) Volume (Kiloton) |
| Segments | Type, Sales Channel, End-Use Industry, and Region |
| Regions covered | North America, Asia Pacific, Europe, the Middle East & Africa, and South America |
The demand for ammonia is driven by growing agricultural consumption, driven by increasing population and food demand, as well as rising refrigeration demand.
"The aqueous segment is projected to be the second-largest segment during the forecast period."
The second-largest type of ammonia in the market is aqueous ammonia, mainly because of its widespread use in industry and its comparatively safer handling than anhydrous ammonia. Although it is less concentrated in nitrogen and thus cannot be used in bulk fertilizer production, it is extensively used in other industries such as water treatment, textiles, pharmaceuticals, and cleaning chemicals. The regulatory framework in the developed regions is shifting toward a more safety-conscious focus on working conditions and handling hazardous materials, thereby promoting the use of aqueous ammonia, a less volatile material that is easier to store and transport. This makes it especially applicable to industries that demand smaller-scale, controlled ammonia use, rather than the large-scale use in agriculture. Also, aqueous ammonia is used in emissions control schemes, such as selective catalytic reduction (SCR) of nitrogen oxides, making it useful in industrial and environmental applications. Nevertheless, it is not as dominant, even with its benefits, owing to its reduced efficiency in supplying nitrogen as a fertilizer. As agriculture remains the planet's major user of ammonia, high-concentration anhydrous ammonia remains in demand as the primary product, leaving aqueous ammonia as the second-largest and yet growing portion.
"The indirect sales segment is projected to be the second-largest segment during the forecast period."
The indirect sales channel is the second-largest in the ammonia market, as it is important for distribution but not for primary supply. Although bulk ammonia is usually sold directly by producers to large fertilizer manufacturers or industrial consumers, indirect routes, including distributors, wholesalers, and retailers, are essential for delivering to small end users, especially agricultural consumers. Farmers in most economies, particularly developing ones, depend on local dealers and cooperatives in their countries to obtain fertilizers, which are made from ammonia. This establishes a robust downstream network in which indirect sales are critical to last-mile delivery. This segment is growing due to the development of rural infrastructure, greater penetration of agricultural inputs, and government programs to enhance the availability of fertilizers. Nevertheless, ammonia is a very dangerous chemical that must be stored and transported in special ways, which limits large-scale manipulation of intermediates at the bulk level. Moreover, centralized procurement systems and long-term contracts between producers and large buyers minimize upstream dependence on intermediaries. Consequently, although indirect sales play an essential role in distribution and accessibility, they are nonetheless less important than direct sales, which prevail due to their efficiency, scale, and cost benefits.
"The textiles segment is projected to be the second-largest segment during the forecast period."
The second-largest end-use sector of ammonia is the textile industry because it is used in several fabric processing and finishing tasks, but is much smaller than agriculture. Some of the processes that are treated with ammonia include fiber treatment, pH control, dye fixation, and finishing to enhance the fabric strength, softness, and durability. This segment has a strong relationship with the increase in the production of textile goods, especially in Asia Pacific, where nations such as China, India, and Bangladesh are major global manufacturers. The use of ammonia in processing applications is being driven by increasing global demand for apparel, rising exports, and the transition to high-quality, performance textiles. Moreover, government support and industrialization policies in developing economies for the textile industry also help create stable demand growth. But relative to agriculture, the amount of ammonia used in textiles is quite small, and demand is more susceptible to economic cycles and global trade. The need-based sector, such as agriculture, always accounts for the largest share of ammonia consumption. Thus, the textile industry, still growing and contributing to the demand for ammonia, is the second-largest segment, as it is relatively smaller and relies on the industrial activity.
"In terms of value, Europe is projected to be the second-largest segment during the forecast period."
The second-largest ammonia market is Europe, which is well-established in its agricultural systems, has an advanced industrial base, and has a robust regulatory structure. High fertilizer efficiency and advanced farming techniques increase the demand for ammonia in the region. Simultaneously, Europe is at the forefront of the shift to low-carbon, sustainable ammonia production, with policies and initiatives aligned with climate objectives. Companies such as the International Energy Agency state that Europe is focused on green ammonia, renewable integration, and emissions-reduction technologies. This is changing the investment towards innovation and infrastructure, which is helping to grow the market in the long term. Nonetheless, the growth in large-scale demand is limited by stringent environmental rules, carbon pricing systems, and restrictions on agricultural expansion. Also, Europe's comparatively stable population and well-developed agricultural industry do not require rapid growth in fertilizer use. Despite these limitations, the region is still a significant market with its technological innovations, robust industrial needs, and sustainable practices leadership.
By Company Type: Tier 1: 25%, Tier 2: 42%, and Tier 3: 33%
By Designation: C-level Executives: 20%, Directors: 30%, and Other Designations: 50%
By Region: North America: 20%, Europe: 10%, Asia Pacific: 40%, South America: 10%, and Middle East & Africa 20%
Notes: Other designations include sales, marketing, and product managers.
Tier 1: >USD 1 Billion; Tier 2: USD 500 million-1 Billion; and Tier 3: <USD 500 million
Companies Covered: CF Industries Holdings, Inc. (US), Yara International ASA (Norway), Saudi Basic Industries Corporation (Saudi Arabia), OCI Global (Netherlands), BASF SE (Germany), Nutrien (Canada), Qatar Fertiliser Company (Qatar), Koch Fertilizer, LLC (US), EuroChem Group (Switzerland), and CSBP Limited (Australia), among others are covered in the report.
The study includes an in-depth competitive analysis of these key players in the ammonia market, with their company profiles, recent developments, and key market strategies.
Research Coverage
This research report categorizes the ammonia market based on type (aqueous, anhydrous), sales channel (direct, indirect), end-use industry (agriculture, textile, refrigeration, mining, pharmaceutical, and other end-use industries), and region (Asia Pacific, North America, Europe, South America, and Middle East & Africa). The report's scope covers detailed information regarding the drivers, restraints, challenges, and opportunities influencing the growth of the ammonia market. A detailed analysis of the key industry players has been done to provide insights into their business overview, products offered, and key strategies, such as partnerships, collaborations, product launches, expansions, and acquisitions, associated with the ammonia market. This report covers a competitive analysis of upcoming startups in the ammonia market ecosystem.
Reasons to Buy the Report
The report will provide market leaders/new entrants with information on the closest approximations of revenue for the overall ammonia market and its subsegments. This report will help stakeholders understand the competitive landscape, gain more insights into positioning their businesses better, and plan suitable go-to-market strategies. The report will help stakeholders understand the pulse of the market and provide them with information on key market drivers, restraints, challenges, and opportunities.
The report provides insights into the following points:
Analysis of key drivers (rising agricultural demand for ammonia, rising demand for grain and oilseed crops and increasing population, growing demand for refrigeration), restraints (fluctuations in pricing, high production costs), opportunities (growing emphasis on low carbon solutions, increasing demand from emerging markets), and challenges (alternative technologies, regulatory compliance, ongoing West Asia war impact on global ammonia market volatility).
- Product Development/Innovation: Detailed insights into upcoming technologies, research & development activities, and product & service launches in the ammonia market.
- Market Development: Comprehensive information about profitable markets - the report analyzes the ammonia market across varied regions.
Market Diversification: Exhaustive information about new products & services, untapped geographies, recent developments, and investments in the ammonia market.
- Competitive Assessment: In-depth assessment of market shares, growth strategies, and service offerings of leading players such CF Industries Holdings, Inc. (US), Yara International ASA (Norway), Saudi Basic Industries Corporation (Saudi Arabia), OCI Global (Netherlands), BASF SE (Germany), Nutrien (Canada), Qatar Fertiliser Company (Qatar), Koch Fertilizer, LLC (US), EuroChem Group (Switzerland), and CSBP Limited (Australia).
TABLE OF CONTENTS
1 INTRODUCTION
- 1.1 STUDY OBJECTIVES
- 1.2 MARKET DEFINITION
- 1.3 STUDY SCOPE
- 1.3.1 MARKETS COVERED AND REGIONAL SCOPE
- 1.3.2 INCLUSIONS AND EXCLUSIONS
- 1.3.3 YEARS CONSIDERED
- 1.3.4 CURRENCY CONSIDERED
- 1.3.5 UNITS CONSIDERED
- 1.4 LIMITATIONS
- 1.5 STAKEHOLDERS
- 1.6 SUMMARY OF CHANGES
2 EXECUTIVE SUMMARY
- 2.1 KEY INSIGHTS AND MARKET HIGHLIGHTS
- 2.2 KEY MARKET PARTICIPANTS: SHARE INSIGHTS AND STRATEGIC DEVELOPMENTS
- 2.3 DISRUPTIVE TRENDS SHAPING MARKET
- 2.4 HIGH-GROWTH SEGMENTS & EMERGING FRONTIERS
- 2.5 SNAPSHOT: GLOBAL MARKET SIZE, GROWTH RATE, AND FORECAST
3 PREMIUM INSIGHTS
- 3.1 ATTRACTIVE OPPORTUNITIES FOR PLAYERS IN AMMONIA MARKET
- 3.2 ASIA PACIFIC: AMMONIA MARKET, BY TYPE AND COUNTRY
- 3.3 AMMONIA MARKET, BY TYPE
- 3.4 AMMONIA MARKET, BY SALES CHANNEL
- 3.5 AMMONIA MARKET, BY END-USE INDUSTRY
- 3.6 AMMONIA MARKET, BY COUNTRY
4 MARKET OVERVIEW
- 4.1 INTRODUCTION
- 4.2 MARKET DYNAMICS
- 4.2.1 DRIVERS
- 4.2.1.1 Rising agricultural demand for ammonia
- 4.2.1.2 Rising demand for grain and oilseed crops and increasing population
- 4.2.1.3 Growing demand for refrigeration
- 4.2.2 RESTRAINTS
- 4.2.2.1 Fluctuations in pricing
- 4.2.2.2 High production costs
- 4.2.3 OPPORTUNITIES
- 4.2.3.1 Growing emphasis on low-carbon solutions
- 4.2.3.2 Increasing demand from emerging markets
- 4.2.4 CHALLENGES
- 4.2.4.1 Alternative technologies
- 4.2.4.2 Regulatory compliance
- 4.2.4.3 Ongoing West Asia war impact on global ammonia market volatility
- 4.2.1 DRIVERS
- 4.3 UNMET NEEDS AND WHITE SPACES
- 4.3.1 UNMET NEEDS IN AMMONIA MARKET
- 4.3.2 WHITE SPACE OPPORTUNITIES
- 4.4 INTERCONNECTED MARKETS AND CROSS-SECTOR OPPORTUNITIES
- 4.4.1 INTERCONNECTED MARKETS
- 4.4.2 CROSS-SECTOR OPPORTUNITIES
- 4.4.3 FERTILIZERS - WASTEWATER TREATMENT
- 4.4.4 REFRIGERANTS - PHARMACEUTICALS
- 4.4.5 PHARMACEUTICALS - TEXTILE
- 4.4.6 TEXTILE - WASTEWATER TREATMENT
- 4.4.7 RUBBER & LEATHER - TEXTILE
- 4.5 STRATEGIC MOVES BY TIER-1/2/3 PLAYERS
- 4.5.1 TIER 1 PLAYERS: GLOBAL LEADERS DRIVING CONSOLIDATION AND INNOVATION
- 4.5.1.1 CF Industries Holdings, Inc. - "Low-Carbon Ammonia for Maritime Fuel Transition"
- 4.5.1.2 Yara International ASA's Capital-Disciplined Expansion of Low-Emission Ammonia by partnering with Air Products
- 4.5.2 TIER 2 PLAYERS: REGIONAL INNOVATORS AND NICHE LEADERS
- 4.5.2.1 Nutrien Ltd. - operational efficiency and asset optimization in ammonia production
- 4.5.2.2 Koch Fertilizer LLC - Capacity Enhancement through Advanced Ammonia Converter Installation
- 4.5.3 TIER 3 PLAYERS: STRENGTHENING SUSTAINABILITY IN AMMONIA MARKET
- 4.5.3.1 NitroVolt ApS - Decentralized Green Ammonia Production Technology
- 4.5.1 TIER 1 PLAYERS: GLOBAL LEADERS DRIVING CONSOLIDATION AND INNOVATION
5 INDUSTRY TRENDS
- 5.1 PORTER'S FIVE FORCES ANALYSIS
- 5.1.1 THREAT OF NEW ENTRANTS
- 5.1.2 THREAT OF SUBSTITUTES
- 5.1.3 BARGAINING POWER OF SUPPLIERS
- 5.1.4 BARGAINING POWER OF BUYERS
- 5.1.5 INTENSITY OF COMPETITIVE RIVALRY
- 5.2 MACROECONOMIC ANALYSIS
- 5.2.1 INTRODUCTION
- 5.2.2 GDP TRENDS AND FORECASTS
- 5.3 VALUE CHAIN ANALYSIS
- 5.4 ECOSYSTEM ANALYSIS
- 5.5 PRICING ANALYSIS
- 5.5.1 AVERAGE SELLING PRICE AMONG KEY PLAYERS, BY TYPE
- 5.5.2 AVERAGE SELLING PRICE TREND OF AMMONIA, BY REGION, 2022-2026
- 5.6 TRADE ANALYSIS
- 5.6.1 EXPORT SCENARIO (HS CODE 2814)
- 5.6.2 IMPORT SCENARIO (HS CODE 2814)
- 5.7 KEY CONFERENCES AND EVENTS, 2026-2027
- 5.8 TRENDS/DISRUPTIONS IMPACTING CUSTOMER BUSINESS
- 5.8.1 TRENDS/DISRUPTIONS IMPACTING CUSTOMER BUSINESS
- 5.9 INVESTMENT AND FUNDING SCENARIO
- 5.10 CASE STUDY ANALYSIS
- 5.10.1 GREEN AMMONIA IMPACT ASSESSMENT CASE STUDY
- 5.10.2 AMMONIA WASTEWATER TREATMENT
- 5.10.3 SCALING LOW-CARBON AMMONIA ADOPTION TO DECARBONIZE ETHANOL AND AGRICULTURE VALUE CHAINS
- 5.11 IMPACT OF 2025 US TARIFF: AMMONIA MARKET
- 5.11.1 INTRODUCTION
- 5.11.2 KEY TARIFF RATES
- 5.11.3 PRICE IMPACT ANALYSIS
- 5.11.4 IMPACT ON COUNTRY/REGION
- 5.11.5 END-USE INDUSTRY IMPACT
6 TECHNOLOGICAL ADVANCEMENTS, AI-DRIVEN IMPACT, PATENTS, INNOVATIONS, AND FUTURE APPLICATIONS
- 6.1 KEY TECHNOLOGIES
- 6.1.1 HABER-BOSCH PROCESS
- 6.1.2 ELECTROCHEMICAL NITROGEN REDUCTION
- 6.2 COMPLEMENTARY TECHNOLOGIES
- 6.2.1 RENEWABLE ENERGY INTEGRATION
- 6.2.2 ADVANCED HEAT RECOVERY SYSTEMS
- 6.3 TECHNOLOGY/PRODUCT ROADMAP
- 6.3.1 SHORT-TERM (2026-2028): EFFICIENCY, COST OPTIMIZATION, EARLY DECARBONIZATION
- 6.3.2 MID-TERM (2028-2031): SCALE-UP, COST REDUCTION, AND MARKET EXPANSION
- 6.3.3 LONG-TERM (2031-2035+): FULL DECARBONIZATION & ENERGY SYSTEM INTEGRATION
- 6.4 PATENT ANALYSIS
- 6.4.1 INTRODUCTION
- 6.4.2 METHODOLOGY
- 6.4.3 AMMONIA MARKET, PATENT ANALYSIS, 2016-2025
- 6.5 FUTURE APPLICATIONS
- 6.5.1 AI-ENABLED AMMONIA SYSTEMS FOR FUTURE INFRASTRUCTURE
- 6.5.2 AMMONIA-BASED DISTRIBUTED WATER PURIFICATION SYSTEMS
- 6.5.3 AMMONIA-DRIVEN THERMAL ENERGY REDISTRIBUTION GRIDS
- 6.6 IMPACT OF AI/GEN AI ON AMMONIA MARKET
- 6.6.1 TOP USE CASES AND MARKET POTENTIAL
- 6.6.2 BEST PRACTICES IN AMMONIA MARKET
- 6.6.3 CASE STUDIES OF AI IMPLEMENTATION IN AMMONIA MARKET
- 6.6.4 INTERCONNECTED ECOSYSTEM AND IMPACT ON MARKET PLAYERS
- 6.6.5 CLIENTS' READINESS TO ADOPT GENERATIVE AI IN AMMONIA MARKET
7 SUSTAINABILITY AND REGULATORY LANDSCAPE
- 7.1 REGIONAL REGULATIONS AND COMPLIANCE
- 7.1.1 REGULATORY BODIES, GOVERNMENT AGENCIES, AND OTHER ORGANIZATIONS
- 7.1.2 INDUSTRY STANDARDS
- 7.2 SUSTAINABILITY INITIATIVES
- 7.2.1 SHIFT TO GREEN AMMONIA
- 7.2.2 BLUE AMMONIA
- 7.2.3 LARGE-SCALE LOW-EMISSION AMMONIA PROJECTS
- 7.2.4 CARBON PRICING, INCENTIVES & POLICY SUPPORT
- 7.2.5 SUSTAINABLE AGRICULTURE INITIATIVES
- 7.3 IMPACT OF REGULATORY POLICY ON SUSTAINABILITY INITIATIVES
8 CUSTOMER LANDSCAPE & BUYER BEHAVIOR
- 8.1 DECISION-MAKING PROCESS
- 8.2 BUYER STAKEHOLDERS AND BUYING EVALUATION CRITERIA
- 8.2.1 KEY STAKEHOLDERS IN BUYING PROCESS
- 8.2.2 BUYING CRITERIA
- 8.3 ADOPTION BARRIERS & INTERNAL CHALLENGES
- 8.4 UNMET NEEDS FROM VARIOUS END-USE INDUSTRIES
- 8.5 MARKET PROFITABILITY
- 8.5.1 REVENUE POTENTIAL
- 8.5.2 COST DYNAMICS
- 8.5.3 MARGIN OPPORTUNITIES, BY END-USE INDUSTRY
9 AMMONIA MARKET, BY TYPE
- 9.1 INTRODUCTION
- 9.2 ANHYDROUS
- 9.2.1 GROWING SIGNIFICANCE IN FERTILIZER PRODUCTION
- 9.3 AQUEOUS
- 9.3.1 RISING DEMAND FOR EFFICIENT WATER TREATMENT SOLUTIONS
10 AMMONIA MARKET, BY SALES CHANNEL
- 10.1 INTRODUCTION
- 10.2 DIRECT
- 10.2.1 STRONG DEMAND FROM LARGE-SCALE BUYERS
- 10.3 INDIRECT
- 10.3.1 GROWTH OF E-COMMERCE SECTOR
11 AMMONIA MARKET, BY END-USE INDUSTRY
- 11.1 INTRODUCTION
- 11.2 AGRICULTURE
- 11.2.1 CRUCIAL FOR SUSTAINING AGRICULTURAL PRODUCTIVITY
- 11.3 TEXTILE
- 11.3.1 GROWING DEMAND FOR HIGH-QUALITY TEXTILES
- 11.4 REFRIGERATION
- 11.4.1 RAPID EXPANSION OF COLD CHAIN LOGISTICS SECTOR
- 11.5 MINING
- 11.5.1 GROWING USE AS LEACHING AGENT IN EXTRACTING AND PROCESSING METALS
- 11.6 PHARMACEUTICAL
- 11.6.1 RISING AGING POPULATION AND CHRONIC DISEASES
- 11.7 OTHER END-USE INDUSTRIES
12 AMMONIA MARKET, BY REGION
- 12.1 INTRODUCTION
- 12.2 ASIA PACIFIC
- 12.2.1 CHINA
- 12.2.1.1 High use of ammonia for clean energy transition
- 12.2.2 INDIA
- 12.2.2.1 Expansion of food processing industry
- 12.2.3 JAPAN
- 12.2.3.1 Ambitious carbon neutrality strategy for 2050
- 12.2.4 INDONESIA
- 12.2.4.1 Growing agricultural sector
- 12.2.5 REST OF ASIA PACIFIC
- 12.2.1 CHINA
- 12.3 EUROPE
- 12.3.1 GERMANY
- 12.3.1.1 Increasing imports of green ammonia and agricultural demand
- 12.3.2 UK
- 12.3.2.1 Green initiatives driving demand for ammonia
- 12.3.3 FRANCE
- 12.3.3.1 Strong export performance to expand market
- 12.3.4 SPAIN
- 12.3.4.1 Plans to generate substantial quantities of green ammonia by 2030
- 12.3.5 ITALY
- 12.3.5.1 Strong economy and agricultural leadership
- 12.3.6 RUSSIA
- 12.3.6.1 Growing domestic demand and export opportunities
- 12.3.7 REST OF EUROPE
- 12.3.1 GERMANY
- 12.4 MIDDLE EAST & AFRICA
- 12.4.1 GCC COUNTRIES
- 12.4.1.1 Saudi Arabia
- 12.4.1.1.1 Saudi Arabia's Vision 2030 promoting sustainable energy solutions
- 12.4.1.2 UAE
- 12.4.1.2.1 Commitment to carbon-free future
- 12.4.1.3 Rest of GCC Countries
- 12.4.1.1 Saudi Arabia
- 12.4.2 IRAN
- 12.4.2.1 Geopolitical situation to slow market growth
- 12.4.3 REST OF MIDDLE EAST & AFRICA
- 12.4.1 GCC COUNTRIES
- 12.5 NORTH AMERICA
- 12.5.1 US
- 12.5.1.1 Rising population and global textile demand
- 12.5.2 CANADA
- 12.5.2.1 Leveraging clean energy and incentives to drive market
- 12.5.3 MEXICO
- 12.5.3.1 Strategic role in global trade and investment in ammonia industry
- 12.5.1 US
- 12.6 SOUTH AMERICA
- 12.6.1 BRAZIL
- 12.6.1.1 Initiatives like Project Iracema to produce renewable ammonia
- 12.6.2 ARGENTINA
- 12.6.2.1 Establishment of regulatory framework to drive market
- 12.6.3 REST OF SOUTH AMERICA
- 12.6.1 BRAZIL
13 COMPETITIVE LANDSCAPE
- 13.1 OVERVIEW
- 13.2 KEY PLAYERS' STRATEGIES/RIGHT TO WIN
- 13.3 MARKET SHARE ANALYSIS
- 13.4 REVENUE ANALYSIS OF KEY PLAYERS
- 13.5 COMPANY VALUATION AND FINANCIAL METRICS
- 13.6 BRAND COMPARISON
- 13.7 COMPANY EVALUATION MATRIX: KEY PLAYERS, 2025
- 13.7.1 STARS
- 13.7.2 EMERGING LEADERS
- 13.7.3 PERVASIVE PLAYERS
- 13.7.4 PARTICIPANTS
- 13.7.5 COMPANY FOOTPRINT: KEY PLAYERS, 2025
- 13.7.5.1 Company footprint
- 13.7.5.2 Region footprint
- 13.7.5.3 Type footprint
- 13.7.5.4 Sales channel footprint
- 13.7.5.5 End-use industry footprint
- 13.8 COMPANY EVALUATION MATRIX: STARTUPS/SMES, 2025
- 13.8.1 PROGRESSIVE COMPANIES
- 13.8.2 RESPONSIVE COMPANIES
- 13.8.3 DYNAMIC COMPANIES
- 13.8.4 STARTING BLOCKS
- 13.8.5 COMPETITIVE BENCHMARKING: STARTUPS/SMES, 2024
- 13.8.5.1 Detailed list of key startups/SMEs
- 13.8.5.2 Competitive benchmarking of key startups/SMEs
- 13.9 COMPETITIVE SCENARIO
- 13.9.1 PRODUCT LAUNCHES
- 13.9.2 DEALS
- 13.9.3 EXPANSIONS
- 13.9.4 OTHER DEVELOPMENTS
14 COMPANY PROFILES
- 14.1 KEY PLAYERS
- 14.1.1 CF INDUSTRIES HOLDINGS, INC.
- 14.1.1.1 Business overview
- 14.1.1.2 Products/Solutions/Services offered
- 14.1.1.3 Recent developments
- 14.1.1.3.1 Deals
- 14.1.1.3.2 Expansions
- 14.1.1.3.3 Other developments
- 14.1.1.4 MnM view
- 14.1.1.4.1 Key strengths
- 14.1.1.4.2 Strategic choices
- 14.1.1.4.3 Weaknesses and competitive threats
- 14.1.2 YARA INTERNATIONAL ASA
- 14.1.2.1 Business overview
- 14.1.2.2 Products/Solutions/Services offered
- 14.1.2.3 Recent developments
- 14.1.2.3.1 Deals
- 14.1.2.3.2 Expansions
- 14.1.2.3.3 Other developments
- 14.1.2.4 MnM view
- 14.1.2.4.1 Key strengths
- 14.1.2.4.2 Strategic choices
- 14.1.2.4.3 Weaknesses & competitive threats
- 14.1.3 SAUDI BASIC INDUSTRIES CORPORATION
- 14.1.3.1 Business overview
- 14.1.3.2 Products/Solutions/Services offered
- 14.1.3.3 Recent developments
- 14.1.3.3.1 Deals
- 14.1.3.3.2 Expansions
- 14.1.3.4 MnM view
- 14.1.3.4.1 Key strengths
- 14.1.3.4.2 Strategic choices
- 14.1.3.4.3 Weaknesses & competitive threats
- 14.1.4 OCI GLOBAL
- 14.1.4.1 Business overview
- 14.1.4.2 Products/Solutions/Services offered
- 14.1.4.3 Recent developments
- 14.1.4.3.1 Deals
- 14.1.4.3.2 Expansions
- 14.1.4.3.3 Other developments
- 14.1.4.4 MnM view
- 14.1.4.4.1 Key strengths
- 14.1.4.4.2 Strategic choices
- 14.1.4.4.3 Weaknesses and competitive threats
- 14.1.5 BASF SE
- 14.1.5.1 Business overview
- 14.1.5.2 Products/Solutions/Services offered
- 14.1.5.3 Recent developments
- 14.1.5.3.1 Product launches
- 14.1.5.3.2 Deals
- 14.1.5.3.3 Other developments
- 14.1.5.4 MnM view
- 14.1.5.4.1 Key strengths
- 14.1.5.4.2 Strategic choices
- 14.1.5.4.3 Weaknesses and competitive threats
- 14.1.6 NUTRIEN
- 14.1.6.1 Business overview
- 14.1.6.2 Products/Solutions/Services offered
- 14.1.6.3 Recent developments
- 14.1.6.3.1 Deals
- 14.1.6.3.2 Expansions
- 14.1.6.3.3 Other developments
- 14.1.6.4 MnM view
- 14.1.7 QATAR FERTILISER COMPANY
- 14.1.7.1 Business overview
- 14.1.7.2 Products/Solutions/Services offered
- 14.1.7.3 Recent developments
- 14.1.7.3.1 Deals
- 14.1.7.4 MnM view
- 14.1.8 KOCH FERTILIZER, LLC
- 14.1.8.1 Business overview
- 14.1.8.2 Products/Solutions/Services offered
- 14.1.8.3 Recent developments
- 14.1.8.3.1 Expansions
- 14.1.8.4 MnM view
- 14.1.9 EUROCHEM GROUP
- 14.1.9.1 Business overview
- 14.1.9.2 Products/Solutions/Services offered
- 14.1.9.3 MnM view
- 14.1.10 CSBP LIMITED
- 14.1.10.1 Business overview
- 14.1.10.2 Products/Solutions/Services offered
- 14.1.10.3 MnM view
- 14.1.1 CF INDUSTRIES HOLDINGS, INC.
- 14.2 OTHER PLAYERS
- 14.2.1 GROUP DF
- 14.2.2 SUMITOMO CHEMICAL CO., LTD.
- 14.2.3 UBE CORPORATION
- 14.2.4 GUJARAT STATE FERTILIZERS & CHEMICALS LIMITED
- 14.2.5 JSC TOGLIATTIAZOT
- 14.2.6 PT PUPUK SRIWIDJAJA PALEMBANG
- 14.2.7 GULF COAST AMMONIA LLC
- 14.2.8 DEEPAK FERTILISERS AND PETROCHEMICALS CORPORATION LIMITED
- 14.2.9 JAYSONS CHEMICAL INDUSTRIES
- 14.2.10 MYSORE AMMONIA PVT. LTD.
- 14.2.11 STEELMAN GASES PVT. LTD.
- 14.2.12 TALUSAG
- 14.2.13 SURAT AMMONIA AND CHEMICAL COMPANY
- 14.2.14 J.R. SIMPLOT COMPANY
- 14.2.15 ANMOL CHEMICALS PRIVATE LIMITED
- 14.2.16 NITROVOLT APS
- 14.2.17 GRUPA AZOTY S.A.
15 RESEARCH METHODOLOGY
- 15.1 RESEARCH DATA
- 15.1.1 SECONDARY DATA
- 15.1.1.1 Key data from secondary sources
- 15.1.2 PRIMARY DATA
- 15.1.2.1 Key primary participants
- 15.1.2.2 Key data from primary sources
- 15.1.2.3 Breakdown of interviews with experts
- 15.1.2.4 Key industry insights
- 15.1.1 SECONDARY DATA
- 15.2 MARKET SIZE ESTIMATION
- 15.2.1 TOP-DOWN APPROACH
- 15.2.2 BOTTOM-UP APPROACH
- 15.3 BASE NUMBER CALCULATION
- 15.3.1 DEMAND-SIDE APPROACH
- 15.3.2 SUPPLY-SIDE APPROACH
- 15.4 GROWTH FORECAST
- 15.4.1 SUPPLY SIDE
- 15.4.2 DEMAND SIDE
- 15.5 DATA TRIANGULATION
- 15.6 RESEARCH ASSUMPTIONS
- 15.7 FACTOR ANALYSIS
- 15.8 RESEARCH LIMITATIONS
- 15.9 RISK ASSESSMENT
16 APPENDIX
- 16.1 DISCUSSION GUIDE
- 16.2 KNOWLEDGESTORE: MARKETSANDMARKETS' SUBSCRIPTION PORTAL
- 16.3 CUSTOMIZATION OPTIONS
- 16.4 RELATED REPORTS
- 16.5 AUTHOR DETAILS
