
|
시장보고서
상품코드
2042499
뉴트라슈티컬 검사 기기 시장 : 컴포넌트별, 제형별, 포장 형태별, 자동화 유형별, 최종사용자별, 지역별 - 예측(-2031년)Nutraceutical Inspection Machines Market by Component (Metal Detector, Vision Inspection System, Checkweigher, Software), Formulation (Tablet, Granule, Liquid), Packaging (Blister, Bottle), Automation (Fully Automated, Manual) - Global Forecast to 2031 |
||||||
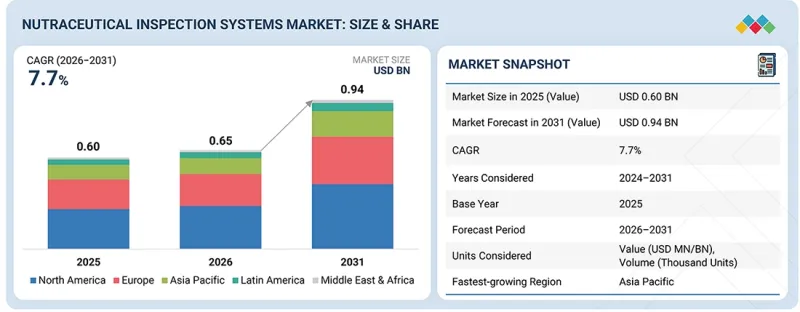
뉴트라슈티컬 검사 기기 시장 규모는 2026년 6억 5,000만 달러에서 2031년까지 9억 4,000만 달러로, CAGR 7.7%로 확대될 것으로 예측됩니다.
이러한 성장은 건강기능식품 제조, 품질 보증 및 제품 안전 관리의 미래를 형성하는 몇 가지 주요 요인에 의해 주도되고 있습니다.
| 조사 범위 | |
|---|---|
| 조사 대상 기간 | 2026-2031년 |
| 기준연도 | 2025년 |
| 예측 기간 | 2026-2031년 |
| 대상 단위 | 금액(10억 달러) |
| 부문 | 컴포넌트별, 제형별, 포장 형태별, 자동화 유형별, 최종사용자별, 지역별 |
| 대상 지역 | 북미, 유럽, 아시아태평양, 라틴아메리카, 중동 및 아프리카 |
영양소 검사 기기 시장은 주로 전 세계 영양소 생산량 증가와 더불어 안전하고 품질이 안정적이며 규정을 준수하는 제품을 제공해야 할 필요성이 증가함에 따라 주도되고 있습니다. 전 세계 뉴트리션 생산량이 증가하고 공급망이 복잡해짐에 따라 뉴트리션 제조업체들은 이물질 검출, 중량 확인, 라벨링 검증을 위해 보다 정교한 검사 장비를 도입하고 있습니다. 이에 따라 영양제 제조업체, 수탁 제조업체 및 포장업체들은 효율적인 생산 라인을 유지하고 고비용의 리콜을 피하기 위해 고효율 검사 기기에 투자하고 있습니다.

영양 검사 기기 산업 수요를 견인하는 또 다른 중요한 요인은 규제 준수, 식품 안전 및 브랜드 보호에 대한 강조가 증가하고 있다는 점입니다. 규제 당국의 압력 증가와 더불어 GMP(Good Manufacturing Practice) 및 HACCP(Hazard Analysis Critical Control Point)와 같은 품질 보증 기준은 기업이 제조 및 포장 공정에서 효과적인 검사 기기을 도입하도록 촉구하고 있습니다. 또한, 오염 및 허위 표시로 인한 제품 리콜이 증가함에 따라 기업들은 검사 역량을 강화하고 있습니다.
최근 자동화 및 AI를 포함한 검사 기기의 개선으로 제조 공정에서의 검출 능력이 크게 향상되었습니다. 고속 자동 검사 라인, 실시간 모니터링 시스템, 통합 데이터 분석 시스템 등의 혁신으로 오염 및 결함 검출을 보다 신속하고 확실하게 할 수 있게 되었습니다. 또한, 인라인 및 온라인 통합 시스템과 더불어 지능형 비전 검사가 이러한 발전에 중요한 역할을 하고 있습니다. 이러한 기술 발전은 제조업체가 품질을 유지하고 오류를 줄이며 생산성을 최적화하는 데 도움이 되고 있으며, 이를 통해 중성자 검사 기기 시장의 지속적인 성장을 주도하고 있습니다.
"제형별로는 구미 및 츄어블 제품 부문이 예측 기간 동안 가장 높은 CAGR을 나타낼 것으로 예측됩니다. "
구미 및 츄어블 제품 부문은 뉴트리컬 검사 기기 시장에서 가장 높은 성장률을 보일 것으로 예측됩니다. 이는 주로 소비자들이 편리하고 맛있고 쉽게 섭취할 수 있는 보충제 형태를 선호하기 때문입니다. 노인과 어린이들 수요 증가와 더불어 맛과 기능성 성분의 지속적인 혁신이 생산량 확대를 견인하고 있습니다. 또한, 이러한 제품 형태는 적절한 균일성, 모양, 코팅 및 오염 검출을 보장하기 위해 전문적인 검사가 필요하기 때문에 고급 검사 기기의 도입이 촉진되고 있습니다.
"자동화 유형별로는 완전 자동화 시스템 부문이 2025년 가장 큰 시장 점유율을 차지할 것으로 예측됩니다. "
2025년에는 완전 자동화 시스템 부문이 중성자 검사 기기 시장을 주도했습니다. 이러한 시스템은 사람의 개입을 최소화하면서 연속적이고 빠른 검사를 실현하며, 많은 경우 생산 라인에 직접 통합되어 있습니다. 이러한 자동화를 통해 제조업체는 생산량이 증가함에 따라 이물질을 감지하고, 초과 제품을 계량하거나 부적절한 표시를 실시간으로 식별할 수 있으며, 동시에 엄격한 규정을 준수할 수 있게 됩니다. 인건비 절감, 인적 오류 최소화, 최신 생산 공정과의 원활한 통합이 가능하기 때문에 이러한 시스템은 대규모 뉴트리슈티컬 제조 시설에서 최적의 선택이 될 수 있습니다.
"아시아태평양은 예측 기간 동안 가장 높은 성장률을 보일 것으로 예측됩니다. "
아시아태평양은 뉴트리컬 검사 기기 시장에서 가장 빠르게 성장하고 있는 지역입니다. 이러한 성장은 뉴트리슈티컬 생산의 급속한 확대, 건강에 대한 인식 증가, 뉴트리슈티컬에 대한 수요 증가에 기인하는 것으로 보입니다. 규제 프레임워크 강화와 중국, 인도 등의 국가로부터의 수출 확대는 제품의 품질과 규정 준수를 보장하기 위한 고도의 검사 기기 도입을 더욱 촉진하고 있습니다.
이 시장 조사는 중성자 검사 기기 시장의 다양한 부문을 대상으로 합니다. 구성 요소, 제형, 포장 형태, 자동화 유형, 최종 사용자 및 지역별로 시장 규모 및 추정치와 성장 잠재력을 추정하는 것을 목표로 합니다. 또한, 주요 시장 기업에 대한 상세한 경쟁 분석과 함께 각 기업의 기업 프로파일, 제품 및 사업 내용에 대한 주요 관찰 사항, 최근 동향, 주요 시장 전략 등을 조사하여 전해드립니다.
이 보고서를 구매해야 하는 이유
본 보고서는 기존 기업 및 신생-중소기업이 시장 동향을 파악하고 시장 점유율을 확대하는 데 도움이 될 것입니다. 이 보고서를 입수한 기업은 아래 5가지 전략 중 한 가지 이상을 실행할 수 있습니다.
본 보고서에서는 다음과 같은 사항에 대한 인사이트를 제공합니다.
- 주요 촉진요인(제품 안전성 및 표시에 대한 규제 당국의 감시 강화, 오염 및 오표시별 제품 리콜 증가), 제약요인(고도의 검사 기기에 대한 막대한 설비투자, 중소 제조업체의 낮은 인지도), 기회요인(신흥 시장에서의 뉴트리슈티컬 시장의 급속한 성장, AI를 활용한 AI를 활용한 시각적 검사 기기 도입), 과제(다양한 제형 및 포장 형태에 대한 대응, 운영 및 검증에 필요한 숙련된 인력 확보)를 분석하여 뉴트리슈티컬 검사 기기 시장의 성장에 영향을 미치는 요인에 대해 분석하였습니다.
- 제품 개발 및 혁신 : 중성자 검사 기기 시장의 향후 기술 동향 및 신제품 출시에 대한 자세한 인사이트.
- 시장 개발: 수익성 높은 신흥 시장에 대한 종합적인 정보. 본 보고서에서는 지역별 다양한 유형의 뉴트리컬 검사 기기 시장을 분석합니다.
- 시장 다각화 : 뉴트리컬 검사 기기 시장의 제품, 미개척 지역, 최근 동향 및 투자에 대한 종합적인 정보를 제공합니다.
- 경쟁 분석 : 중성자 검사 기기 시장에서 주요 기업의 시장 점유율, 전략, 제품, 유통망, 제조 능력에 대한 상세한 평가.
자주 묻는 질문
목차
제1장 서론
제2장 주요 요약
제3장 프리미엄 인사이트
제4장 시장 개요
제5장 업계 동향
제6장 기술 진보, AI의 영향, 특허, 혁신, 그리고 향후 응용
제7장 규제 상황과 지속가능성 이니셔티브
제8장 고객 현황과 구매 행동
제9장 뉴트라슈티컬 검사 기기 시장(컴포넌트별)
제10장 뉴트라슈티컬 검사 기기 시장(제형별)
제11장 뉴트라슈티컬 검사 기기 시장(포장 유형별)
제12장 뉴트라슈티컬 검사 기기 시장(자동화 유형별)
제13장 뉴트라슈티컬 검사 기기 시장(최종사용자별)
제14장 뉴트라슈티컬 검사 기기 시장(지역별)
제15장 경쟁 구도
제16장 기업 개요
제17장 조사 방법
제18장 부록
LSH 26.06.05The nutraceutical inspection systems market is expected to grow from USD 0.65 billion in 2026 to USD 0.94 billion by 2031, at a CAGR of 7.7%. This growth is driven by several key factors shaping the future of nutraceutical manufacturing, quality assurance, and product safety management.
| Scope of the Report | |
|---|---|
| Years Considered for the Study | 2026-2031 |
| Base Year | 2025 |
| Forecast Period | 2026-2031 |
| Units Considered | Value (USD billion) |
| Segments | By Component, Formulation, Packaging Type, Automation Type, End User, Region |
| Regions covered | North America, Europe, Asia Pacific, Latin America, and the Middle East & Africa |
The nutraceutical inspection systems market is primarily driven by the growth in nutraceutical production worldwide, as well as the growing need to deliver safe, consistent, and regulated products. With global increases in nutraceutical production volumes and supply chain complexities, nutraceutical manufacturers are deploying more sophisticated inspection equipment to detect contaminants, verify weights, and verify labeling. This has led to investments by nutraceutical manufacturers, contract manufacturers, and packagers in highly efficient inspection systems to maintain efficient production lines and avoid any expensive recalls.
Another significant factor driving demand in the nutraceutical inspection systems industry is the growing emphasis on regulatory compliance, food safety, and brand protection. Increased pressure from regulatory agencies, along with quality assurance standards such as Good Manufacturing Practices (GMP) and Hazard Analysis and Critical Control Points (HACCP), is prompting companies to implement effective inspection systems for their manufacturing and packaging processes. Additionally, the rise in product recalls due to contamination and mislabeling has led companies to enhance their inspection capabilities.
Recent improvements in inspection systems, including automation and AI, have significantly enhanced detection in manufacturing. Innovations such as high-speed automated inspection lines, real-time monitoring systems, and integrated data-analysis systems have enabled faster, more reliable detection of contamination and defect recognition. Additionally, in-line and online integrated systems, along with intelligent vision inspections, are playing a crucial role in these advancements. These technological developments are helping manufacturers maintain quality, reduce errors, and optimize productivity, thereby driving continuous growth in the nutraceutical inspection systems market.
"By formulation, the gummies & chewables segment is projected to grow at the highest CAGR during the forecast period."
The gummies & chewables segment is projected to experience the highest growth in the nutraceutical inspection systems market. This is largely because consumers prefer these convenient, palatable, and easy-to-consume supplement formats. The increasing demand from both the elderly and children, along with continuous innovations in flavors and functional ingredients, is driving production volumes. Additionally, these formats require specialized inspection to ensure proper consistency, shape, coating, and contamination detection, which encourages the adoption of advanced inspection systems.
"By automation type, the fully automated systems segment accounted for the largest market share in 2025."
In 2025, the fully automated systems segment led the nutraceutical inspection systems market. These systems offer continuous, high-speed inspection with minimal human involvement and are often integrated directly into production lines. This automation enables manufacturers to detect foreign particles, weigh excess products, or identify incorrect labeling in real time as production volumes increase, all while ensuring compliance with strict regulations. Their ability to reduce labor costs, minimize human error, and seamlessly integrate with modern production processes makes these systems the preferred choice for large nutraceutical manufacturing facilities.
"The Asia Pacific region is expected to witness the highest growth rate during the forecast period."
The Asia Pacific region is experiencing the fastest growth in the nutraceutical inspection systems market. This growth can be attributed to the rapid expansion of nutraceutical manufacturing, increased health awareness, and a rising demand for dietary supplements. Enhanced regulatory frameworks and the growing exports from countries like China and India are further driving the adoption of advanced inspection systems to ensure product quality and compliance.
Breakdown of supply-side primary interviews:
By Company Type: Tier 1 (60%), Tier 2 (30%), and Tier 3 (10%)
By Designation: C-level Executives (30%), Directors (50%), and Other Designations (20%)
By Region: North America (40%), Europe (25%), Asia Pacific (20%), Latin America (10%), and the Middle East & Africa (5%)
Breakdown of demand-side primary interviews:
By End User: Nutraceutical Companies (50%), Contract Manufacturers (35%), and Food Companies (Functional Foods) (15%)
By Designation: Heads/Directors of Quality Assurance (QA)/Quality Control (QC) (47%), Plant Heads/Factory Managers (22%), Heads/Managers of Engineering & Maintenance (15%), and Others (16%)
By Region: North America (25%), Europe (24%), Asia Pacific (25%), Latin America (11%), and the Middle East & Africa (15%)
Research Coverage
The market study covers the nutraceutical inspection systems market in various segments. It aims to estimate the market size and growth potential by component, formulation, packaging type, automation type, end user, and region. The study also includes an in-depth competitive analysis of the market's key players, along with their company profiles, key observations on their products and business offerings, recent developments, and key market strategies.
Reasons to Buy the Report
The report can assist established companies and newer or smaller firms in understanding market trends, enabling them to capture a larger share of the market. Firms that acquire the report can implement one or more of the five strategies outlined below.
This report provides insights into the following points:
- Analysis of key drivers (increasing regulatory scrutiny on product safety and labeling and rising product recalls due to contamination & mislabeling), restraints (high capital investment for advanced inspection systems and limited awareness among small & mid-sized manufacturers), opportunities (rapid growth of nutraceuticals in emerging markets and adoption of AI-driven vision inspection systems), and challenges (handling diverse formulations and packaging formats and skilled workforce requirement for operation & validation) influencing the growth of the nutraceutical inspection systems market.
- Product Development/Innovation: Detailed insights on upcoming technologies and product launches in the nutraceutical inspection systems market.
- Market Development: Comprehensive information about lucrative emerging markets. The report analyzes the markets for various types of nutraceutical inspection systems across regions.
- Market Diversification: Exhaustive information about products, untapped regions, recent developments, and investments in the nutraceutical inspection systems market.
- Competitive Assessment: In-depth assessment of market shares, strategies, products, distribution networks, and manufacturing capabilities of the leading players in the nutraceutical inspection systems market.
TABLE OF CONTENTS
1 INTRODUCTION
- 1.1 STUDY OBJECTIVES
- 1.2 MARKET DEFINITION
- 1.3 STUDY SCOPE
- 1.3.1 MARKET SEGMENTATION & REGIONAL SCOPE
- 1.3.2 INCLUSIONS & EXCLUSIONS
- 1.3.3 YEARS CONSIDERED
- 1.4 MARKET STAKEHOLDERS
2 EXECUTIVE SUMMARY
- 2.1 MARKET HIGHLIGHTS AND KEY INSIGHTS
- 2.2 KEY MARKET PARTICIPANTS: MAPPING OF STRATEGIC DEVELOPMENTS
- 2.3 DISRUPTIVE TRENDS IN NUTRACEUTICAL INSPECTION SYSTEMS MARKET
- 2.4 HIGH-GROWTH SEGMENTS
- 2.5 REGIONAL SNAPSHOT: MARKET SIZE, GROWTH RATE, AND FORECAST
3 PREMIUM INSIGHTS
- 3.1 NUTRACEUTICAL INSPECTION SYSTEMS MARKET OVERVIEW
- 3.2 ASIA PACIFIC: NUTRACEUTICAL INSPECTION SYSTEMS MARKET, BY COMPONENT & COUNTRY (2025)
- 3.3 NUTRACEUTICAL INSPECTION SYSTEMS MARKET: REGIONAL MIX
- 3.4 NUTRACEUTICAL INSPECTION SYSTEMS MARKET: GEOGRAPHIC GROWTH OPPORTUNITIES
- 3.5 NUTRACEUTICAL INSPECTION SYSTEMS MARKET: DEVELOPED MARKETS VS. EMERGING ECONOMIES
4 MARKET OVERVIEW
- 4.1 INTRODUCTION
- 4.2 MARKET DYNAMICS
- 4.2.1 DRIVERS
- 4.2.1.1 Increasing regulatory scrutiny on product safety and labeling
- 4.2.1.2 Rising consumer awareness regarding product quality and authenticity
- 4.2.1.3 Rising product recalls due to contamination & mislabeling
- 4.2.1.4 Shift toward automation and Industry 4.0 manufacturing
- 4.2.2 RESTRAINTS
- 4.2.2.1 High capital investment for advanced inspection systems
- 4.2.2.2 Limited awareness among small & mid-sized manufacturers
- 4.2.3 OPPORTUNITIES
- 4.2.3.1 Adoption of AI-driven vision inspection systems
- 4.2.3.2 Rapid growth of nutraceuticals in emerging markets
- 4.2.4 CHALLENGES
- 4.2.4.1 Handling diverse formulations and packaging formats
- 4.2.4.2 Skilled workforce requirement for operation & validation
- 4.2.1 DRIVERS
- 4.3 UNMET NEEDS & WHITE SPACES
- 4.3.1 UNMET NEEDS IN NUTRACEUTICAL INSPECTION SYSTEMS MARKET
- 4.3.2 WHITE SPACE OPPORTUNITIES
- 4.4 INTERCONNECTED MARKETS & CROSS-SECTOR OPPORTUNITIES
- 4.4.1 INTERCONNECTED MARKETS
- 4.4.2 CROSS-SECTOR OPPORTUNITIES
- 4.5 STRATEGIC MOVES BY TIER-1/2/3 PLAYERS
- 4.5.1 STRATEGIC MOVES BY TIER-1/2/3 PLAYERS
5 INDUSTRY TRENDS
- 5.1 PORTER'S FIVE FORCES ANALYSIS
- 5.1.1 THREAT OF NEW ENTRANTS
- 5.1.2 THREAT OF SUBSTITUTES
- 5.1.3 BARGAINING POWER OF SUPPLIERS
- 5.1.4 BARGAINING POWER OF BUYERS
- 5.1.5 INTENSITY OF COMPETITIVE RIVALRY
- 5.2 MACROECONOMIC OUTLOOK
- 5.2.1 INTRODUCTION
- 5.2.2 GDP TRENDS & FORECAST
- 5.2.3 TRENDS IN GLOBAL HEALTHCARE INDUSTRY
- 5.2.4 TRENDS IN GLOBAL NUTRACEUTICAL INDUSTRY
- 5.3 SUPPLY CHAIN ANALYSIS
- 5.4 VALUE CHAIN ANALYSIS
- 5.5 ECOSYSTEM ANALYSIS
- 5.6 PRICING ANALYSIS
- 5.6.1 AVERAGE SELLING PRICE TREND OF NUTRACEUTICAL INSPECTION SYSTEMS, BY KEY PLAYER, 2023-2025
- 5.6.2 AVERAGE SELLING PRICE TREND OF NUTRACEUTICAL INSPECTION SYSTEMS, BY REGION, 2023-2025
- 5.6.2.1 X-ray inspection systems
- 5.6.2.2 Metal detectors
- 5.6.2.3 Checkweighers
- 5.6.2.4 Combination systems
- 5.6.2.5 Vision inspection systems
- 5.6.2.6 Nutraceutical inspection software
- 5.7 TRADE ANALYSIS
- 5.7.1 TRADE DATA FOR HS CODE 9022
- 5.7.1.1 Import scenario (HS Code 9022)
- 5.7.1.2 Export scenario (HS Code 9022)
- 5.7.2 TRADE DATA FOR HS CODE 8423
- 5.7.2.1 Import scenario (HS Code 8423)
- 5.7.2.2 Export scenario (HS Code 8423)
- 5.7.1 TRADE DATA FOR HS CODE 9022
- 5.8 KEY CONFERENCES & EVENTS, 2026-2027
- 5.9 TRENDS/DISRUPTIONS IMPACTING CUSTOMERS' BUSINESSES
- 5.10 INVESTMENT & FUNDING SCENARIO
- 5.11 SUCCESS STORIES & REAL-WORLD APPLICATIONS
- 5.11.1 HIGH-PRECISION FILL QUANTITY CONTROL IN NUTRACEUTICAL PRODUCTION
- 5.11.2 ENHANCING TABLET INSPECTION CAPACITY WITH METAL DETECTION SYSTEMS
- 5.11.3 STRENGTHENING CONTAMINANT DETECTION IN NUTRACEUTICAL PRODUCTION
- 5.12 IMPACT OF US TARIFFS-NUTRACEUTICAL INSPECTION SYSTEMS MARKET
- 5.12.1 INTRODUCTION
- 5.12.2 KEY TARIFF RATES
- 5.12.3 PRICE IMPACT ANALYSIS
- 5.12.4 IMPACT ON COUNTRIES/REGIONS
- 5.12.5 IMPACT ON END-USE INDUSTRIES
- 5.12.5.1 Nutraceutical companies
- 5.12.5.2 Contract manufacturers
- 5.12.5.3 Food companies (functional foods)
6 TECHNOLOGICAL ADVANCEMENTS, AI-DRIVEN IMPACT, PATENTS, INNOVATIONS, AND FUTURE APPLICATIONS
- 6.1 KEY EMERGING TECHNOLOGIES
- 6.1.1 AI /DEEP LEARNING VISION INSPECTION
- 6.1.2 ADVANCED X-RAY WITH AI-ASSISTED CONTAMINANT DETECTION
- 6.1.3 SMART COMBINATION INSPECTION SYSTEMS
- 6.2 COMPLEMENTARY TECHNOLOGIES
- 6.2.1 TRACK & TRACE/SERIALIZATION SYSTEMS
- 6.2.2 AUTOMATED REJECT-AND-SORTING SYSTEMS
- 6.3 ADJACENT TECHNOLOGIES
- 6.3.1 SEAL INTEGRITY & LEAK DETECTION SYSTEMS
- 6.3.2 LABEL & BARCODE VERIFICATION SYSTEMS
- 6.4 TECHNOLOGY/PRODUCT ROADMAP
- 6.4.1 NEAR TERM (2025-2027)
- 6.4.2 MID-TERM (2028-2030)
- 6.4.3 LONG TERM (2030+)
- 6.5 PATENT ANALYSIS
- 6.5.1 PATENT PUBLICATION TRENDS FOR NUTRACEUTICAL INSPECTION SYSTEMS
- 6.5.2 JURISDICTION & TOP APPLICANT ANALYSIS
- 6.6 FUTURE APPLICATIONS
- 6.6.1 AI-DRIVEN PREDICTIVE QUALITY INSPECTION
- 6.6.2 FULLY INTEGRATED SMART PRODUCTION LINE INSPECTION
- 6.6.3 ADVANCED VISION SYSTEMS FOR LABEL AND PACKAGING VERIFICATION
- 6.6.4 BLOCKCHAIN-ENABLED TRACEABILITY AND DIGITAL QUALITY RECORDS
- 6.6.5 COMPACT AND MODULAR INSPECTION SYSTEMS FOR FLEXIBLE MANUFACTURING
- 6.6.6 MULTI-TECHNOLOGY INSPECTION SYSTEMS (HYBRID SOLUTIONS)
- 6.7 IMPACT OF AI/GENERATIVE AI ON NUTRACEUTICAL INSPECTION SYSTEMS MARKET
- 6.7.1 INTRODUCTION
- 6.7.2 MARKET POTENTIAL IN NUTRACEUTICAL INSPECTION SYSTEM ECOSYSTEM
- 6.7.3 AI USE CASES
- 6.7.4 KEY COMPANIES IMPLEMENTING AI IN NUTRACEUTICAL INSPECTION SYSTEMS MARKET
7 REGULATORY LANDSCAPE & SUSTAINABILITY INITIATIVES
- 7.1 REGIONAL REGULATIONS & COMPLIANCE
- 7.1.1 REGULATORY BODIES, GOVERNMENT AGENCIES, AND OTHER ORGANIZATIONS
- 7.1.2 REGULATORY ANALYSIS
- 7.1.3 INDUSTRY STANDARDS
- 7.2 SUSTAINABILITY INITIATIVES
- 7.2.1 RECYCLED AND ECO-FRIENDLY MATERIALS FOR NUTRACEUTICAL INSPECTION SYSTEMS
- 7.2.2 SUSTAINABILITY IMPACT & REGULATORY POLICY INITIATIVES
- 7.2.3 CERTIFICATIONS, LABELING, AND ECO-STANDARDS
8 CUSTOMER LANDSCAPE & BUYER BEHAVIOR
- 8.1 DECISION-MAKING PROCESS
- 8.2 KEY STAKEHOLDERS INVOLVED IN BUYING PROCESS AND THEIR EVALUATION CRITERIA
- 8.2.1 KEY STAKEHOLDERS IN BUYING PROCESS
- 8.2.2 BUYING CRITERIA
- 8.3 ADOPTION BARRIERS & INTERNAL CHALLENGES
- 8.4 UNMET NEEDS FROM VARIOUS END-USE INDUSTRIES
- 8.5 MARKET PROFITABILITY
9 NUTRACEUTICAL INSPECTION SYSTEMS MARKET, BY COMPONENT
- 9.1 INTRODUCTION
- 9.2 SYSTEMS
- 9.2.1 X-RAY INSPECTION SYSTEMS
- 9.2.1.1 Multi-functional detection capabilities accelerating adoption in complex applications
- 9.2.1.2 Volume analysis of X-ray inspection systems, 2024-2031 (Thousand Units)
- 9.2.2 METAL DETECTORS
- 9.2.2.1 Cost-effective contamination control to sustain demand
- 9.2.2.2 Volume analysis of metal detectors, 2024-2031 (Thousand Units)
- 9.2.3 CHECKWEIGHERS
- 9.2.3.1 Dosage accuracy and fill consistency driving critical role in compliance and efficiency
- 9.2.3.2 Volume analysis of checkweighers, 2024-2031 (Thousand Units)
- 9.2.4 COMBINATION SYSTEMS
- 9.2.4.1 Integrated inspection and space optimization enhancing line efficiency
- 9.2.4.2 Volume analysis of combination systems, 2024-2031 (Thousand Units)
- 9.2.5 VISION INSPECTION SYSTEMS
- 9.2.5.1 Labeling accuracy and packaging quality requirements fueling market growth
- 9.2.5.2 Volume analysis of vision inspection systems, 2024-2031 (Thousand Units)
- 9.2.6 OTHER NUTRACEUTICAL INSPECTION SYSTEMS
- 9.2.1 X-RAY INSPECTION SYSTEMS
- 9.3 SOFTWARE
- 9.3.1 DIGITAL INTEGRATION AND TRACEABILITY DRIVING DATA-DRIVEN QUALITY MANAGEMENT
- 9.3.2 VOLUME ANALYSIS OF NUTRACEUTICAL INSPECTION SOFTWARE, 2024-2031 (THOUSAND UNITS)
10 NUTRACEUTICAL INSPECTION SYSTEMS MARKET, BY FORMULATION
- 10.1 INTRODUCTION
- 10.2 TABLETS & CAPSULES
- 10.2.1 HIGH-VOLUME PRODUCTION AND CONTAMINATION RISKS DRIVING INSPECTION DEMAND
- 10.3 POWDERS & GRANULES
- 10.3.1 BULK HANDLING AND RAW MATERIAL VARIABILITY INCREASING NEED FOR INLINE CONTAMINANT DETECTION
- 10.4 LIQUIDS & SYRUPS
- 10.4.1 CONTINUOUS PROCESSING AND PIPELINE CONTAMINATION RISKS ACCELERATING MARKET GROWTH
- 10.5 SOFTGELS
- 10.5.1 COMPLEX ENCAPSULATION AND DEFECT SENSITIVITY DRIVING ADVANCED VISION INSPECTION USE
- 10.6 GUMMIES & CHEWABLES
- 10.6.1 RISING CONSUMER DEMAND AND VISUAL QUALITY REQUIREMENTS FUELING DEMAND
- 10.7 OTHER FORMULATIONS
11 NUTRACEUTICAL INSPECTION SYSTEMS MARKET, BY PACKAGING TYPE
- 11.1 INTRODUCTION
- 11.2 BOTTLES & JARS
- 11.2.1 HIGH-VOLUME MULTI-UNIT PACKAGING DRIVING DEMAND
- 11.3 BLISTER PACKS
- 11.3.1 UNIT-DOSE PRECISION AND CAVITY-LEVEL DEFECT DETECTION FUELING MARKET GROWTH
- 11.4 SACHETS & STICK PACKS
- 11.4.1 SINGLE-SERVE CONVENIENCE AND HIGH-SPEED FFS LINES INCREASING NEED FOR SEAL AND FILL ACCURACY
- 11.5 POUCHES
- 11.5.1 FLEXIBLE PACKAGING GROWTH AND SEAL INTEGRITY CHALLENGES DRIVING ADOPTION
- 11.6 OTHER PACKAGING TYPES
12 NUTRACEUTICAL INSPECTION SYSTEMS MARKET, BY AUTOMATION TYPE
- 12.1 INTRODUCTION
- 12.2 FULLY AUTOMATED SYSTEMS
- 12.2.1 HIGH-SPEED PRODUCTION AND NEED FOR PRECISION DRIVING FULL AUTOMATION ADOPTION
- 12.3 SEMI-AUTOMATED SYSTEMS
- 12.3.1 NEED TO BALANCE COST AND EFFICIENCY SUPPORTING ADOPTION AMONG MID-SIZED MANUFACTURERS
- 12.4 MANUAL INSPECTION SYSTEMS
- 12.4.1 LIMITED AUTOMATION AND LOW-VOLUME OPERATIONS SUSTAINING RESIDUAL DEMAND
13 NUTRACEUTICAL INSPECTION SYSTEMS MARKET, BY END USER
- 13.1 INTRODUCTION
- 13.2 NUTRACEUTICAL COMPANIES
- 13.2.1 CORE ROLE IN QUALITY ASSURANCE AND HIGH PRODUCTION VOLUMES DRIVE DEMAND
- 13.3 CONTRACT MANUFACTURERS
- 13.3.1 MULTI-CLIENT MANUFACTURING COMPLEXITY AND COMPLIANCE NEEDS ACCELERATE ADOPTION
- 13.4 FOOD COMPANIES (FUNCTIONAL FOODS)
- 13.4.1 RISING FUNCTIONAL FOOD DEMAND AND SAFETY STANDARDS FUEL INSPECTION INTEGRATION
14 NUTRACEUTICAL INSPECTION SYSTEMS MARKET, BY REGION
- 14.1 INTRODUCTION
- 14.2 NORTH AMERICA
- 14.2.1 MACROECONOMIC OUTLOOK FOR NORTH AMERICA
- 14.2.2 NORTH AMERICA: VOLUME ANALYSIS, BY COMPONENT, 2024-2031
- 14.2.3 US
- 14.2.3.1 Stringent regulatory enforcement to drive adoption for advanced inspection systems
- 14.2.4 CANADA
- 14.2.4.1 Strong GMP compliance requirements to support demand
- 14.3 EUROPE
- 14.3.1 MACROECONOMIC OUTLOOK FOR EUROPE
- 14.3.2 EUROPE: VOLUME ANALYSIS, BY COMPONENT, 2024-2031
- 14.3.3 GERMANY
- 14.3.3.1 Germany to dominate European market
- 14.3.4 UK
- 14.3.4.1 Increasing regulatory scrutiny and labeling requirements to boost inspection adoption
- 14.3.5 FRANCE
- 14.3.5.1 Strong focus on traceability and labeling compliance to support inspection system demand
- 14.3.6 ITALY
- 14.3.6.1 Large nutraceutical production base to drive need for automated inspection solutions
- 14.3.7 SPAIN
- 14.3.7.1 Expanding export-oriented manufacturing to increase adoption
- 14.3.8 NETHERLANDS
- 14.3.8.1 Advanced food processing ecosystem to drive market growth
- 14.3.9 SWEDEN
- 14.3.9.1 Rising demand for clean-label products to drive need for high-sensitivity inspection systems
- 14.3.10 POLAND
- 14.3.10.1 Rapidly growing manufacturing sector to accelerate inspection system adoption
- 14.3.11 REST OF EUROPE
- 14.4 ASIA PACIFIC
- 14.4.1 MACROECONOMIC OUTLOOK FOR ASIA PACIFIC
- 14.4.2 ASIA PACIFIC: VOLUME ANALYSIS, BY COMPONENT, 2024-2031
- 14.4.3 CHINA
- 14.4.3.1 China to dominate APAC market
- 14.4.4 JAPAN
- 14.4.4.1 Strict quality standards and aging population to drive market
- 14.4.5 INDIA
- 14.4.5.1 Rapid nutraceutical market growth to increase demand
- 14.4.6 AUSTRALIA
- 14.4.6.1 Export-driven production and GMP standards to drive inspection system adoption
- 14.4.7 SOUTH KOREA
- 14.4.7.1 Growing health functional food market to boost market growth
- 14.4.8 THAILAND
- 14.4.8.1 Expanding role as a regional manufacturing hub to boost inspection system demand
- 14.4.9 NEW ZEALAND
- 14.4.9.1 Strong export focus to drive adoption
- 14.4.10 REST OF ASIA PACIFIC
- 14.5 LATIN AMERICA
- 14.5.1 MACROECONOMIC OUTLOOK FOR LATIN AMERICA
- 14.5.2 LATIN AMERICA: VOLUME ANALYSIS, BY COMPONENT, 2024-2031
- 14.5.3 BRAZIL
- 14.5.3.1 Expanding nutraceutical consumption and regulatory enforcement to drive inspection demand
- 14.5.4 MEXICO
- 14.5.4.1 Nearshoring and export growth to increase adoption
- 14.5.5 ARGENTINA
- 14.5.5.1 Gradual regulatory tightening to support adoption of inspection technologies
- 14.5.6 REST OF LATIN AMERICA
- 14.6 MIDDLE EAST & AFRICA
- 14.6.1 MACROECONOMIC OUTLOOK FOR THE MIDDLE EAST & AFRICA
- 14.6.2 MIDDLE EAST & AFRICA: VOLUME ANALYSIS, BY COMPONENT, 2024-2031
- 14.6.3 GCC COUNTRIES
- 14.6.3.1 Kingdom of Saudi Arabia (KSA)
- 14.6.3.1.1 Government initiatives to boost demand
- 14.6.3.2 United Arab Emirates (UAE)
- 14.6.3.2.1 Increasing investments to fuel market growth
- 14.6.3.3 Rest of GCC Countries
- 14.6.3.1 Kingdom of Saudi Arabia (KSA)
- 14.6.4 REST OF MIDDLE EAST & AFRICA
15 COMPETITIVE LANDSCAPE
- 15.1 OVERVIEW
- 15.2 KEY PLAYER STRATEGIES/RIGHT TO WIN
- 15.3 REVENUE ANALYSIS, 2021-2025
- 15.4 MARKET SHARE ANALYSIS, 2025
- 15.4.1 RANKING OF KEY MARKET PLAYERS
- 15.4.2 US MARKET SHARE ANALYSIS, 2025
- 15.4.3 EUROPE MARKET SHARE ANALYSIS, 2025
- 15.5 COMPANY EVALUATION MATRIX: KEY PLAYERS, 2025
- 15.5.1 STARS
- 15.5.2 EMERGING LEADERS
- 15.5.3 PERVASIVE PLAYERS
- 15.5.4 PARTICIPANTS
- 15.5.5 COMPANY FOOTPRINT: KEY PLAYERS, 2025
- 15.5.5.1 Company footprint
- 15.5.5.2 Region footprint
- 15.5.5.3 Component footprint
- 15.5.5.4 Formulation footprint
- 15.5.5.5 Packaging type footprint
- 15.6 COMPANY EVALUATION MATRIX: STARTUPS/SMES, 2025
- 15.6.1 PROGRESSIVE COMPANIES
- 15.6.2 RESPONSIVE COMPANIES
- 15.6.3 DYNAMIC COMPANIES
- 15.6.4 STARTING BLOCKS
- 15.6.5 COMPETITIVE BENCHMARKING: STARTUPS/SMES, 2025
- 15.6.5.1 Detailed list of key startups/SMEs
- 15.6.5.2 Competitive benchmarking of key startups
- 15.7 BRAND/PRODUCT COMPARISON
- 15.8 R&D EXPENDITURE OF KEY PLAYERS
- 15.9 COMPANY VALUATION & FINANCIAL METRICS
- 15.9.1 FINANCIAL METRICS
- 15.9.2 COMPANY VALUATION
- 15.10 COMPETITIVE SCENARIO
- 15.10.1 PRODUCT LAUNCHES
- 15.10.2 DEALS
- 15.10.3 EXPANSIONS
- 15.10.4 OTHER DEVELOPMENTS
16 COMPANY PROFILES
- 16.1 KEY PLAYERS
- 16.1.1 METTLER TOLEDO
- 16.1.1.1 Business overview
- 16.1.1.2 Products offered
- 16.1.1.3 Recent developments
- 16.1.1.3.1 Product launches
- 16.1.1.3.2 Other developments
- 16.1.1.4 MnM view
- 16.1.1.4.1 Key strengths
- 16.1.1.4.2 Strategic choices
- 16.1.1.4.3 Weaknesses & competitive threats
- 16.1.2 THERMO FISHER SCIENTIFIC INC.
- 16.1.2.1 Business overview
- 16.1.2.2 Products offered
- 16.1.2.3 MnM view
- 16.1.2.3.1 Key strengths
- 16.1.2.3.2 Strategic choices
- 16.1.2.3.3 Weaknesses & competitive threats
- 16.1.3 ANRITSU CORPORATION
- 16.1.3.1 Business overview
- 16.1.3.2 Products offered
- 16.1.3.3 MnM view
- 16.1.3.3.1 Key strengths
- 16.1.3.3.2 Strategic choices
- 16.1.3.3.3 Weaknesses & competitive threats
- 16.1.4 ISHIDA CO., LTD.
- 16.1.4.1 Business overview
- 16.1.4.2 Products offered
- 16.1.4.3 Recent developments
- 16.1.4.3.1 Product launches
- 16.1.4.3.2 Other developments
- 16.1.4.4 MnM view
- 16.1.4.4.1 Key strengths
- 16.1.4.4.2 Strategic choices
- 16.1.4.4.3 Weaknesses & competitive threats
- 16.1.5 WIPOTEC GMBH
- 16.1.5.1 Business overview
- 16.1.5.2 Products offered
- 16.1.5.3 Recent developments
- 16.1.5.3.1 Expansions
- 16.1.5.3.2 Other developments
- 16.1.5.4 MnM view
- 16.1.5.4.1 Key strengths
- 16.1.5.4.2 Strategic choices
- 16.1.5.4.3 Weaknesses & competitive threats
- 16.1.6 MINEBEA INTEC GMBH
- 16.1.6.1 Business overview
- 16.1.6.2 Products offered
- 16.1.6.3 Recent developments
- 16.1.6.3.1 Product launches
- 16.1.6.3.2 Other developments
- 16.1.7 SESOTEC GROUP
- 16.1.7.1 Business overview
- 16.1.7.2 Products offered
- 16.1.7.3 Recent developments
- 16.1.7.3.1 Expansions
- 16.1.7.3.2 Other developments
- 16.1.8 LOMA SYSTEMS
- 16.1.8.1 Business overview
- 16.1.8.2 Products offered
- 16.1.8.3 Recent developments
- 16.1.8.3.1 Product launches
- 16.1.9 FORTRESS TECHNOLOGY
- 16.1.9.1 Business overview
- 16.1.9.2 Products offered
- 16.1.10 ANTARES VISION S.P.A
- 16.1.10.1 Business overview
- 16.1.10.2 Products offered
- 16.1.10.3 Recent developments
- 16.1.10.3.1 Product launches
- 16.1.10.3.2 Deals
- 16.1.10.3.3 Other developments
- 16.1.11 BIZERBA
- 16.1.11.1 Business overview
- 16.1.11.2 Products offered
- 16.1.11.3 Recent developments
- 16.1.11.3.1 Deals
- 16.1.11.3.2 Expansions
- 16.1.11.3.3 Other developments
- 16.1.12 ERIEZ MANUFACTURING CO.
- 16.1.12.1 Business overview
- 16.1.12.2 Products offered
- 16.1.12.3 Recent developments
- 16.1.12.3.1 Product launches
- 16.1.12.3.2 Other developments
- 16.1.13 TECHIK INSTRUMENT (SHANGHAI) CO., LTD.
- 16.1.13.1 Business overview
- 16.1.13.2 Products offered
- 16.1.13.3 Recent developments
- 16.1.13.3.1 Expansions
- 16.1.14 A&D COMPANY
- 16.1.14.1 Business overview
- 16.1.14.2 Products offered
- 16.1.14.3 Recent developments
- 16.1.14.3.1 Deals
- 16.1.15 C.E.I.A. S.P.A.
- 16.1.15.1 Business overview
- 16.1.15.2 Products offered
- 16.1.15.3 Recent developments
- 16.1.15.3.1 Product launches
- 16.1.1 METTLER TOLEDO
- 16.2 OTHER PLAYERS
- 16.2.1 MEKITEC OY
- 16.2.2 MESUTRONIC GMBH
- 16.2.3 MULTIVAC SEPP HAGGENMULLER SE & CO. KG
- 16.2.4 QUALICAPS
- 16.2.5 NIKKA DENSOK LIMITED
- 16.2.6 SENSUM D.O.O.
- 16.2.7 YAMATO
- 16.2.8 EASYWEIGH
- 16.2.9 CASSEL MESSTECHNIK GMBH
- 16.2.10 SAPPHIRE INSPECTION
17 RESEARCH METHODOLOGY
- 17.1 RESEARCH DATA
- 17.2 RESEARCH METHODOLOGY DESIGN
- 17.2.1 SECONDARY DATA
- 17.2.1.1 Key data from secondary sources
- 17.2.2 PRIMARY DATA
- 17.2.2.1 Key data from primary sources
- 17.2.2.2 Key industry insights
- 17.2.1 SECONDARY DATA
- 17.3 MARKET SIZE ESTIMATION
- 17.3.1 BOTTOM-UP APPROACH
- 17.4 MARKET BREAKDOWN AND DATA TRIANGULATION
- 17.5 MARKET SHARE ANALYSIS
- 17.5.1 RESEARCH ASSUMPTIONS
- 17.5.2 GROWTH RATE ASSUMPTIONS
- 17.6 RISK ASSESSMENT
- 17.7 RESEARCH LIMITATIONS
- 17.7.1 METHODOLOGY-RELATED LIMITATIONS
- 17.7.2 SCOPE-RELATED LIMITATIONS
18 APPENDIX
- 18.1 DISCUSSION GUIDE
- 18.2 KNOWLEDGESTORE: MARKETSANDMARKETS' SUBSCRIPTION PORTAL
- 18.3 CUSTOMIZATION OPTIONS
- 18.3.1 PRODUCT ANALYSIS
- 18.3.2 COMPANY INFORMATION
- 18.3.3 GEOGRAPHIC ANALYSIS
- 18.3.4 REGIONAL/COUNTRY-LEVEL MARKET SHARE ANALYSIS
- 18.3.5 COUNTRY-LEVEL VOLUME ANALYSIS BY COMPONENT
- 18.3.6 BY PRODUCT TYPE MARKET SHARE ANALYSIS (TOP 5 PLAYERS)
- 18.3.7 ANY CONSULT/CUSTOM REQUIREMENTS AS PER CLIENT REQUESTS
- 18.4 RELATED REPORTS
- 18.5 AUTHOR DETAILS

