|
시장보고서
상품코드
2058131
데이터센터용 케이블 시장 : 데이터 레이트별, 설치 유형별, 기술별, 용도별, 케이블 유형별, 데이터센터 유형별, 워크로드별, 지역별 - 세계 예측(-2032년)Data Center Cable Market by Cable Type (Optical Fiber Cable, Copper Cable), Application (Rack-to-Rack, Intra-Rack, Interconnect, Storage Area Network), Cables, Passive Cables, Active Cables, Al & Non-Al, and Region - Global Forecast to 2032 |
||||||
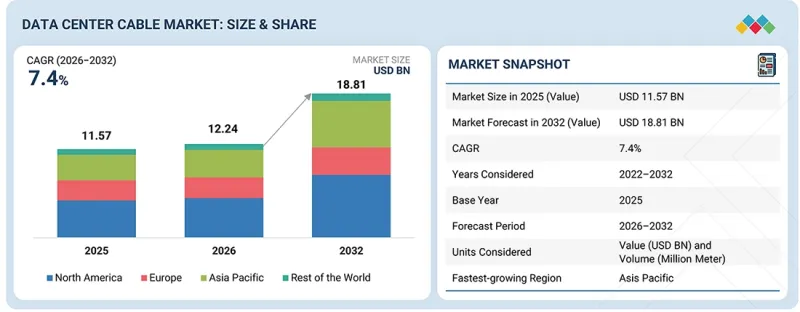
세계의 데이터센터용 케이블 시장 규모는 2026년 122억 4,000만 달러에서 2032년까지 188억 1,000만 달러로 확대되어 CAGR 7.4%로 성장할 것으로 예측됩니다.
| 조사 범위 | |
|---|---|
| 조사 대상 기간 | 2021-2032년 |
| 기준 연도 | 2025년 |
| 예측 기간 | 2026-2032년 |
| 대상 단위 | 금액(10억 달러) |
| 부문 | 데이터 레이트별, 설치 유형별, 기술별, 용도별, 케이블 유형별, 데이터센터 유형별, 워크로드별, 지역별 |
| 대상 지역 | 북미, 유럽, 아시아태평양, 기타 |
"데이터센터 유형별로는 하이퍼스케일 데이터센터 부문이 예측 기간 동안 가장 높은 연평균 성장률(CAGR)을 기록할 것으로 전망됩니다. "
하이퍼스케일 데이터센터는 대규모의 확장 가능한 연결 인프라를 필요로 하는 클라우드 컴퓨팅, AI 워크로드, 생성형 AI 및 고성능 컴퓨팅(HPC) 애플리케이션의 급속한 성장에 힘입어, 예측 기간 동안 데이터센터용 케이블 시장에서 가장 높은 연평균 성장률(CAGR)을 기록할 것으로 예상됩니다. 주요 하이퍼스케일러 기업들은 고밀도 서버 구축, GPU 클러스터, 초고속 네트워크 아키텍처를 갖춘 대규모 AI 지원 시설에 막대한 투자를 하고 있습니다. 이에 따라 서버 간, 랙 간 및 상호연결 용도의 광섬유, 트윈 액시얼 및 고속 구리 케이블 솔루션에 대한 수요가 크게 증가하고 있습니다.
"워크로드별로는 비 AI가 더 큰 시장 점유율을 차지할 것으로 예상됩니다."
예측 기간 동안 데이터센터용 케이블 시장에서 비 AI 워크로드 부문이 더 큰 시장 점유율을 차지할 것으로 예상됩니다. 이는 기존의 기업 애플리케이션, 클라우드 스토리지, 웹 호스팅, 코로케이션 서비스, 통신 사업 및 비즈니스에 필수적인 IT 워크로드가 여전히 전 세계 데이터센터 인프라 구축의 대부분을 차지하고 있기 때문입니다. 기존 데이터센터의 대부분은 여전히 비 AI 컴퓨팅 환경을 지원하도록 설계되어 있어, 네트워크, 전력 분배 및 상호연결을 위해 광범위한 구리선과 광섬유 케이블이 필요합니다. 또한, 은행, 의료, 소매, 정부, 제조업 등 다양한 분야에 걸쳐 있는 기업들은 디지털 업무 확대를 지속하고 있어, 구조화된 배선 솔루션에 대한 높은 수요가 유지되고 있습니다. 현재 비 AI 워크로드가 시장을 주도하고 있지만, 생성형 AI, 고성능 컴퓨팅 및 AI 중심 데이터센터 인프라에 대한 투자가 증가함에 따라 AI 워크로드는 급속한 성장을 보이고 있습니다.
"예측 기간 동안 북미가 가장 큰 시장 점유율을 차지할 것으로 보입니다."
북미는 미국 및 캐나다 전역의 하이퍼스케일 데이터센터, 주요 클라우드 서비스 제공업체, 그리고 최첨단 AI 인프라에 대한 투자가 활발한 만큼, 예측 기간 동안 데이터센터용 케이블 시장에서 가장 큰 시장 점유율을 차지할 것으로 예상됩니다. 해당 지역에서는 클라우드 컴퓨팅, 고성능 컴퓨팅(HPC), 그리고 첨단 네트워크 기술의 도입이 활발히 진행되고 있으며, 이는 광섬유 및 고속 구리 케이블 솔루션에 대한 수요를 크게 견인하고 있습니다. 아마존, 마이크로소프트, 구글, 메타와 같은 하이퍼스케일러들의 AI 대응 데이터센터에 대한 투자 확대는 케이블 도입을 더욱 가속화하고 있습니다. 또한, 데이터 트래픽의 증가, 400G/800G 네트워크 기술의 조기 도입, 그리고 디지털 인프라의 적극적인 개발이 북미 전역의 지속적인 시장 성장을 뒷받침하고 있습니다.
데이터센터용 케이블 시장의 주요 업계 전문가들을 대상으로 광범위한 1차 인터뷰를 실시하고, 2차 조사를 통해 수집한 각종 부문 및 하위 부문의 시장 규모를 파악하고 검증했습니다. 본 보고서의 1차 인터뷰 대상자 구성은 다음과 같습니다.
데이터센터용 케이블 시장의 주요 기업으로는 Corning Incorporated(미국), Amphenol Corporation(미국), Nexans(프랑스), TE Connectivity(아일랜드), Prysmian Group(이탈리아), Furukawa Electric(일본), Sumitomo Electric(일본), Panduit Corp.(미국), Belden Inc.(미국), 및 LAPP(독일)이 포함됩니다.
본 조사에서는 데이터센터용 케이블 시장의 주요 기업들에 대해 기업 개요, 최근 동향 및 주요 시장 전략을 포함한 상세한 경쟁 분석을 수행하고 있습니다.
조사 범위:
본 보고서에서는 데이터센터용 케이블 시장을 세분화하여 케이블 유형(광섬유 케이블, 구리 케이블), 용도(랙 간, 랙 내, 상호연결, 스토리지 영역 네트워크), 기술(패시브 케이블, 액티브 케이블), 데이터센터 유형(하이퍼스케일 데이터센터, 엔터프라이즈 데이터센터, 코로케이션 데이터센터, 엣지 데이터센터), 및 워크로드(AI, 비 AI)별로 시장 규모를 예측하고 있습니다. 또한, 본 보고서에서는 업계 성장에 영향을 미치는 주요 시장 촉진요인, 제약요인, 기회 및 과제에 대해서도 분석하고 있습니다. 북미, 유럽, 아시아태평양 및 기타 전 세계 지역에 걸친 상세한 지역별 평가와 더불어, 주요 시장의 국가별 인사이트도 제공합니다. 또한, 본 조사에는 전 세계 데이터센터용 케이블 생태계에서 사업을 전개하는 주요 기업들에 대한 밸류체인 분석 및 경쟁 구도 평가도 포함되어 있습니다.
본 보고서를 구매할 때의 주요 이점:
- 주요 촉진요인(고속 네트워크 기술의 보급 확대, AI, IoT, 클라우드 컴퓨팅 관련 데이터 트래픽 증가, 하이퍼스케일 데이터센터의 급속한 성장), 제약요인(높은 설치 및 인프라 비용, 케이블 관리 및 설계의 복잡성), 기회(친환경 에너지 절약형 데이터센터의 보급 확대, 고밀도·모듈형 배선 솔루션의 발전), 그리고 과제(레거시 네트워크 시스템과의 호환성 문제, 대규모 환경에서의 도입 및 설치 과제)에 대한 분석.
- 제품 및 서비스 개발·혁신 : 데이터센터용 케이블 시장의 향후 기술 동향, 연구개발 활동, 신제품 출시에 대한 상세한 분석.
- 시장 개발 : 다양한 지역의 데이터센터용 케이블 시장 분석을 통해 수익성이 높은 시장에 대한 종합적인 정보를 제공합니다.
- 시장의 다각화 : 데이터센터용 케이블 시장의 신제품 및 서비스, 미개척 지역, 최근 동향, 그리고 투자에 관한 종합적인 정보.
- 경쟁사 분석 : Corning Incorporated(미국), Amphenol Corporation(미국), Nexans(프랑스), TE Connectivity(아일랜드), Prysmian Group(이탈리아), Furukawa Electric(일본), Sumitomo Electric(일본), Panduit Corp.(미국), Belden Inc.(미국), 및 LAPP(독일)와 같은 주요 기업의 시장 점유율 및 성장 전략에 대한 상세한 평가.
자주 묻는 질문
목차
제1장 소개
제2장 주요 요약
제3장 주요 인사이트
제4장 시장 개요
제5장 업계 동향
제6장 기술 진보, AI에 의한 영향, 특허, 그리고 혁신
제7장 규제 상황
제8장 고객 상황과 구매 행동
제9장 데이터센터 네트워크 인프라의 케이블 배선 아키텍처
제10장 데이터센터용 케이블 시장(데이터 레이트별)
제11장 데이터센터용 케이블 시장(설치 유형별)
제12장 데이터센터용 케이블 시장(기술별)
제13장 데이터센터용 케이블 시장(용도별)
제14장 데이터센터용 케이블 시장(케이블 유형별)
제15장 데이터센터용 케이블 시장(데이터센터 유형별)
제16장 데이터센터용 케이블 시장(워크로드별)
제17장 데이터센터용 케이블 시장(지역별)
제18장 경쟁 구도
제19장 기업 개요
제20장 조사 방법
제21장 부록
KSM 26.06.19The global data center cable market is anticipated to grow from USD 12.24 billion in 2026 to USD 18.81 billion by 2032, growing at a CAGR of 7.4%.
| Scope of the Report | |
|---|---|
| Years Considered for the Study | 2021-2032 |
| Base Year | 2025 |
| Forecast Period | 2026-2032 |
| Units Considered | Value (USD Billion) |
| Segments | By Cable Type, Application and Region |
| Regions covered | North America, Europe, APAC, RoW |
"Based on data center type, the hyperscale data centers segment to register the highest CAGR during the forecast period/"
Hyperscale data centers are expected to witness the highest CAGR in the data center cable market during the forecast period, driven by rapid growth in cloud computing, AI workloads, generative AI, and high-performance computing (HPC) applications that require massive, scalable connectivity infrastructure. Major hyperscalers are investing heavily in large-scale AI-ready facilities featuring high-density server deployments, GPU clusters, and ultra-high-speed networking architectures. This is driving substantial demand for optical fiber, twinaxial, and high-speed copper cabling solutions for server-to-server, rack-to-rack, and interconnect applications.

"Based on workload, non-AI to hold the larger market share."
The non-AI workload segment holds the larger market share in the data center cable market during the forecast period because conventional enterprise applications, cloud storage, web hosting, colocation services, telecom operations, and business-critical IT workloads continue to account for the majority of global data center infrastructure deployments. Most existing data centers are still designed to support non-AI computing environments, requiring extensive copper and fiber cabling for networking, power distribution, and interconnectivity. Additionally, enterprises across banking, healthcare, retail, government, and manufacturing sectors continue to expand digital operations, sustaining high demand for structured cabling solutions. While non-AI workloads currently dominate the market, AI workloads are witnessing significant growth due to increasing investments in generative AI, high-performance computing, and AI-driven data center infrastructure.
"North America to hold the largest market share during the forecast period."
North America is expected to hold the largest market share in the data center cable market during the forecast period due to the strong presence of hyperscale data centers, major cloud service providers, and leading AI infrastructure investments across the US and Canada. The region has high adoption of cloud computing, high-performance computing (HPC), and advanced networking technologies, driving significant demand for optical fiber and high-speed copper cabling solutions. Increasing investments by hyperscalers such as Amazon, Microsoft, Google, and Meta in AI-ready data centers are further accelerating cable deployment. Additionally, growing data traffic, early adoption of 400G/800G networking technologies, and strong digital infrastructure development are supporting sustained market growth across North America.
Extensive primary interviews have been conducted with key industry experts in the data center cable market to determine and verify the market size for various segments and subsegments gathered through secondary research. The breakdown of primary participants for the report is shown below.
The study contains insights from various industry experts, including component suppliers, Tier 1 companies and OEMs. The break-up of the primaries is as follows:
- By Company Type - Tier 1 - 55%, Tier 2 - 25%, and Tier 3 - 20%
- By Designation - Directors - 50%, Managers - 30%, and Others - 20%
- By Region - North America - 45%, Europe - 30%, Asia Pacific - 20%, and the Rest of the World - 5%.
The key players in the data center cable market include Corning Incorporated (US), Amphenol Corporation (US), Nexans (France), TE Connectivity (Ireland), Prysmian Group (Italy), Furukawa Electric (Japan), Sumitomo Electric (Japan), Panduit Corp. (US), Belden Inc. (US), and LAPP (Germany).
The study includes an in-depth competitive analysis of these key players in the data center cable market, with their company profiles, recent developments, and key market strategies.
Study Coverage:
The report segments the data center cable market and forecasts its market size by cable type (optical fiber cable, copper cable), application (rack-to-rack, intra-rack, interconnect, storage area network), technology (passive cable, active cable), data center type (hyperscale data center, enterprise data center, colocation data center, edge data center), and workload (AI, Non-AI). The report also analyzes key market drivers, restraints, opportunities, and challenges influencing industry growth. It provides a detailed regional assessment across North America, Europe, Asia Pacific, and the Rest of the World, along with country-level insights for major markets. In addition, the study includes value chain analysis and competitive landscape assessment of leading players operating in the global data center cable ecosystem.
Key Benefits of Buying the Report:
- Analysis of key drivers (rising adoption of high-speed networking technologies, increasing data traffic driven by AI, IoT, and cloud computing, rapid growth of hyperscale data centers), restraints (high installation and infrastructure costs, complexity in cable management and design), opportunities (growing adoption of green and energy-efficient data centers, Advancements in high-density and modular cabling solutions), and challenges (compatibility issues with legacy network systems, deployment and installation challenges in large-scale environments).
- Product and Service Development/Innovation: Detailed insights on upcoming technologies, research and development activities, and new product launches in the data center cable market.
- Market Development: Comprehensive information about lucrative markets by analyzing the data center cable market across varied regions.
- Market Diversification: Exhaustive information about new products/services, untapped geographies, recent developments, and investments in the data center cable market.
- Competitive Assessment: In-depth assessment of market shares and growth strategies of leading players, such as Corning Incorporated (US), Amphenol Corporation (US), Nexans (France), TE Connectivity (Ireland), Prysmian Group (Italy), Furukawa Electric (Japan), Sumitomo Electric (Japan), Panduit Corp. (US), Belden Inc. (US), and LAPP (Germany).
TABLE OF CONTENTS
1 INTRODUCTION
- 1.1 STUDY OBJECTIVES
- 1.2 MARKET DEFINITION
- 1.3 STUDY SCOPE
- 1.3.1 MARKETS COVERED AND REGIONAL SCOPE
- 1.3.2 INCLUSIONS AND EXCLUSIONS
- 1.3.3 YEARS CONSIDERED
- 1.4 CURRENCY CONSIDERED
- 1.5 UNIT CONSIDERED
- 1.6 STAKEHOLDERS
2 EXECUTIVE SUMMARY
- 2.1 MARKET HIGHLIGHTS AND KEY INSIGHTS
- 2.2 KEY MARKET PARTICIPANTS: MAPPING OF STRATEGIC DEVELOPMENTS
- 2.3 DISRUPTIVE TRENDS SHAPING DATA CENTER CABLE MARKET
- 2.4 HIGH-GROWTH SEGMENTS
- 2.5 REGIONAL SNAPSHOT: GLOBAL MARKET SIZE, GROWTH RATE, AND FORECAST
3 PREMIUM INSIGHTS
- 3.1 ATTRACTIVE OPPORTUNITIES FOR PLAYERS IN DATA CENTER CABLE MARKET
- 3.2 DATA CENTER CABLE MARKET, BY CABLE TYPE
- 3.3 DATA CENTER CABLE MARKET, BY DATA CENTER TYPE
- 3.4 DATA CENTER CABLE MARKET, BY TECHNOLOGY
- 3.5 DATA CENTER CABLE MARKET, BY APPLICATION
- 3.6 DATA CENTER CABLE MARKET, BY REGION
- 3.7 DATA CENTER CABLE MARKET, BY COUNTRY
4 MARKET OVERVIEW
- 4.1 INTRODUCTION
- 4.2 MARKET DYNAMICS
- 4.2.1 DRIVERS
- 4.2.1.1 Rising adoption of high-speed networking technologies
- 4.2.1.2 Increasing data traffic driven by AI, IoT, and cloud computing
- 4.2.1.3 Rapid growth of hyperscale data centers
- 4.2.2 RESTRAINTS
- 4.2.2.1 High installation and infrastructure costs
- 4.2.2.2 Complexity in cable management and design
- 4.2.3 OPPORTUNITIES
- 4.2.3.1 Growing adoption of green and energy-efficient data centers
- 4.2.3.2 Advancements in high-density and modular cabling solutions
- 4.2.4 CHALLENGES
- 4.2.4.1 Compatibility issues with legacy network systems
- 4.2.4.2 Deployment and installation challenges in large-scale environments
- 4.2.1 DRIVERS
- 4.3 UNMET NEEDS AND WHITE SPACES
- 4.3.1 UNMET NEEDS IN DATA CENTER CABLE MARKET
- 4.3.2 WHITE SPACE OPPORTUNITIES
- 4.4 INTERCONNECTED MARKETS AND CROSS-SECTOR OPPORTUNITIES
- 4.4.1 INTERCONNECTED MARKETS
- 4.4.2 CROSS-SECTOR OPPORTUNITIES
- 4.5 STRATEGIC MOVES BY TIER 1/2/3/ PLAYERS
5 INDUSTRY TRENDS
- 5.1 INTRODUCTION
- 5.2 PORTER'S FIVE FORCES ANALYSIS
- 5.2.1 THREAT OF NEW ENTRANTS
- 5.2.2 THREAT OF SUBSTITUTES
- 5.2.3 BARGAINING POWER OF SUPPLIERS
- 5.2.4 BARGAINING POWER OF BUYERS
- 5.2.5 INTENSITY OF COMPETITIVE RIVALRY
- 5.3 MACROECONOMIC OUTLOOK
- 5.3.1 INTRODUCTION
- 5.3.2 GDP TRENDS AND FORECAST
- 5.4 VALUE CHAIN ANALYSIS
- 5.5 ECOSYSTEM ANALYSIS
- 5.6 PRICING ANALYSIS
- 5.6.1 AVERAGE SELLING PRICE OF DATA CENTER CABLE OFFERED BY KEY PLAYERS, BY CABLE TYPE, 2025
- 5.6.2 AVERAGE SELLING PRICE TREND OF DATA CENTER CABLE, BY REGION, 2021-2024
- 5.7 TRADE ANALYSIS
- 5.7.1 IMPORT SCENARIO (HS CODE 854470)
- 5.7.2 EXPORT SCENARIO (HS CODE 854470)
- 5.8 KEY CONFERENCES AND EVENTS, 2026-2027
- 5.9 TRENDS/DISRUPTIONS IMPACTING CUSTOMER BUSINESS
- 5.10 INVESTMENT AND FUNDING SCENARIO, 2022-2025
- 5.11 CASE STUDY ANALYSIS
- 5.11.1 ADOPTION OF PRE-TERMINATED FIBER CABLING IN HYPERSCALE DATA CENTERS
- 5.11.2 TRANSITION FROM COPPER TO FIBER IN ENTERPRISE DATA CENTERS
- 5.11.3 HIGH-DENSITY CABLING DEPLOYMENT IN COLOCATION DATA CENTERS
- 5.12 IMPACT OF 2025 US TARIFF - DATA CENTER CABLE MARKET
- 5.12.1 INTRODUCTION
- 5.12.2 KEY TARIFF RATES
- 5.12.3 PRICE IMPACT ANALYSIS
- 5.12.4 IMPACT ON COUNTRIES/REGIONS
- 5.12.4.1 US
- 5.12.4.2 Europe
- 5.12.4.3 Asia Pacific
- 5.12.5 IMPACT ON APPLICATIONS
6 TECHNOLOGICAL ADVANCEMENTS, AI-DRIVEN IMPACT, PATENTS, AND INNOVATIONS
- 6.1 KEY EMERGING TECHNOLOGIES
- 6.1.1 BEND-INSENSITIVE OPTICAL FIBER CABLES
- 6.1.2 HIGH-DENSITY MULTI-FIBER CABLE CONSTRUCTION
- 6.1.3 LOW SMOKE ZERO HALOGEN (LSZH) CABLES
- 6.2 COMPLEMENTARY TECHNOLOGIES
- 6.2.1 HIGH-DENSITY CONNECTOR TECHNOLOGIES (MPO/MTP CONNECTORS)
- 6.2.2 CO-PACKAGED OPTICS
- 6.2.3 FOIL/BRAID SHIELDING
- 6.3 TECHNOLOGY/PRODUCT ROADMAP
- 6.3.1 SHORT-TERM (2025-2027): SYSTEM OPTIMIZATION AND DIGITAL INTEGRATION
- 6.3.2 MID-TERM (2027-2030): INTELLIGENT AUTOMATION AND ECOSYSTEM EXPANSION
- 6.4 PATENT ANALYSIS
- 6.5 IMPACT OF AI ON DATA CENTER CABLE MARKET
- 6.5.1 TOP USE CASES AND MARKET POTENTIAL
- 6.5.2 BEST PRACTICES FOLLOWED BY PLAYERS IN DATA CENTER CABLE MARKET
- 6.5.3 CASE STUDIES RELATED TO AI IMPLEMENTATION IN DATA CENTER CABLE MARKET
- 6.5.4 INTERCONNECTED ECOSYSTEM AND IMPACT ON MARKET PLAYERS
- 6.5.5 CLIENTS' READINESS TO ADOPT AI-INTEGRATED DATA CENTER CABLE
7 REGULATORY LANDSCAPE
- 7.1 REGIONAL REGULATIONS AND COMPLIANCE
- 7.1.1 REGULATORY BODIES, GOVERNMENT AGENCIES, AND OTHER ORGANIZATIONS
- 7.1.2 INDUSTRY STANDARDS
- 7.1.2.1 ISO/IEC 11801 - Information Technology: Generic Cabling for Customer Premises
- 7.1.2.2 TIA-568 - Commercial Building Telecommunications Cabling Standard
8 CUSTOMER LANDSCAPE AND BUYER BEHAVIOR
- 8.1 INTRODUCTION
- 8.2 DECISION-MAKING PROCESS
- 8.3 KEY STAKEHOLDERS INVOLVED IN BUYING PROCESS AND THEIR EVALUATION CRITERIA
- 8.3.1 KEY STAKEHOLDERS IN BUYING PROCESS
- 8.3.2 BUYING CRITERIA
- 8.4 ADOPTION BARRIERS AND INTERNAL CHALLENGES
- 8.5 UNMET NEEDS OF VARIOUS END USERS
9 CABLING ARCHITECTURES IN DATA CENTER NETWORK INFRASTRUCTURE
- 9.1 INTRODUCTION
- 9.2 STRUCTURED (HIERARCHICAL) CABLING
- 9.3 TOP-OF-RACK ARCHITECTURE
- 9.4 END-OF-ROW (EOR) ARCHITECTURE
- 9.5 MIDDLE-OF-ROW (MOR) ARCHITECTURE
- 9.6 SPINE-LEAF ARCHITECTURE
- 9.7 MESH ARCHITECTURE
- 9.8 FABRIC-BASED ARCHITECTURE
10 DATA CENTER CABLE MARKET, BY DATA RATE
- 10.1 INTRODUCTION
- 10.2 UP TO 100 GBPS
- 10.3 101 GBPS TO 200 GBPS
- 10.4 201 GBPS TO 400 GBPS
- 10.5 401 GBPS TO 800 GBPS
- 10.6 ABOVE 801 GBPS
11 DATA CENTER CABLE MARKET, BY INSTALLATION TYPE
- 11.1 INTRODUCTION
- 11.2 NEW INSTALLATION
- 11.3 RETROFIT
12 DATA CENTER CABLE MARKET, BY TECHNOLOGY
- 12.1 INTRODUCTION
- 12.2 PASSIVE CABLES
- 12.2.1 INCREASING DEMAND FOR COST-EFFICIENT AND LOW-POWER CONNECTIVITY SOLUTIONS TO DRIVE ADOPTION
- 12.3 ACTIVE CABLES
- 12.3.1 INCREASING NEED FOR HIGH-SPEED, LONG-DISTANCE, AND SIGNAL-OPTIMIZED CONNECTIVITY TO ACCELERATE ADOPTION
- 12.3.2 ACTIVE OPTICAL CABLES
- 12.3.3 ACTIVE COPPER CABLES
13 DATA CENTER CABLE MARKET, BY APPLICATION
- 13.1 INTRODUCTION
- 13.2 RACK-TO-RACK
- 13.2.1 RISING EAST-WEST DATA TRAFFIC AND HIGH-DENSITY DATA CENTER ARCHITECTURES TO DRIVE DEMAND
- 13.3 INTRA-RACK
- 13.3.1 GROWING HIGH-DENSITY SERVER DEPLOYMENTS AND ADOPTION OF LOW-LATENCY COMPUTING TO DRIVE ADOPTION
- 13.4 INTERCONNECT
- 13.4.1 INCREASING DEMAND FOR HIGH-SPEED DATA EXCHANGE BETWEEN NETWORK SYSTEMS TO DRIVE MARKET
- 13.5 STORAGE AREA NETWORK
- 13.5.1 RISING ENTERPRISE DATA STORAGE REQUIREMENTS AND HIGH-SPEED DATA ACCESS NEEDS TO DRIVE DEMAND
14 DATA CENTER CABLE MARKET, BY CABLE TYPE
- 14.1 INTRODUCTION
- 14.2 OPTICAL FIBERS
- 14.2.1 INCREASING DEMAND FOR HIGH-BANDWIDTH AND LONG-DISTANCE DATA TRANSMISSION TO DRIVE ADOPTION
- 14.2.2 SINGLE-MODE FIBER
- 14.2.3 MULTI-MODE FIBER
- 14.2.4 HOLLOW-CORE FIBER
- 14.3 COPPER CABLES
- 14.3.1 INCREASING DEMAND FOR COST-EFFICIENT AND HIGH-PERFORMANCE SHORT-REACH CONNECTIVITY TO DRIVE ADOPTION
- 14.3.2 TWISTED PAIR CABLES
- 14.3.2.1 Cat 5e
- 14.3.2.2 Cat 6
- 14.3.2.3 Cat 6a
- 14.3.2.4 Cat 7
- 14.3.2.5 Cat 7a
- 14.3.2.6 Cat 8
- 14.3.3 TWINAXIAL CABLES
- 14.3.4 COAXIAL CABLES
15 DATA CENTER CABLE MARKET, BY DATA CENTER TYPE
- 15.1 INTRODUCTION
- 15.2 HYPERSCALE DATA CENTERS
- 15.2.1 RAPID EXPANSION OF CLOUD AND AI WORKLOADS TO ACCELERATE DEMAND FOR HIGH-PERFORMANCE CABLING INFRASTRUCTURE
- 15.3 ENTERPRISE DATA CENTERS
- 15.3.1 INCREASING DIGITAL TRANSFORMATION AND ENTERPRISE IT MODERNIZATION TO DRIVE DEMAND
- 15.4 COLOCATION DATA CENTERS
- 15.4.1 INCREASING DEMAND FOR SCALABLE AND HIGHLY INTERCONNECTED INFRASTRUCTURE TO DRIVE ADOPTION
16 DATA CENTER CABLE MARKET, BY WORKLOAD
- 16.1 INTRODUCTION
- 16.2 AI
- 16.2.1 RAPID EXPANSION OF GENERATIVE AI, GPU CLUSTERS, AND HIGH-PERFORMANCE COMPUTING TO DRIVE MARKET
- 16.3 NON-AI
- 16.3.1 GROWING CLOUD COMPUTING, ENTERPRISE DIGITALIZATION, AND DATA TRAFFIC GROWTH TO SUPPORT MARKET GROWTH
17 DATA CENTER CABLE MARKET, BY REGION
- 17.1 INTRODUCTION
- 17.2 NORTH AMERICA
- 17.2.1 MACROECONOMIC OUTLOOK FOR NORTH AMERICA
- 17.2.2 US
- 17.2.2.1 Substantial spending on aerospace and defense innovation to augment market growth
- 17.2.3 CANADA
- 17.2.3.1 Increasing investments in data centers to drive market
- 17.2.4 MEXICO
- 17.2.4.1 Rising digital infrastructure investments and colocation expansion to support market growth
- 17.3 EUROPE
- 17.3.1 MACROECONOMIC OUTLOOK FOR EUROPE
- 17.3.2 GERMANY
- 17.3.2.1 Strong data center expansion and Industry 4.0 adoption to accelerate market growth
- 17.3.3 UK
- 17.3.3.1 Increasing investments in cloud, colocation, and digital infrastructure to drive market
- 17.3.4 FRANCE
- 17.3.4.1 Increasing investments in digital infrastructure and cloud adoption to propel market growth
- 17.3.5 SPAIN
- 17.3.5.1 Growing hyperscale investments and emerging data center hubs to support market growth
- 17.3.6 ITALY
- 17.3.6.1 Increasing digital transformation and data center investments to drive market
- 17.3.7 NETHERLANDS
- 17.3.7.1 Strong colocation ecosystem and strategic connectivity hub to support market growth
- 17.3.8 BELGIUM
- 17.3.8.1 Strategic location and growing data center investments to propel market
- 17.3.9 RUSSIA
- 17.3.9.1 Expansion of domestic data infrastructure and data localization to drive market
- 17.3.10 POLAND
- 17.3.10.1 Emerging data center hub and cloud investments to drive market growth
- 17.3.11 SWITZERLAND
- 17.3.11.1 Strong data security focus and growing colocation demand to propel market
- 17.3.12 SWEDEN
- 17.3.12.1 Strong sustainability focus and hyperscale investments to drive market
- 17.3.13 REST OF EUROPE
- 17.4 ASIA PACIFIC
- 17.4.1 MACROECONOMIC OUTLOOK FOR ASIA PACIFIC
- 17.4.2 CHINA
- 17.4.2.1 Rapid expansion of digital infrastructure and hyperscale data centers to drive market growth
- 17.4.3 INDIA
- 17.4.3.1 Rapid digital transformation and data localization initiatives to drive market growth
- 17.4.4 JAPAN
- 17.4.4.1 Advanced digital infrastructure and hyperscale expansion to drive market growth
- 17.4.5 SINGAPORE
- 17.4.5.1 Strong presence of hyperscale and colocation data centers to drive market growth
- 17.4.6 INDONESIA
- 17.4.6.1 Rapid digital economy expansion and data localization policies to drive market
- 17.4.7 NEW ZEALAND
- 17.4.7.1 Expanding cloud adoption and data center investments to drive market growth
- 17.4.8 SOUTH KOREA
- 17.4.8.1 Strong digital infrastructure and hyperscale investments to drive market growth
- 17.4.9 AUSTRALIA
- 17.4.9.1 Growing cloud adoption and hyperscale data center expansion to drive market growth
- 17.4.10 REST OF ASIA PACIFIC
- 17.5 ROW
- 17.5.1 MACROECONOMIC OUTLOOK FOR ROW
- 17.5.2 SOUTH AMERICA
- 17.5.2.1 Growing investments in digital infrastructure and cloud services to drive demand
- 17.5.2.2 Brazil
- 17.5.2.3 Rest of South America
- 17.5.3 MIDDLE EAST & AFRICA
- 17.5.3.1 Rising hyperscale investments and smart city initiatives to drive market
- 17.5.3.2 GCC Countries
- 17.5.3.3 South Africa
- 17.5.3.4 Rest of Middle East & Africa
18 COMPETITIVE LANDSCAPE
- 18.1 OVERVIEW
- 18.2 KEY PLAYER STRATEGIES/RIGHT TO WIN, 2022-2026
- 18.3 REVENUE ANALYSIS, 2021-2025
- 18.4 MARKET SHARE ANALYSIS, 2025
- 18.5 BRAND COMPARISON
- 18.6 COMPANY EVALUATION MATRIX: KEY PLAYERS, 2025
- 18.6.1 STARS
- 18.6.2 EMERGING LEADERS
- 18.6.3 PERVASIVE PLAYERS
- 18.6.4 PARTICIPANTS
- 18.6.5 COMPANY FOOTPRINT: KEY PLAYERS, 2025
- 18.6.5.1 Company footprint
- 18.6.5.2 Region footprint
- 18.6.5.3 Cable type footprint
- 18.6.5.4 Application footprint
- 18.6.5.5 Data center type footprint
- 18.7 COMPANY EVALUATION MATRIX: STARTUPS/SMES, 2025
- 18.7.1 PROGRESSIVE COMPANIES
- 18.7.2 RESPONSIVE COMPANIES
- 18.7.3 DYNAMIC COMPANIES
- 18.7.4 STARTING BLOCKS
- 18.7.5 COMPETITIVE BENCHMARKING: STARTUPS/SMES, 2025
- 18.7.5.1 Detailed list of key startups/SMEs
- 18.7.5.2 Competitive benchmarking of startups/SMEs
- 18.8 COMPANY VALUATION AND FINANCIAL METRICS
- 18.9 COMPETITIVE SCENARIO
- 18.9.1 PRODUCT LAUNCHES
- 18.9.2 DEALS
19 COMPANY PROFILES
- 19.1 INTRODUCTION
- 19.2 KEY PLAYERS
- 19.2.1 PRYSMIAN GROUP
- 19.2.1.1 Business overview
- 19.2.1.2 Products/Solutions/Services offered
- 19.2.1.3 Recent developments
- 19.2.1.3.1 Product launches
- 19.2.1.3.2 Deals
- 19.2.1.4 MnM view
- 19.2.1.4.1 Key strengths/Right to win
- 19.2.1.4.2 Strategic choices
- 19.2.1.4.3 Weaknesses/Competitive threats
- 19.2.2 NEXANS
- 19.2.2.1 Business overview
- 19.2.2.2 Products/Solutions/Services offered
- 19.2.2.3 MnM view
- 19.2.2.3.1 Key strengths/Right to win
- 19.2.2.3.2 Strategic choices
- 19.2.2.3.3 Weaknesses/Competitive threats
- 19.2.3 FURUKAWA ELECTRIC CO., LTD.
- 19.2.3.1 Business overview
- 19.2.3.2 Products/Solutions/Services offered
- 19.2.3.3 MnM view
- 19.2.3.3.1 Key strengths/Right to win
- 19.2.3.3.2 Strategic choices
- 19.2.3.3.3 Weaknesses/Competitive threats
- 19.2.4 LS CABLE & SYSTEM LTD.
- 19.2.4.1 Business overview
- 19.2.4.2 Products/Solutions/Services offered
- 19.2.4.3 MnM view
- 19.2.4.3.1 Key strengths/Right to win
- 19.2.4.3.2 Strategic choices
- 19.2.4.3.3 Weaknesses/Competitive threats
- 19.2.5 LAPP
- 19.2.5.1 Business overview
- 19.2.5.2 Products/Solutions/Services offered
- 19.2.5.3 Recent developments
- 19.2.5.3.1 Product launches
- 19.2.6 CORNING INCORPORATED
- 19.2.6.1 Business overview
- 19.2.6.2 Products/Solutions/Services offered
- 19.2.6.3 Recent developments
- 19.2.6.3.1 Product launches
- 19.2.6.3.2 Deals
- 19.2.6.4 MnM view
- 19.2.6.4.1 Key strengths/Right to win
- 19.2.6.4.2 Strategic choices
- 19.2.6.4.3 Weaknesses/Competitive threats
- 19.2.7 AMPHENOL CORPORATION
- 19.2.7.1 Business overview
- 19.2.7.2 Products/Solutions/Services offered
- 19.2.7.3 Recent developments
- 19.2.7.3.1 Product launches
- 19.2.7.3.2 Deals
- 19.2.8 BELDEN INC.
- 19.2.8.1 Business overview
- 19.2.8.2 Products/Solutions/Services offered
- 19.2.8.3 Recent developments
- 19.2.8.3.1 Product launches
- 19.2.8.3.2 Deals
- 19.2.9 TE CONNECTIVITY
- 19.2.9.1 Business overview
- 19.2.9.2 Products/Solutions/Services offered
- 19.2.9.3 Recent developments
- 19.2.9.3.1 Product launches
- 19.2.9.3.2 Deals
- 19.2.10 PANDUIT CORP.
- 19.2.10.1 Business overview
- 19.2.10.2 Products/Solutions/Services offered
- 19.2.10.3 Recent developments
- 19.2.10.3.1 Product launches
- 19.2.11 SUMITOMO ELECTRIC INDUSTRIES, LTD.
- 19.2.11.1 Business overview
- 19.2.11.2 Products/Solutions/Services offered
- 19.2.11.3 Recent developments
- 19.2.11.3.1 Deals
- 19.2.12 ELAND CABLES
- 19.2.12.1 Business overview
- 19.2.12.2 Products/Solutions/Services offered
- 19.2.13 POLYCAB INDIA LIMITED
- 19.2.13.1 Business overview
- 19.2.13.2 Products/Solutions/Services offered
- 19.2.14 KEI INDUSTRIES LIMITED
- 19.2.14.1 Business overview
- 19.2.14.2 Products/Solutions/Services offered
- 19.2.1 PRYSMIAN GROUP
- 19.3 OTHER PLAYERS
- 19.3.1 YANGTZE OPTICAL FIBRE AND CABLE JOINT STOCK LIMITED COMPANY (YOFC)
- 19.3.2 HUBER+SUHNER
- 19.3.3 ROSENBERGER-OSI
- 19.3.4 MOLEX
- 19.3.5 AFL
- 19.3.6 ZTT
- 19.3.7 STL TECH
- 19.3.8 HFCL
- 19.3.9 SUPERIOR ESSEX INC.
- 19.3.10 OPTICAL CABLE CORPORATION
- 19.3.11 10GTEK TRANSCEIVERS CO., LTD.
20 RESEARCH METHODOLOGY
- 20.1 RESEARCH DATA
- 20.1.1 SECONDARY DATA
- 20.1.1.1 List of key secondary sources
- 20.1.1.2 Key data from secondary sources
- 20.1.2 PRIMARY DATA
- 20.1.2.1 List of primary interview participants
- 20.1.2.2 Breakdown of primary sources
- 20.1.2.3 Key data from primary sources
- 20.1.2.4 Key industry insights
- 20.1.3 SECONDARY AND PRIMARY RESEARCH
- 20.1.1 SECONDARY DATA
- 20.2 MARKET SIZE ESTIMATION
- 20.2.1 BOTTOM-UP APPROACH
- 20.2.1.1 Approach to arrive at market size using bottom-up analysis (demand side)
- 20.2.2 TOP-DOWN APPROACH
- 20.2.2.1 Approach to arrive at market size using top-down analysis (supply side)
- 20.2.1 BOTTOM-UP APPROACH
- 20.3 FACTOR ANALYSIS
- 20.3.1 DEMAND-SIDE ANALYSIS
- 20.3.2 SUPPLY-SIDE ANALYSIS
- 20.4 MARKET BREAKDOWN AND DATA TRIANGULATION
- 20.5 RESEARCH ASSUMPTIONS
- 20.6 RISK ASSESSMENT
- 20.7 RESEARCH LIMITATIONS
21 APPENDIX
- 21.1 DISCUSSION GUIDE
- 21.2 KNOWLEDGESTORE: MARKETSANDMARKETS' SUBSCRIPTION PORTAL
- 21.3 CUSTOMIZATION OPTIONS
- 21.4 RELATED REPORTS
- 21.5 AUTHOR DETAILS
