|
시장보고서
상품코드
2064083
에너지 및 유틸리티 사업용 애널리틱스 시장 : 용도별, 최종사용자별 - 세계 예측(-2031년)Energy and Utilities Analytics Market by Application, End User - Global Forecast to 2031 |
||||||
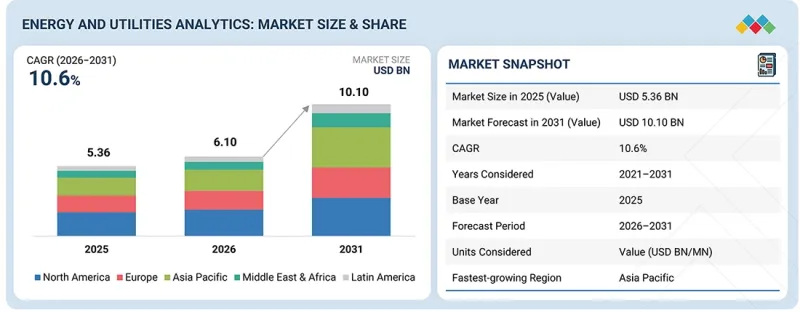
세계의 에너지 및 유틸리티 사업용 애널리틱스 시장 규모는 빠르게 확대하고 있으며, 2026년 약 61억 달러에서 2031년에는 101억 달러로 성장할 것으로 예상되며, CAGR은 10.6%에 달할 것으로 예측됩니다.
이 시장은 몇 가지 촉진요인에 힘입어 눈부신 성장을 이루고 있습니다.
| 조사 범위 | |
|---|---|
| 조사 대상 기간 | 2021-2031년 |
| 기준 연도 | 2025년 |
| 예측 기간 | 2026-2031년 |
| 단위 | 금액(달러) |
| 부문 | 제공, 도입 형태, 조직 형태, 용도, 최종사용자 |
| 대상 지역 | 북미, 유럽, 아시아태평양, 중동 및 아프리카, 라틴아메리카 |
그중에서도 중요한 것은, 분석 시스템 도입을 촉진하고 운영 효율을 높이기 위한 송배전망 현대화에 대한 투자를 확대하는 것입니다. 또한, 재생에너지의 보급이 확대됨에 따라 변동성을 관리하고 신뢰성을 확보하기 위한 첨단 예측 솔루션이 필요해지고 있습니다. 스마트 계량기의 광범위한 도입은 유틸리티 사업자의 업무를 혁신하고 있으며, 데이터 기반 의사결정으로의 전환과 자원 관리의 최적화를 가능하게 하고 있습니다. 이러한 발전은 지속가능성과 현대화를 향한 업계의 전환과 부합하며, 유틸리티 사업자의 역량을 크게 향상시키고 있습니다.

그럼에도 불구하고, 시장에는 큰 제약과 과제가 존재합니다. 레거시 인프라는 큰 장벽이 되어, 고급 분석 기능의 통합을 제한하고, 유틸리티 사업자가 기술 혁신의 혜택을 충분히 누리는 것을 방해하고 있습니다. 사이버 보안 및 데이터 개인정보 보호에 대한 우려도 도입 과정을 더욱 복잡하게 만들고 있으며, 이는 비용 증가와 운영 위험의 확대로 이어지고 있습니다. 한편, 기회도 존재합니다. 특히, AI를 활용한 예측 유지보수는 새로운 수익원을 창출하고 서비스의 신뢰성을 높일 가능성이 있습니다. 또한, 전기자동차의 보급 확대에 따라 부하 분석에 대한 수요가 증가하고 있으며, 엣지 분석을 촉진하는 분산형 에너지 시스템으로의 전환 역시 큰 성장 기회를 가져오고 있습니다. 다만, 대규모 도입 시 투자 대비 효과의 입증은 여전히 과제로 남아 있으며, 실시간 데이터 처리의 필요성으로 인해 발생하는 복잡성도 과제로 대두되고 있습니다.
“업종별로는 소매·E-Commerce가 예측 기간 동안 가장 높은 성장률을 보일 것으로 전망”
“제공 부문별로는 서비스가 가장 높은 성장세를 보일 것으로 전망”
유틸리티 사업자들이 디지털 전환을 추진함에 따라 컨설팅, 시스템 통합, 매니지드 서비스, 분석 솔루션 도입 지원에 대한 수요가 점점 더 높아짐에 따라, 해당 서비스 분야는 급속히 성장할 것으로 전망됩니다. 에너지 및 유틸리티 사업용 애널리틱스 시장은 조직이 견고한 분석 솔루션을 적절하게 도입, 통합, 관리 및 유지할 수 있도록 돕는 필수적인 전문적·운영적 지원 서비스를 제공합니다. 이러한 서비스는 컨설팅, 도입, 맞춤화, 시스템 통합, 기술 지원, 지속적인 관리를 포함하여 분석의 전체 라이프사이클에 걸쳐 유틸리티 사업자에게 매우 중요합니다. 에너지 인프라, 스마트 그리드 사업, 분산형 에너지 자원의 복잡성이 증가함에 따라, 유틸리티 사업자들은 방대한 양의 운영 데이터를 효과적으로 관리하기 위해 전문 서비스 제공업체에 의존하고 있습니다. 예지 유지보수 지원, 자산 성과 분석, 정전 관리 최적화, 고객 분석, 규제 보고 지원과 같은 일반적인 서비스는 발전을 촉진하는 데 중요합니다. 클라우드 컴퓨팅, AI, IoT 기술의 도입이 급증하는 가운데, 통합, 사이버 보안, 기술 지원 서비스에 대한 필요성은 더욱 커지고 있습니다. 유틸리티 사업자가 디지털 전환의 길을 걷기 시작할 때, 분석 서비스를 활용하는 것은 단순히 유익할 뿐만 아니라, 운영 효율성 향상, 가동 중단 시간 단축, 신뢰할 수 있는 에너지 사업 확보를 위해 필수적입니다.
“도입 형태별로는 클라우드 기반이 예측 기간 동안 가장 높은 성장률을 보일 것으로 전망”
에너지 및 유틸리티 사업용 애널리틱스 시장에서 클라우드 도입 부문은 상당한 성장이 예상됩니다. 이는 유틸리티 사업 운영 전반에 걸쳐 확장성이 뛰어나고, 실시간으로 처리되며, 비용 효율성이 뛰어난 분석 솔루션에 대한 수요가 증가하고 있기 때문입니다. 이러한 맥락에서 클라우드 도입을 실현하기 위해서는 Software-as-a-Service(SaaS) 및 Platform-as-a-Service(PaaS)를 포함한 클라우드 기반 인프라 모델을 통해 분석 플랫폼, 애플리케이션, 데이터 처리 기능을 제공하는 것이 포함됩니다. 이 모델을 통해 유틸리티 사업자는 원격으로 분석 솔루션에 접근할 수 있게 되어, 대규모 온프레미스 인프라를 관리해야 할 필요성이 줄어듭니다. 클라우드 도입에는 확장성 향상, 데이터 액세스의 일원화, 원격 시스템 모니터링, 유틸리티 사업 운영 전반에 걸친 애플리케이션 도입 가속화 등 여러 가지 장점이 있습니다. 조직이 클라우드 기반 분석 환경을 점점 더 많이 도입함에 따라, 스마트 그리드 운영, 수요 예측, 정전 모니터링, 재생에너지 통합, 고객 분석 등의 업무를 보다 효과적으로 관리할 수 있게 됩니다. SaaS 모델은 유틸리티 사업자에게 필수적인 분석 애플리케이션에 대한 구독 기반의 접근 권한을 제공하며, PaaS 환경은 분석 솔루션의 개발, 통합 및 맞춤 설정을 용이하게 합니다.
또한, 클라우드 도입을 통해 조직은 상호연결된 인프라 및 IoT 지원 기기에서 생성되는 방대한 양의 운영 데이터를 효율적으로 처리할 수 있게 됩니다. 또한, 이러한 클라우드 환경은 유틸리티 사업 전반의 업무에서 AI, 고도화된 예측 기능, 자동 보고서 기능의 통합을 지원합니다. 진행 중인 디지털 전환에 더해, 인프라 관리 비용 절감과 운영 측면에서의 확장성에 대한 수요가 증가함에 따라 에너지 분야에서 클라우드 기반 분석 도입 모델의 채택이 지속적으로 촉진되고 있으며, 이는 유망한 성장 기회를 창출하고 있습니다.
본 보고서에서는 전 세계 에너지 및 유틸리티 사업용 애널리틱스 솔루션 시장을 조사하여, 시장 개요, 시장 성장에 영향을 미치는 다양한 요인에 대한 분석, 기술 및 특허 동향, 법규제 환경, 사례 연구, 시장 규모 추정 및 전망, 각종 분류·지역/주요 국가별 상세 분석, 경쟁 현황, 주요 기업 개요 등을 정리하고 있습니다.
자주 묻는 질문
목차
제1장 소개
제2장 주요 요약
제3장 주요 인사이트
제4장 시장 개요
제5장 업계 동향
제6장 전략적 파괴 : 특허, 디지털, AI의 도입
제7장 규제 상황
제8장 고객 상황과 구매 행동
제9장 에너지 및 유틸리티 사업용 애널리틱스 시장 : 제공별
제10장 에너지 및 유틸리티 사업용 애널리틱스 시장 : 도입 형태별
제11장 에너지 및 유틸리티 사업용 애널리틱스 시장 : 용도별
제12장 에너지 및 유틸리티 사업용 애널리틱스 시장 : 조직 유형별
제13장 에너지 및 유틸리티 사업용 애널리틱스 시장 : 최종사용자별
제14장 에너지 및 유틸리티 사업용 애널리틱스 시장 : 지역별
제15장 경쟁 구도
제16장 기업 개요
제17장 조사 방법
제18장 부록
KSMThe global energy and utilities analytics market is expanding rapidly, with a projected market size rising from about USD 6.10 billion in 2026 to USD 10.10 billion by 2031, for a CAGR of 10.6%. The market is experiencing significant growth due to several driving factors.
| Scope of the Report | |
|---|---|
| Years Considered for the Study | 2021-2031 |
| Base Year | 2025 |
| Forecast Period | 2026-2031 |
| Units Considered | Value (USD Billion) |
| Segments | Offering, Deployment Mode, Organization Type, Application, and End User |
| Regions covered | North America, Europe, Asia Pacific, Middle East & Africa, Latin America |
Key among these is the expansion of grid modernization investments, which enhance analytics deployment and improve operational efficiency. Additionally, the rising penetration of renewable energy sources necessitates advanced forecasting solutions to manage variability and ensure reliability. The widespread rollout of smart meters is also transforming utility operations, enabling a transition to data-driven decision-making and optimizing resource management. These advancements align with the industry's shift toward sustainability and modernization, significantly enhancing the capabilities of utilities.
Despite this, the market faces notable restraints and challenges. Legacy infrastructure poses a significant barrier, limiting the integration of advanced analytics and preventing utilities from fully capitalizing on technological innovations. Cybersecurity and data privacy concerns further complicate deployment efforts, resulting in increased costs and operational risks. Opportunities exist, particularly in the form of AI-driven predictive maintenance, which can create new revenue streams and improve service reliability. The growing demand for load analytics, driven by the rising adoption of electric vehicles and the shift toward decentralized energy systems that promote edge analytics, also presents significant avenues for growth. However, demonstrating return on investment for large-scale deployments remains a challenge, alongside the complexities introduced by the need for real-time data processing.
"By vertical, retail & ecommerce is set to witness the fastest growth rate during the forecast period."
"Among offerings, services are projected to account for the highest growth."
Services are projected to grow rapidly as utilities increasingly require consulting, system integration, managed services, and analytics implementation support for digital transformation initiatives. The energy and utilities analytics market offers essential professional and operational support services that empower organizations to successfully implement, integrate, manage, and maintain robust analytics solutions. These services are crucial for utilities throughout the entire analytics lifecycle, including consulting, deployment, customization, system integration, technical support, and ongoing management. As the complexity of energy infrastructures, smart grid initiatives, and distributed energy resources increases, utilities are turning to expert service providers to effectively manage vast quantities of operational data. Common offerings such as predictive maintenance support, asset performance analytics, outage management optimization, customer analytics, and regulatory reporting assistance are vital for driving progress. The surge in cloud computing, artificial intelligence, and IoT technology adoption intensifies the need for integration, cybersecurity, and technical support services. As utilities embark on their digital transformation journeys, leveraging analytics services is not just beneficial; it is imperative for enhancing operational efficiency, reducing downtime, and ensuring reliable energy operations.
"By deployment mode, cloud-based is projected to experience the highest growth during the forecast period."
The cloud deployment segment is anticipated to experience significant growth within the energy and utilities analytics market, attributed to the rising demand for scalable, real-time, and cost-efficient analytics solutions throughout utility operations. The implementation of cloud deployment in this context entails the provision of analytics platforms, applications, and data processing capabilities via cloud-based infrastructure models, including Software-as-a-Service (SaaS) and Platform-as-a-Service (PaaS). This model enables utility companies to access analytics solutions remotely, thereby alleviating the necessity for extensive on-premises infrastructure management. Cloud deployment offers several advantages, such as enhanced scalability, centralized data access, remote system monitoring, and expedited application implementation across utility operations. As organizations increasingly adopt cloud-based analytics environments, they are better equipped to manage smart grid operations, demand forecasting, outage monitoring, renewable energy integration, and customer analytics initiatives. The SaaS model grants utilities subscription-based access to essential analytics applications, while the PaaS environment facilitates the development, integration, and customization of analytics solutions.
Furthermore, cloud deployment allows entities to efficiently handle the substantial volumes of operational data generated by interconnected infrastructure and Internet of Things (IoT)-enabled devices. Additionally, these cloud environments support the integration of artificial intelligence, advanced forecasting capabilities, and automated reporting functions across utility operations. The ongoing digital transformation, coupled with reduced infrastructure management costs and an increasing demand for operational scalability, continues to propel the adoption of cloud-based analytics deployment models within the energy sector, presenting a compelling opportunity for advancement.
"Asia Pacific is set to register the highest CAGR in the energy and utilities analytics market, in terms of value, during the forecast period."
The Asia Pacific region is projected to be the fastest-growing market for energy and utilities analytics, driven by capacity additions and government mandates for energy security and decarbonization. China and India lead in demand, with substantial investments in AI-driven analytics for power management. Mature markets like Japan, Australia, and South Korea utilize analytics for energy diversification and net-zero goals. In Southeast Asia, countries like Indonesia and Vietnam are rapidly adopting analytics for outage management and network planning. Diverse regulatory environments create both challenges and opportunities for analytics vendors. Cloud-native deployments are increasing in newer digital markets, while larger utilities in China and India favor on-premise solutions, guided by government initiatives promoting AI and machine learning in the power sector.
Breakdown of Primaries
In-depth interviews were conducted with Chief Executive Officers (CEOs), innovation and technology directors, system integrators, and executives from various key organizations operating in the energy and utilities analytics market.
- By Company: Tier 1 - 34%, Tier 2 - 43%, and Tier 3 - 23%
- By Designation: Directors - 30%, C-level - 50%, and others - 20%
- By Region: North America - 25%, Europe - 30%, Asia Pacific - 30%, Middle East & Africa - 10%, and Latin America - 5%
The report includes a study of key players in the energy and utilities analytics market. It profiles major vendors in the energy and utilities analytics market. The major market players include IBM (US), SAP (Germany), SAS (US), Oracle (US), Microsoft (US), Amazon Web Services (US), Google (US), Teradata (US), Snowflake (US), Siemens (Germany), Schneider Electric (France), ABB (Switzerland), GE Digital (US), Hitachi Energy (Switzerland), AVEVA (UK), Bentley Systems (US), Itron (US), Landis+Gyr (Switzerland), Salesforce (US), TIBCO (US), Infor (US), Autodesk (US), Uplight (US), EnergyCAP (US), KUBRA (US), EnergyHub (US), Enel X (Italy), Next Kraftwerke (Germany), Voltus (US), FIS (US), ION Group (UK), KX (US), Amphora (UK), Sphera (US), Enablon (France), Persefoni (US), C3.ai (US), Palantir (US), and Databricks (US).
Research Coverage
The energy and utilities analytics market is segmented by various factors to provide a comprehensive overview of its offerings, deployment modes, applications, organization types, and end users. The offerings are mainly divided into platforms and services, where the services covered are managed services and professional services (consulting & advisory, system integration & deployment, custom analytics & model development, and support & maintenance). In terms of deployment mode, the market is categorized into cloud, on-premises, hybrid, and edge solutions. Applications within the market span across grid & network analytics, asset & operations analytics, customer & commercial analytics, energy production & DER analytics, energy trading & market analytics, sustainability & ESG analytics, as well as other applications. The market is also segmented by organization type into large integrated utilities, mid-size/regional utilities, independent power producers, energy retailers/aggregators, and commercial & industrial energy users. Finally, the end users of energy and utilities analytics are categorized into power utilities, oil & gas, renewable energy operators, and water & waste utilities. The regions covered are North America, Europe, Asia Pacific, the Middle East & Africa, and Latin America.
The report's scope covers detailed information regarding the major factors, such as drivers, restraints, challenges, and opportunities, influencing the growth of the energy and utilities analytics market. A detailed analysis of the key industry players was done to provide insights into their business overview, solutions, and services; key strategies; contracts, partnerships, agreements, new product & service launches, and mergers and acquisitions; and recent developments associated with the energy and utilities analytics market. This report also covers the competitive analysis of upcoming startups in the energy and utilities analytics market ecosystem.
Reason to buy this Report
The report would provide market leaders and new entrants with information on the closest approximations of the revenue numbers for the overall energy and utilities analytics market and its subsegments. It would help stakeholders understand the competitive landscape and gain more insights to better position their businesses and plan suitable go-to-market strategies. It also helps stakeholders understand the market's pulse and provides them with information on key market drivers, restraints, challenges, and opportunities.
The report provides insights into the following pointers:
- Analysis of key drivers (grid modernization investments are expanding analytics deployment, rising renewable energy penetration is increasing forecasting requirements, smart meter rollouts accelerating data-driven utility operations), restraints (Legacy infrastructure limits analytics integration, cybersecurity and data privacy requirements increase deployment costs), opportunities (AI-driven predictive maintenance is creating new value streams, electric vehicle growth is expanding demand for load analytics, decentralized energy systems are driving edge analytics adoption), and challenges (demonstrating ROI across large-scale deployments remains difficult, real-time processing requirements increase infrastructure complexity)
- Product Development/Innovation: Detailed insights on upcoming technologies, research & development activities, and new product & service launches in the energy and utilities analytics market
- Market Development: Comprehensive information about lucrative markets - the report analyses the energy and utilities analytics market across varied regions
- Market Diversification: Exhaustive information about new products & services, untapped geographies, recent developments, and investments in the energy and utilities analytics market
- Competitive Assessment: In-depth assessment of market shares, growth strategies and service offerings of leading players such as IBM (US), SAP (Germany), SAS (US), Oracle (US), Microsoft (US), Amazon Web Services (US), Google (US), Teradata (US), Snowflake (US), Siemens (Germany), Schneider Electric (France), ABB (Switzerland), GE Digital (US), Hitachi Energy (Switzerland), AVEVA (UK), Bentley Systems (US), Itron (US), Landis+Gyr (Switzerland), Salesforce (US), TIBCO (US), Infor (US), Autodesk (US), Uplight (US), EnergyCAP (US), KUBRA (US), EnergyHub (US), Enel X (Italy), Next Kraftwerke (Germany), Voltus (US), FIS (US), ION Group (UK), KX (US), Amphora (UK), Sphera (US), Enablon (France), Persefoni (US), C3.ai (US), Palantir (US), and Databricks (US). The report also helps stakeholders understand the energy and utilities analytics market's pulse and provides information on key market drivers, restraints, challenges, and opportunities
TABLE OF CONTENTS
1 INTRODUCTION
- 1.1 STUDY OBJECTIVES
- 1.2 MARKET DEFINITION
- 1.2.1 INCLUSIONS AND EXCLUSIONS
- 1.3 MARKET SCOPE
- 1.3.1 MARKET SEGMENTATION
- 1.3.2 YEARS CONSIDERED
- 1.4 CURRENCY CONSIDERED
- 1.5 STAKEHOLDERS
- 1.6 SUMMARY OF CHANGES
2 EXECUTIVE SUMMARY
- 2.1 MARKET HIGHLIGHTS AND KEY INSIGHTS
- 2.2 KEY MARKET PARTICIPANTS: MAPPING OF STRATEGIC DEVELOPMENTS
- 2.3 DISRUPTIVE TRENDS IN ENERGY AND UTILITIES ANALYTICS MARKET
- 2.4 HIGH GROWTH SEGMENTS
- 2.5 REGIONAL SNAPSHOT: MARKET SIZE, GROWTH RATE, AND FORECAST
3 PREMIUM INSIGHTS
- 3.1 ATTRACTIVE OPPORTUNITIES IN ENERGY AND UTILITIES ANALYTICS MARKET
- 3.2 ENERGY AND UTILITIES ANALYTICS MARKET: TOP THREE APPLICATIONS
- 3.3 NORTH AMERICA: ENERGY AND UTILITIES ANALYTICS MARKET, BY OFFERING AND END USER
- 3.4 ENERGY AND UTILITIES ANALYTICS MARKET, BY REGION
- 3.5 ENERGY AND UTILITIES ANALYTICS MARKET, BY REGION
4 MARKET OVERVIEW
- 4.1 INTRODUCTION
- 4.2 MARKET DYNAMICS
- 4.2.1 DRIVERS
- 4.2.1.1 Grid modernization investments expanding analytics deployment
- 4.2.1.2 Rising renewable energy penetration is increasing forecasting requirements
- 4.2.1.3 Smart meter rollouts accelerating data-driven utility operations
- 4.2.2 RESTRAINTS
- 4.2.2.1 Legacy infrastructure limits analytics integration
- 4.2.2.2 Cybersecurity and data privacy requirements increase deployment costs
- 4.2.3 OPPORTUNITIES
- 4.2.3.1 AI-driven predictive maintenance is creating new value streams
- 4.2.3.2 Electric vehicle growth is expanding demand for load analytics
- 4.2.3.3 Decentralized energy systems are driving edge analytics adoption
- 4.2.4 CHALLENGES
- 4.2.4.1 Demonstrating ROI across large-scale deployments remains difficult
- 4.2.4.2 Real-time processing requirements increase infrastructure complexity
- 4.2.1 DRIVERS
- 4.3 UNMET NEEDS AND WHITE SPACES
- 4.3.1 UNMET NEEDS IN ENERGY AND UTILITIES ANALYTICS MARKET
- 4.3.2 WHITE SPACE OPPORTUNITIES
- 4.4 INTERCONNECTED MARKETS AND CROSS-SECTOR OPPORTUNITIES
- 4.4.1 INTERCONNECTED MARKETS
- 4.4.2 CROSS-SECTOR OPPORTUNITIES
- 4.5 STRATEGIC MOVES BY TIER-1/2/3 PLAYERS
5 INDUSTRY TRENDS
- 5.1 EVOLUTION OF ENERGY AND UTILITIES ANALYTICS
- 5.2 PORTER'S FIVE FORCES ANALYSIS
- 5.2.1 THREAT OF NEW ENTRANTS
- 5.2.2 THREAT OF SUBSTITUTES
- 5.2.3 BARGAINING POWER OF SUPPLIERS
- 5.2.4 BARGAINING POWER OF BUYERS
- 5.2.5 INTENSITY OF COMPETITIVE RIVALRY
- 5.3 MACROECONOMIC OUTLOOK
- 5.3.1 INTRODUCTION
- 5.3.2 GDP TRENDS AND FORECAST
- 5.3.3 TRENDS IN GLOBAL ARTIFICIAL INTELLIGENCE (AI) INDUSTRY
- 5.3.4 TRENDS IN GLOBAL SMART GRID & DIGITAL UTILITY INDUSTRY
- 5.4 SUPPLY CHAIN ANALYSIS
- 5.5 ECOSYSTEM ANALYSIS
- 5.5.1 GRID & NETWORK ANALYTICS PROVIDERS
- 5.5.2 ASSET & OPERATIONS ANALYTICS PROVIDERS
- 5.5.3 CUSTOMER AND COMMERCIAL ANALYTICS
- 5.5.4 ENERGY PRODUCTION & DER ANALYTICS
- 5.5.5 ENERGY TRADING & MARKET ANALYTICS PROVIDERS
- 5.5.6 SUSTAINABILITY & ESG ANALYTICS PROVIDERS
- 5.6 PRICING ANALYSIS
- 5.6.1 AVERAGE SELLING PRICE OF OFFERINGS, BY KEY PLAYER, 2025
- 5.6.2 AVERAGE SELLING PRICE, BY APPLICATION
- 5.7 KEY CONFERENCES AND EVENTS, 2026-2027
- 5.8 TRENDS/DISRUPTIONS IMPACTING CUSTOMERS' BUSINESSES
- 5.9 INVESTMENT AND FUNDING SCENARIO
- 5.10 CASE STUDY ANALYSIS
- 5.10.1 SIEMENS ADVANTA AND BKW ENABLE SCALABLE DIGITAL UTILITY TRANSFORMATION
- 5.10.2 GE VERNOVA AND DUKE ENERGY IMPROVE POWER PLANT PERFORMANCE THROUGH DIGITAL MONITORING
- 5.10.3 IBM AND ANGLIAN WATER MODERNIZE UTILITY DATA MANAGEMENT AND OPERATION
- 5.10.4 ABB AND EYA-BANTU ENABLE DIGITALIZED UTILITY OPERATIONS THROUGH ADVANCED ANALYTICS
- 5.10.5 GOOGLE CLOUD AND ENERGYWORX ENABLE SCALABLE SMART ENERGY ANALYTICS PLATFORM
6 STRATEGIC DISRUPTION: PATENTS, DIGITAL, AND AI ADOPTION
- 6.1 KEY EMERGING TECHNOLOGIES
- 6.1.1 ADVANCED METERING INFRASTRUCTURE (AMI)
- 6.1.2 MACHINE LEARNING AND ARTIFICIAL INTELLIGENCE
- 6.1.3 DISTRIBUTED ENERGY RESOURCE MANAGEMENT SYSTEMS (DERMS)
- 6.1.4 DIGITAL TWIN TECHNOLOGY
- 6.2 COMPLEMENTARY TECHNOLOGIES
- 6.2.1 EDGE COMPUTING
- 6.2.2 CLOUD COMPUTING
- 6.2.3 INTERNET OF THINGS (IOT)
- 6.3 ADJACENT TECHNOLOGIES
- 6.3.1 BLOCKCHAIN FOR ENERGY TRANSACTIONS
- 6.3.2 IEC COMMON INFORMATION MODEL (CIM)
- 6.3.3 GEOGRAPHIC INFORMATION SYSTEMS (GIS)
- 6.4 PATENT ANALYSIS
- 6.4.1 METHODOLOGY
- 6.4.2 PATENTS FILED, BY DOCUMENT TYPE
- 6.4.3 INNOVATION AND PATENT APPLICATIONS
- 6.5 IMPACT OF AI ON ENERGY AND UTILITIES ANALYTICS MARKET
- 6.5.1 BEST PRACTICES IN ENERGY AND UTILITIES ANALYTICS MARKET
- 6.5.2 INTERCONNECTED ECOSYSTEM AND IMPACT ON MARKET PLAYERS IN AI-DRIVEN ENERGY AND UTILITIES ANALYTICS
- 6.5.3 CLIENTS' READINESS TO ADOPT AI-INTEGRATED ENERGY AND UTILITIES ANALYTICS
7 REGULATORY LANDSCAPE
- 7.1 REGIONAL REGULATIONS AND COMPLIANCE
- 7.1.1 REGULATORY BODIES, GOVERNMENT AGENCIES, AND OTHER ORGANIZATIONS
- 7.1.2 KEY REGULATIONS
- 7.1.2.1 North America
- 7.1.2.1.1 Federal Energy Regulatory Commission FERC Order 2222 (US)
- 7.1.2.1.2 North American Electric Reliability Corporation Critical Infrastructure Protection Framework (NERC CIP) (US)
- 7.1.2.1.3 Canadian Energy Regulator Act (Canada)
- 7.1.2.2 Europe
- 7.1.2.2.1 Electricity Regulation 2019/943 and Internal Electricity Market Framework (European Union)
- 7.1.2.2.2 NIS2 Directive Framework (Network and Information Security Directive 2) (European Union)
- 7.1.2.2.3 Energy Act 2023(UK)
- 7.1.2.2.4 Bundesnetzagentur Energy Industry Act (Germany)
- 7.1.2.2.5 Commission de Regulation de l'Energie (CRE) Framework (France)
- 7.1.2.2.6 Autorita di Regolazione per Energia Reti e Ambiente Framework (ARERA) (Italy)
- 7.1.2.3 Asia Pacific
- 7.1.2.3.1 Energy Law of the People's Republic of China (China)
- 7.1.2.3.2 Electricity Act, 2003 (India)
- 7.1.2.3.3 Basic Act on Energy Policy (2002) (Japan)
- 7.1.2.4 Middle East & Africa
- 7.1.2.4.1 The Electricity Law (Royal Decree No. M/44) (Saudi Arabia)
- 7.1.2.4.2 Federal Decree-Law No. 11 of 2024 (UAE)
- 7.1.2.4.3 Electricity Market Law No. 6446 (Turkey)
- 7.1.2.4.4 Electricity Regulation Act, 2006 (South Africa)
- 7.1.2.5 Latin America
- 7.1.2.5.1 Agencia Nacional de Energia Eletrica Framework (ANEE) (Brazil)
- 7.1.2.5.2 Ley del Sector Electrico (LESE) (Mexico)
- 7.1.2.1 North America
- 7.1.3 INDUSTRY STANDARDS
8 CUSTOMER LANDSCAPE & BUYER BEHAVIOR
- 8.1 DECISION-MAKING PROCESS
- 8.2 KEY STAKEHOLDERS INVOLVED IN BUYING PROCESS AND THEIR EVALUATION CRITERIA
- 8.2.1 KEY STAKEHOLDERS IN BUYING PROCESS
- 8.2.2 BUYING CRITERIA
- 8.3 ADOPTION BARRIERS & INTERNAL CHALLENGES
- 8.4 UNMET NEEDS FROM VARIOUS INDUSTRY END USERS
9 ENERGY AND UTILITIES ANALYTICS MARKET, BY OFFERING
- 9.1 INTRODUCTION
- 9.1.1 OFFERING: ENERGY AND UTILITIES ANALYTICS MARKET DRIVERS
- 9.2 PLATFORMS
- 9.2.1 ENABLING UTILITY DATA INTEGRATION, OPERATIONAL MONITORING, AND REAL-TIME ANALYTICS ACROSS ENERGY INFRASTRUCTURE
- 9.3 SERVICES
- 9.3.1 PROFESSIONAL SERVICES
- 9.3.1.1 Enhancing utility modernization and analytics adoption through expert consulting, integration, and technical support services
- 9.3.1.2 Consulting & advisory
- 9.3.1.3 System integration & deployment
- 9.3.1.4 Custom analytics & model development
- 9.3.1.5 Support & maintenance
- 9.3.2 MANAGED SERVICES
- 9.3.2.1 Supporting analytics operations and infrastructure management through outsourced monitoring and technical support services
- 9.3.1 PROFESSIONAL SERVICES
10 ENERGY AND UTILITIES ANALYTICS MARKET, BY DEPLOYMENT MODE
- 10.1 INTRODUCTION
- 10.1.1 DEPLOYMENT MODE: ENERGY AND UTILITIES ANALYTICS MARKET DRIVERS
- 10.2 CLOUD
- 10.2.1 SUPPORTING SCALABLE ANALYTICS ACCESS AND CENTRALIZED DATA PROCESSING THROUGH CLOUD-BASED DEPLOYMENT MODELS
- 10.3 ON-PREMISES
- 10.3.1 STRENGTHENING DATA CONTROL AND INFRASTRUCTURE SECURITY THROUGH INTERNALLY MANAGED ANALYTICS ENVIRONMENTS
- 10.4 HYBRID
- 10.4.1 BALANCING OPERATIONAL FLEXIBILITY AND INFRASTRUCTURE CONTROL THROUGH INTEGRATED DEPLOYMENT ARCHITECTURES
- 10.5 EDGE
- 10.5.1 ENABLING REAL-TIME ANALYTICS PROCESSING AND LOW-LATENCY OPERATIONAL MONITORING ACROSS CONNECTED UTILITY INFRASTRUCTURE
11 ENERGY AND UTILITIES ANALYTICS MARKET, BY APPLICATION
- 11.1 INTRODUCTION
- 11.1.1 APPLICATION: ENERGY AND UTILITIES ANALYTICS MARKET DRIVERS
- 11.2 GRID & NETWORK ANALYTICS
- 11.2.1 IMPROVING GRID VISIBILITY, RELIABILITY, AND OPERATIONAL PERFORMANCE THROUGH REAL-TIME NETWORK ANALYTICS APPLICATIONS
- 11.2.2 OUTAGE PREDICTION & RESTORATION
- 11.2.3 GRID RELIABILITY & PERFORMANCE
- 11.2.4 LOSS DETECTION
- 11.2.5 VOLTAGE OPTIMIZATION
- 11.3 ASSET & OPERATIONS ANALYTICS
- 11.3.1 IMPROVING INFRASTRUCTURE RELIABILITY AND OPERATIONAL EFFICIENCY THROUGH ASSET PERFORMANCE AND MAINTENANCE ANALYTICS
- 11.3.2 PREDICTIVE MAINTENANCE
- 11.3.3 ASSET HEALTH MONITORING
- 11.3.4 FAILURE PREDICTION
- 11.3.5 WORKFORCE/FIELD SERVICE OPTIMIZATION
- 11.4 CUSTOMER & COMMERCIAL ANALYTICS
- 11.4.1 SUPPORTING CUSTOMER MANAGEMENT, REVENUE OPERATIONS, AND ENERGY CONSUMPTION ANALYSIS THROUGH COMMERCIAL ANALYTICS APPLICATIONS
- 11.4.2 CUSTOMER SEGMENTATION & CHURN
- 11.4.3 BILLING & REVENUE ANALYTICS
- 11.4.4 CONSUMPTION INSIGHTS
- 11.4.5 DEMAND-SIDE ANALYTICS
- 11.5 ENERGY PRODUCTION & DER ANALYTICS
- 11.5.1 SUPPORTING DISTRIBUTED ENERGY MANAGEMENT AND GENERATION PERFORMANCE MONITORING THROUGH PRODUCTION ANALYTICS APPLICATIONS
- 11.5.2 RENEWABLE FORECASTING (WIND/SOLAR)
- 11.5.3 DER OPTIMIZATION
- 11.5.4 VIRTUAL POWER PLANTS (VPP)
- 11.5.5 GENERATION PERFORMANCE ANALYTICS
- 11.6 ENERGY TRADING & MARKET ANALYTICS
- 11.6.1 SUPPORTING ENERGY MARKET OPERATIONS AND TRADING DECISION-MAKING THROUGH MARKET ANALYTICS APPLICATIONS
- 11.6.2 PRICE FORECASTING
- 11.6.3 TRADING OPTIMIZATION
- 11.6.4 RISK ANALYTICS
- 11.6.5 PORTFOLIO OPTIMIZATION
- 11.7 SUSTAINABILITY & ESG ANALYTICS
- 11.7.1 SUPPORTING EMISSIONS MONITORING AND SUSTAINABILITY REPORTING THROUGH ESG ANALYTICS APPLICATIONS
- 11.7.2 CARBON ACCOUNTING
- 11.7.3 EMISSIONS TRACKING
- 11.7.4 ESG REPORTING
- 11.7.5 ENERGY EFFICIENCY ANALYTICS
- 11.8 OTHER APPLICATIONS
12 ENERGY AND UTILITIES ANALYTICS MARKET, BY ORGANIZATION TYPE
- 12.1 INTRODUCTION
- 12.1.1 DEPLOYMENT MODE: ENERGY AND UTILITIES ANALYTICS MARKET DRIVERS
- 12.2 LARGE INTEGRATED UTILITIES
- 12.2.1 MANAGING LARGE-SCALE UTILITY INFRASTRUCTURE AND OPERATIONAL NETWORKS THROUGH ENTERPRISE ANALYTICS APPLICATIONS
- 12.3 MID-SIZE/REGIONAL UTILITIES
- 12.3.1 SUPPORTING OPERATIONAL VISIBILITY AND INFRASTRUCTURE MANAGEMENT THROUGH UTILITY ANALYTICS APPLICATIONS
- 12.4 INDEPENDENT POWER PRODUCERS (IPPS)
- 12.4.1 SUPPORTING GENERATION PERFORMANCE AND RENEWABLE ENERGY OPERATIONS THROUGH PRODUCTION ANALYTICS APPLICATIONS
- 12.5 ENERGY RETAILERS/AGGREGATORS
- 12.5.1 MANAGING CUSTOMER OPERATIONS AND ENERGY DEMAND THROUGH COMMERCIAL AND MARKET ANALYTICS APPLICATIONS
- 12.6 COMMERCIAL & INDUSTRIAL (C&I) ENERGY USERS
- 12.6.1 MANAGING CUSTOMER OPERATIONS AND ENERGY DEMAND THROUGH COMMERCIAL AND MARKET ANALYTICS APPLICATIONS
13 ENERGY AND UTILITIES ANALYTICS MARKET, BY END USER
- 13.1 INTRODUCTION
- 13.1.1 END USER: ENERGY AND UTILITIES ANALYTICS MARKET DRIVERS
- 13.2 POWER UTILITIES
- 13.2.1 SUPPORTING GRID OPERATIONS AND ENERGY DELIVERY MANAGEMENT THROUGH UTILITY ANALYTICS APPLICATIONS
- 13.2.2 GENERATION
- 13.2.3 TRANSMISSION
- 13.2.4 DISTRIBUTION
- 13.2.5 RETAIL
- 13.3 OIL & GAS
- 13.3.1 SUPPORTING HYDROCARBON OPERATIONS AND INFRASTRUCTURE MONITORING THROUGH ENERGY ANALYTICS APPLICATIONS
- 13.3.2 UPSTREAM
- 13.3.3 MIDSTREAM
- 13.3.4 DOWNSTREAM
- 13.4 RENEWABLE ENERGY OPERATORS
- 13.4.1 SUPPORTING RENEWABLE ENERGY GENERATION AND DISTRIBUTED ENERGY MONITORING THROUGH ANALYTICS APPLICATIONS
- 13.5 WATER & WASTE UTILITIES
- 13.5.1 SUPPORTING WATER DISTRIBUTION AND WASTE INFRASTRUCTURE MONITORING THROUGH UTILITY ANALYTICS APPLICATIONS
14 ENERGY AND UTILITIES ANALYTICS MARKET, BY REGION
- 14.1 INTRODUCTION
- 14.2 NORTH AMERICA
- 14.2.1 NORTH AMERICA: ENERGY AND UTILITIES ANALYTICS MARKET DRIVERS
- 14.2.2 US
- 14.2.2.1 Highly mature utility analytics market driven by smart grid expansion and enterprise-wide operational intelligence adoption
- 14.2.3 CANADA
- 14.2.3.1 Advanced utility infrastructure transformation market supported by renewable integration and grid resilience modernization
- 14.3 EUROPE
- 14.3.1 EUROPE: ENERGY AND UTILITIES ANALYTICS MARKET DRIVERS
- 14.3.2 UK
- 14.3.2.1 Mature utility analytics market driven by offshore wind integration and distribution network digitization
- 14.3.3 GERMANY
- 14.3.3.1 Decentralized energy optimization market driven by renewable balancing and industrial grid intelligence requirements
- 14.3.4 FRANCE
- 14.3.4.1 Centralized utility intelligence market supported by nuclear grid stability and transmission reliability optimization
- 14.3.5 SPAIN
- 14.3.5.1 Renewable integration-driven utility analytics market supported by wind and solar grid balancing requirements
- 14.3.6 REST OF EUROPE
- 14.4 ASIA PACIFIC
- 14.4.1 ASIA PACIFIC: ENERGY AND UTILITIES ANALYTICS MARKET DRIVERS
- 14.4.2 CHINA
- 14.4.2.1 Large-scale utility intelligence market driven by ultra-high-voltage grid expansion and renewable integration optimization
- 14.4.3 INDIA
- 14.4.3.1 High-growth utility modernization market driven by smart metering expansion and transmission efficiency improvement
- 14.4.4 JAPAN
- 14.4.4.1 Reliability-focused utility analytics market supported by advanced grid operations and disaster resilience requirements
- 14.4.5 ASEAN
- 14.4.5.1 Emerging utility digitization market supported by urban electricity demand growth and grid modernization initiatives
- 14.4.6 REST OF ASIA PACIFIC
- 14.5 MIDDLE EAST & AFRICA
- 14.5.1 MIDDLE EAST & AFRICA: ENERGY AND UTILITIES ANALYTICS MARKET DRIVERS
- 14.5.2 SAUDI ARABIA
- 14.5.2.1 Large-scale utility modernization market driven by smart grid deployment and renewable energy expansion
- 14.5.3 UNITED ARAB EMIRATES (UAE)
- 14.5.3.1 Digitally advanced utility analytics market supported by smart infrastructure and centralized operational intelligence deployment
- 14.5.4 TURKEY
- 14.5.4.1 Utility infrastructure modernization market supported by transmission expansion and renewable integration requirements
- 14.5.5 SOUTH AFRICA
- 14.5.5.1 Grid reliability-focused utility analytics market supported by infrastructure monitoring and outage management requirements
- 14.5.6 REST OF MIDDLE EAST & AFRICA
- 14.6 LATIN AMERICA
- 14.6.1 LATIN AMERICA: ENERGY AND UTILITIES ANALYTICS MARKET DRIVERS
- 14.6.2 BRAZIL
- 14.6.2.1 Renewable-intensive utility analytics market supported by hydropower optimization and grid modernization initiatives
- 14.6.3 MEXICO
- 14.6.3.1 Utility infrastructure efficiency market supported by transmission modernization and operational visibility improvement
- 14.6.4 REST OF LATIN AMERICA
15 COMPETITIVE LANDSCAPE
- 15.1 OVERVIEW
- 15.2 KEY PLAYER STRATEGIES, 2021-2026
- 15.3 REVENUE ANALYSIS, 2021-2025
- 15.4 MARKET SHARE ANALYSIS, 2025
- 15.4.1 MARKET RANKING ANALYSIS, 2025
- 15.5 PRODUCT COMPARATIVE ANALYSIS
- 15.5.1 PRODUCT COMPARATIVE ANALYSIS OF ENERGY AND UTILITIES ANALYTICS PLATFORMS
- 15.6 COMPANY EVALUATION MATRIX: KEY PLAYERS
- 15.6.1 STARS
- 15.6.2 EMERGING LEADERS
- 15.6.3 PERVASIVE PLAYERS
- 15.6.4 PARTICIPANTS
- 15.6.5 COMPANY FOOTPRINT: KEY PLAYERS, 2025
- 15.6.5.1 Company footprint
- 15.6.5.2 Regional footprint
- 15.6.5.3 Offering footprint
- 15.6.5.4 Application footprint
- 15.6.5.5 Organization type footprint
- 15.6.5.6 End user footprint
- 15.7 COMPANY EVALUATION MATRIX: STARTUPS/SMES
- 15.7.1 PROGRESSIVE COMPANIES
- 15.7.2 RESPONSIVE COMPANIES
- 15.7.3 DYNAMIC COMPANIES
- 15.7.4 STARTING BLOCKS
- 15.7.5 COMPETITIVE BENCHMARKING: STARTUPS/SMES, 2025
- 15.7.5.1 Detailed list of key startups/SMEs
- 15.7.5.2 Competitive benchmarking of key startups/SMEs
- 15.8 COMPANY VALUATION AND FINANCIAL METRICS
- 15.9 COMPETITIVE SCENARIO
- 15.9.1 PRODUCT LAUNCHES AND ENHANCEMENTS
- 15.9.2 DEALS
16 COMPANY PROFILES
- 16.1 INTRODUCTION
- 16.2 KEY PLAYERS
- 16.2.1 SIEMENS
- 16.2.1.1 Business overview
- 16.2.1.2 Products/Solutions/Services offered
- 16.2.1.3 Recent developments
- 16.2.1.3.1 Product launches and enhancements
- 16.2.1.3.2 Deals
- 16.2.1.4 MnM view
- 16.2.1.4.1 Key strengths
- 16.2.1.4.2 Strategic choices
- 16.2.1.4.3 Weaknesses and competitive threats
- 16.2.2 ABB
- 16.2.2.1 Business overview
- 16.2.2.2 Products/Solutions/Services offered
- 16.2.2.3 Recent developments
- 16.2.2.3.1 Product launches and enhancements
- 16.2.2.3.2 Deals
- 16.2.2.4 MnM view
- 16.2.2.4.1 Key strengths
- 16.2.2.4.2 Strategic choices
- 16.2.2.4.3 Weaknesses and competitive threats
- 16.2.3 GE VERNOVA
- 16.2.3.1 Business overview
- 16.2.3.2 Products/Solutions/Services offered
- 16.2.3.3 Recent developments
- 16.2.3.3.1 Product launches and enhancements
- 16.2.3.3.2 Deals
- 16.2.3.4 MnM view
- 16.2.3.4.1 Key strengths
- 16.2.3.4.2 Strategic choices
- 16.2.3.4.3 Weaknesses and competitive threats
- 16.2.4 AUTODESK
- 16.2.4.1 Business overview
- 16.2.4.2 Products/Solutions/Services offered
- 16.2.4.3 Recent developments
- 16.2.4.3.1 Product launches and enhancements
- 16.2.4.3.2 Deals
- 16.2.4.4 MnM view
- 16.2.4.4.1 Key strengths
- 16.2.4.4.2 Strategic choices
- 16.2.4.4.3 Weaknesses and competitive threats
- 16.2.5 IBM
- 16.2.5.1 Business overview
- 16.2.5.2 Products/Solutions/Services offered
- 16.2.5.3 Recent developments
- 16.2.5.3.1 Product launches and enhancements
- 16.2.5.3.2 Deals
- 16.2.5.4 MnM view
- 16.2.5.4.1 Key strengths
- 16.2.5.4.2 Strategic choices
- 16.2.5.4.3 Weaknesses and competitive threats
- 16.2.6 SCHNEIDER ELECTRIC
- 16.2.6.1 Business overview
- 16.2.6.2 Products/Solutions/Services offered
- 16.2.6.3 Recent developments
- 16.2.6.3.1 Product launches and enhancements
- 16.2.6.3.2 Deals
- 16.2.7 GOOGLE
- 16.2.7.1 Business overview
- 16.2.7.2 Products/Solutions/Services offered
- 16.2.7.3 Recent developments
- 16.2.7.3.1 Product launches and enhancements
- 16.2.7.3.2 Deals
- 16.2.8 MICROSOFT
- 16.2.8.1 Business overview
- 16.2.8.2 Products/Solutions/Services offered
- 16.2.8.3 Recent developments
- 16.2.8.3.1 Product launches and enhancements
- 16.2.8.3.2 Deals
- 16.2.9 ORACLE
- 16.2.9.1 Business overview
- 16.2.9.2 Products/Solutions/Services offered
- 16.2.9.3 Recent developments
- 16.2.9.3.1 Product launches and enhancements
- 16.2.9.3.2 Deals
- 16.2.10 SAP
- 16.2.10.1 Business overview
- 16.2.10.2 Products/Solutions/Services offered
- 16.2.10.3 Recent developments
- 16.2.10.3.1 Product launches and enhancements
- 16.2.10.3.2 Deals
- 16.2.11 HITACHI ENERGY
- 16.2.12 BENTLEY SYSTEMS
- 16.2.13 SAS INSTITUTE
- 16.2.14 TERADATA
- 16.2.15 SNOWFLAKE
- 16.2.16 ITRON
- 16.2.17 INFOR
- 16.2.18 AVEVA
- 16.2.19 AWS
- 16.2.20 SALESFORCE
- 16.2.21 PALANTIR
- 16.2.22 DATABRICKS
- 16.2.23 FIS
- 16.2.24 ION GROUP
- 16.2.25 LANDIS+GYR
- 16.2.1 SIEMENS
- 16.3 STARTUP/SME PROFILES
- 16.3.1 ENEL X
- 16.3.2 NEXT KRAFTWERKE
- 16.3.3 TIBCO
- 16.3.4 KUBRA
- 16.3.5 ENERGY HUB
- 16.3.6 KX
- 16.3.7 AMPHORA
- 16.3.8 SPHERA
- 16.3.9 ENABLON
- 16.3.10 PERSEFONI
- 16.3.11 C3.AI
- 16.3.12 UPLIGHT
- 16.3.13 ENERGYCAP
- 16.3.14 VOLTUS
17 RESEARCH METHODOLOGY
- 17.1 RESEARCH DATA
- 17.1.1 SECONDARY DATA
- 17.1.2 PRIMARY DATA
- 17.1.2.1 Breakup of primary profiles
- 17.1.2.2 Key industry insights
- 17.2 DATA TRIANGULATION
- 17.3 MARKET SIZE ESTIMATION
- 17.3.1 TOP-DOWN APPROACH
- 17.3.2 BOTTOM-UP APPROACH
- 17.4 MARKET FORECAST
- 17.5 RESEARCH ASSUMPTIONS
- 17.6 LIMITATIONS
18 APPENDIX
- 18.1 DISCUSSION GUIDE
- 18.2 KNOWLEDGESTORE: MARKETSANDMARKETS' SUBSCRIPTION PORTAL
- 18.3 CUSTOMIZATION OPTIONS
- 18.4 RELATED REPORTS
- 18.5 AUTHOR DETAILS
