|
시장보고서
상품코드
2076877
광회로 스위치 시장 : 스위칭 기술별(MEMS, 액정, 실리콘 포토닉스), 포트 구성별(소규모 포트, 중규모 포트, 대규모 포트), 용도별(데이터센터 내, 통신 네트워크) - 세계 예측(-2032년)Optical Circuit Switches Market by Switching Technology (MEMS, Liquid Crystal, Silicon Photonics), Port Configuration (Low Port, Medium Port, High Port), and Application (Intra Data Centers, Telecommunications Networks) - Global Forecast to 2032 |
||||||

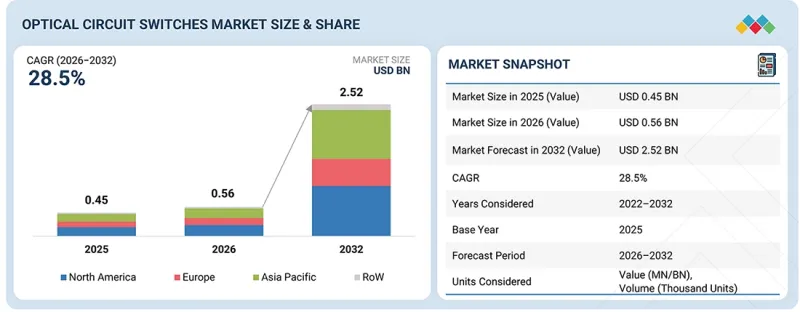
세계의 광회로 스위치 시장 규모는 2026년 5억 6,000만 달러에서 2032년에는 25억 2,000만 달러에 달할 것으로 예측되며, 예측 기간 동안 CAGR은 28.5%를 기록할 전망입니다.
이 시장의 주요 성장 요인은 클라우드 컴퓨팅 환경에서 확장 가능하고 유연한 네트워크 아키텍처에 대한 수요가 증가하고 있다는 점이며, 이러한 환경에서는 동적인 트래픽 패턴에 대응하기 위해 신속하고 효율적인 리소스 할당이 요구되고 있습니다.
| 조사 범위 | |
|---|---|
| 조사 대상 기간 | 2021-2032년 |
| 기준 연도 | 2025년 |
| 예측 기간 | 2026-2032년 |
| 단위 | 금액(달러) |
| 부문 | 스위칭 기술, 용도, 지역별 |
| 대상 지역 | 북미, 유럽, 아시아태평양, 기타 지역 |
기업들이 워크로드를 클라우드로 이전하는 움직임이 가속화되고, 클라우드 서비스 제공업체들이 멀티테넌트형 인프라를 확대해 나가는 가운데, 기존의 고정된 네트워크 토폴로지로는 변동하는 대역폭 요구 사항을 충분히 충족시키지 못하는 경우가 많습니다. 광 회로 스위치는 네트워크 연결의 온디맨드 재구성을 가능하게 하여, 데이터센터 운영자가 대규모 하드웨어 업그레이드 없이도 트래픽 흐름을 동적으로 최적화하고, 네트워크 활용도를 높이며, 진화하는 애플리케이션 요구 사항에 대응할 수 있도록 지원합니다. 클라우드 인프라의 규모와 복잡성이 지속적으로 확대됨에 따라, 이 기능은 점점 더 중요해지고 있으며, 광 회로 스위치의 도입 확대를 뒷받침하고 있습니다.
"2025년에는 중규모 포트(64X64-320X320) 부문이 가장 큰 시장 점유율을 차지했습니다."
포트 구성별로 보면 중규모 포트(64×64-320×320) 부문이 2025년에 가장 큰 점유율을 차지했습니다. 이는 대부분의 상용 도입 사례에서 확장성, 성능, 비용 간의 최적의 균형을 제공하기 때문입니다. 이러한 스위치는 하이퍼스케일 데이터센터, 클라우드 컴퓨팅 시설, HPC 환경을 지원하기에 충분한 포트 밀도를 갖추고 있으면서도, 초고밀도 포트 시스템에 수반되는 높은 복잡성과 비용을 피할 수 있습니다. 중규모 포트 구성은 증가하는 트래픽 수요에 효율적으로 대응하고, 네트워크 확장을 지원하며, 높은 운영 유연성을 제공할 수 있기 때문에 데이터센터 네트워크 전반에 걸쳐 널리 채택되고 있습니다. 다양한 네트워크 규모와 인프라 요구 사항에 폭넓게 적용할 수 있기 때문에 데이터센터 사업자에게 최적의 선택지가 되고 있습니다.
"통신 서비스 제공업체 부문은 예측 기간 동안 상당한 연평균 성장률(CAGR)을 기록하며 성장할 것으로 전망됩니다."
최종사용자별로 살펴보면, 데이터 트래픽, 클라우드 서비스, 대역폭을 대량으로 소비하는 애플리케이션의 급속한 성장에 힘입어 통신 서비스 제공업체 부문이 광회로 스위치의 주요 도입처로 자리 잡고 있습니다. 5G 네트워크, 하이퍼스케일 데이터센터, 광섬유 인프라의 도입 확대가 대용량 및 저지연 네트워크 아키텍처에 대한 수요를 이끌고 있습니다. 광 회로 스위치는 효율적인 트래픽 관리, 네트워크 확장성, 전력 소비 절감을 가능하게 하므로 통신 사업자들에게 매력적인 선택지가 되고 있습니다. 또한, 네트워크 현대화, 엣지 컴퓨팅, AI를 활용한 연결 서비스에 대한 투자 확대가 이러한 도입을 가속화하고 있습니다. 증가하는 동영상 스트리밍, 기업 간 연결, 데이터센터 간 통신을 지원해야 할 필요성으로 인해, 통신 서비스 제공업체의 광 회선 스위칭 솔루션에 대한 수요가 더욱 높아지고 있습니다.
"지역별로는 2026년부터 2032년까지 아시아태평양이 가장 높은 연평균 성장률(CAGR)을 기록할 것으로 전망됩니다."
아시아태평양에서는 하이퍼스케일 데이터센터 건설, 클라우드 컴퓨팅 도입, AI 인프라에 대한 투자가 급속히 확대되고 있어, 예측 기간 동안 가장 높은 연평균 성장률(CAGR)을 기록할 것으로 전망됩니다. 각국에서는 인터넷 이용 증가, 기업의 디지털 전환, 데이터 집약형 애플리케이션에 대한 수요 증가에 대응하기 위해 디지털 인프라 확충이 진행되고 있습니다. 또한, 전 세계 클라우드 서비스 제공업체와 지역 데이터센터 사업자의 입지가 강화됨에 따라, 대용량이면서 확장성이 뛰어난 광네트워크 솔루션에 대한 수요가 확대되고 있습니다. 조직들이 차세대 데이터센터 및 AI 컴퓨팅 시설에 대한 투자를 지속함에 따라, 광 회로 스위치에 대한 수요는 보다 성숙한 시장보다 빠른 속도로 성장할 것으로 예상됩니다.
본 보고서에서는 전 세계 광회로 스위치 시장을 조사하여, 시장 개요, 시장 성장에 영향을 미치는 다양한 요인에 대한 분석, 기술 및 특허 동향, 법규제 환경, 사례 연구, 시장 규모 추정 및 전망, 각종 분류·지역/주요 국가별 상세 분석, 경쟁 현황, 주요 기업 개요 등을 정리하고 있습니다.
자주 묻는 질문
목차
제1장 소개
제2장 주요 요약
제3장 주요 인사이트
제4장 시장 개요
제5장 업계 동향
제6장 기술의 진보, AI의 영향, 특허, 혁신
제7장 규제 상황
제8장 고객 상황과 구매 행동
제9장 광회로 스위치 시장 : 스위칭 기술별
제10장 광회로 스위치 시장 : 포트 구성별
제11장 광회로 스위치 시장 : 용도별
제12장 광회로 스위치 시장 : 최종사용자별
제13장 광회로 스위치 시장 : 지역별
제14장 경쟁 구도
제15장 기업 개요
제16장 조사 방법
제17장 부록
KSM 26.07.10The global optical circuit switches market size is projected to reach USD 2.52 billion by 2032 from USD 0.56 billion in 2026, registering a CAGR of 28.5% during the forecast period. The market is primarily driven by the growing demand for scalable and flexible network architectures in cloud computing environments, where dynamic traffic patterns require rapid and efficient resource allocation.
| Scope of the Report | |
|---|---|
| Years Considered for the Study | 2021-2032 |
| Base Year | 2025 |
| Forecast Period | 2026-2032 |
| Units Considered | Value (USD Billion) |
| Segments | By Switching Technology, Application and Region |
| Regions covered | North America, Europe, APAC, RoW |
As enterprises increasingly migrate workloads to the cloud and cloud service providers expand multi-tenant infrastructure, conventional fixed network topologies often struggle to accommodate fluctuating bandwidth requirements. Optical circuit switches enable on-demand reconfiguration of network connections, allowing data center operators to dynamically optimize traffic flows, improve network utilization, and support evolving application requirements without extensive hardware upgrades. This capability is becoming increasingly crucial as cloud infrastructure continues to scale in size and complexity, driving greater adoption of optical circuit switches.
"Medium port (>64X64 to 320X320) segment held the largest market share in 2025"
By port configuration, the medium port (64X64 to 320X320) segment accounted for the largest share of the optical circuit switches market in 2025 as it provides the optimal balance between scalability, performance, and cost for most commercial deployments. These switches offer sufficient port density to support hyperscale data centers, cloud computing facilities, and HPC environments while avoiding the higher complexity and costs associated with ultra-high-port systems. Medium-port configurations are widely adopted across data center networks as they can efficiently accommodate growing traffic demands, support network expansion, and deliver strong operational flexibility. Their broad applicability across a range of network sizes and infrastructure requirements has made them the preferred choice among data center operators.
"Telecommunications service providers segment to grow at a significant CAGR during the forecast period"
By end user, the telecommunications service providers segment is a key adopter of optical circuit switches due to the rapid growth of data traffic, cloud services, and bandwidth-intensive applications. Increasing deployment of 5G networks, hyperscale data centers, and fiber-optic infrastructure is driving the demand for high-capacity, low-latency network architectures. Optical circuit switches enable efficient traffic management, network scalability, and reduced power consumption, making them attractive for telecom operators. Additionally, increasing investments in network modernization, edge computing, and AI-driven connectivity services are accelerating adoption. The need to support growing video streaming, enterprise connectivity, and inter-data-center communications further strengthens the demand for optical circuit switching solutions among telecommunications service providers.
"By region, Asia Pacific to register the highest CAGR in the optical circuit switches market from 2026 to 2032"
Asia Pacific is projected to register the highest CAGR during the forecast period as the region is witnessing rapid growth in hyperscale data center construction, cloud computing adoption, and AI infrastructure investments. Countries are expanding their digital infrastructure to support increasing internet usage, enterprise digital transformation, and growing demand for data-intensive applications. In addition, the rising presence of global cloud service providers and regional data center operators is augmenting the need for high-capacity and scalable optical networking solutions. As organizations continue to invest in next-generation data centers and AI computing facilities, the demand for optical circuit switches is expected to grow at a faster pace than in more mature markets.
Extensive primary interviews were conducted with key industry experts offering optical circuit switches solutions to determine and verify the market size for various segments and subsegments gathered through secondary research. The breakdown of primary participants for the report is provided below:
The study contains insights from various industry experts, from component suppliers to Tier 1 companies and OEMs. The break-up of the primaries is as follows:
- By Company Type: Tier 1-40%, Tier 2-35%, and Tier 3-25%
- By Designation: C-level Executives-40%, Directors-45%, and Others-15%
- By Region: North America-26%, Europe-28%, Asia Pacific-41%, and RoW-5%
The report profiles key players in the optical circuit switches market with their respective market ranking analysis. Prominent players profiled in this report are Coherent Corp. (US), Lumentum Operations LLC (US), HUBER+SUHNER (Switzerland), DiCon (US), Accelink Technology Co. Ltd (China), Molex, LLC (US), Guilin HYGJ Communication Technology Co., Ltd. (China), Shenzhen HTFuture Co. Ltd. (China), iPronics (Spain), and Calient.Al, Inc. (US).
Research Coverage
This research report categorizes the optical circuit switches market based on switching technology, port configuration, application, end user, and region. The report describes the major drivers, restraints, challenges, and opportunities pertaining to the market and forecasts the same till 2032. Apart from this, the report also consists of leadership mapping and analysis of all the companies included in the optical circuit switches ecosystem.
Key Benefits of Buying the Report
The report will help the market leaders/new entrants in this market with information on the closest approximations of the numbers for the overall optical circuit switches market and subsegments. This report will help stakeholders understand the competitive landscape and gain more insights to position their businesses better and plan suitable go-to-market strategies. The report also helps stakeholders understand the pulse of the market and provides them with information on key market drivers, restraints, challenges, and opportunities.
The report provides insights into the following pointers:
- Analysis of key drivers (Energy efficiency advantages over traditional electronic switching technologies, Need for low-latency and high-bandwidth network infrastructure, Increasing 5G network deployment and 6G infrastructure advancement), restraints (High initial deployment and infrastructure costs, Limited availability of optical fiber infrastructure in developing countries), opportunities (Emergence of AI-native data centers and GPU clusters, Expansion of quantum computing research networks), and challenges (Shortage of professionals with expertise in optical networking technologies, Complexities in dynamic traffic allocation and real-time switching) influencing the optical circuit switches market dynamics
- Product Development/Innovation: Detailed insights into upcoming technologies, research & development activities, and new product & service launches in the market
- Market Development: Comprehensive information about lucrative markets-the report analyzes the optical circuit switches market across varied regions
- Market Diversification: Exhaustive information about new products & services, untapped geographies, recent developments, and investments in the market
- Competitive Assessment: In-depth assessment of market shares, growth strategies, and service offerings of leading players, such as Coherent Corp. (US), Lumentum Operations LLC (US), HUBER+SUHNER (Switzerland), DiCon (US), and Accelink Technology Co. Ltd (China) in the market
TABLE OF CONTENTS
1 INTRODUCTION
- 1.1 STUDY OBJECTIVES
- 1.2 MARKET DEFINITION
- 1.3 STUDY SCOPE
- 1.3.1 MARKETS COVERED AND REGIONAL SCOPE
- 1.3.2 INCLUSIONS AND EXCLUSIONS
- 1.3.3 YEARS CONSIDERED
- 1.4 CURRENCY CONSIDERED
- 1.5 UNIT CONSIDERED
- 1.6 LIMITATIONS
- 1.7 STAKEHOLDERS
2 EXECUTIVE SUMMARY
- 2.1 MARKET HIGHLIGHTS AND KEY INSIGHTS
- 2.2 KEY MARKET PARTICIPANTS: MAPPING OF STRATEGIC DEVELOPMENTS
- 2.3 DISRUPTIVE TRENDS IN OPTICAL CIRCUIT SWITCHES MARKET
- 2.4 HIGH-GROWTH SEGMENTS
- 2.5 REGIONAL SNAPSHOT: MARKET SIZE, GROWTH RATE, AND FORECAST
3 PREMIUM INSIGHTS
- 3.1 ATTRACTIVE OPPORTUNITIES FOR PLAYERS IN OPTICAL CIRCUIT SWITCHES MARKET
- 3.2 OPTICAL CIRCUIT SWITCHES MARKET, BY SWITCHING TECHNOLOGY
- 3.3 OPTICAL CIRCUIT SWITCHES MARKET, BY PORT CONFIGURATION
- 3.4 OPTICAL CIRCUIT SWITCHES MARKET, BY APPLICATION
- 3.5 OPTICAL CIRCUIT SWITCHES MARKET, BY END USER
- 3.6 OPTICAL CIRCUIT SWITCHES MARKET, BY COUNTRY
4 MARKET OVERVIEW
- 4.1 INTRODUCTION
- 4.2 MARKET DYNAMICS
- 4.2.1 DRIVERS
- 4.2.1.1 Energy efficiency advantages over traditional electronic switching technologies
- 4.2.1.2 Need for low-latency and high-bandwidth network infrastructure
- 4.2.1.3 Increasing 5G network deployment and 6G infrastructure advancement
- 4.2.2 RESTRAINTS
- 4.2.2.1 High initial deployment and infrastructure costs
- 4.2.2.2 Limited availability of optical fiber infrastructure in developing countries
- 4.2.3 OPPORTUNITIES
- 4.2.3.1 Emergence of AI-native data centers and GPU clusters
- 4.2.3.2 Expansion of quantum computing research networks
- 4.2.4 CHALLENGES
- 4.2.4.1 Shortage of professionals with expertise in optical networking technologies
- 4.2.4.2 Complexities in dynamic traffic allocation and real-time switching
- 4.2.1 DRIVERS
- 4.3 INTERCONNECTED MARKETS AND CROSS-SECTOR OPPORTUNITIES
- 4.4 STRATEGIC MOVES BY TIER 1/2/3 PLAYERS
5 INDUSTRY TRENDS
- 5.1 INTRODUCTION
- 5.2 PORTER'S FIVE FORCES ANALYSIS
- 5.2.1 THREAT OF NEW ENTRANTS
- 5.2.2 THREAT OF SUBSTITUTES
- 5.2.3 BARGAINING POWER OF SUPPLIERS
- 5.2.4 BARGAINING POWER OF BUYERS
- 5.2.5 INTENSITY OF COMPETITIVE RIVALRY
- 5.3 MACROECONOMIC OUTLOOK
- 5.3.1 INTRODUCTION
- 5.3.2 GDP TRENDS AND FORECAST
- 5.3.3 TRENDS IN GLOBAL TELECOMMUNICATIONS INFRASTRUCTURE INDUSTRY
- 5.3.4 TRENDS IN GLOBAL OPTICAL NETWORKING INDUSTRY
- 5.4 SUPPLY CHAIN ANALYSIS
- 5.5 ECOSYSTEM ANALYSIS
- 5.6 PRICING ANALYSIS
- 5.6.1 PRICING RANGE OF OPTICAL CIRCUIT SWITCHES, BY KEY PLAYER, 2025
- 5.6.2 AVERAGE SELLING PRICE TREND OF OPTICAL CIRCUIT SWITCHES, BY SWITCHING TECHNOLOGY, 2022-2025
- 5.6.3 AVERAGE SELLING PRICE TREND OF MEMS, BY REGION, 2022-2025
- 5.7 TRADE ANALYSIS
- 5.7.1 IMPORT SCENARIO (HS CODE 851762)
- 5.7.2 EXPORT SCENARIO (HS CODE 851762)
- 5.8 KEY CONFERENCES AND EVENTS, 2026-2027
- 5.9 TRENDS/DISRUPTIONS IMPACTING CUSTOMER BUSINESS
- 5.10 INVESTMENT AND FUNDING SCENARIO, 2022-2026
- 5.11 CASE STUDY ANALYSIS
- 5.11.1 GOOGLE'S DEPLOYMENT OF PALOMAR OCS SYSTEM IN HYPERSCALE DATA CENTERS TO IMPROVE OPERATIONAL PERFORMANCE
- 5.11.2 HYPERSCALE AI DATA CENTERS ADOPTION OF LUMENTUM'S MEMS-BASED OCS PLATFORM TO SUPPORT ENERGY-EFFICIENT OPTICAL INTERCONNECTS
- 5.11.3 MOLEX'S DEPLOYMENT OF HIGH-RADIX OCS TO IMPROVE AI CLUSTER SCALABILITY AND NETWORK EFFICIENCY
- 5.12 IMPACT OF US TARIFFS - OPTICAL CIRCUIT SWITCHES MARKET
- 5.12.1 INTRODUCTION
- 5.12.2 KEY TARIFF RATES
- 5.12.3 PRICE IMPACT ANALYSIS
- 5.12.4 IMPACT OF COUNTRIES/REGIONS
- 5.12.4.1 US
- 5.12.4.2 Europe
- 5.12.4.3 Asia Pacific
- 5.12.5 IMPACT ON END USERS
6 TECHNOLOGICAL ADVANCEMENTS, AI-DRIVEN IMPACT, PATENTS, AND INNOVATIONS
- 6.1 KEY EMERGING TECHNOLOGIES
- 6.1.1 MEMS SWITCHING
- 6.1.2 SILICON PHOTONICS
- 6.2 COMPLEMENTARY TECHNOLOGIES
- 6.2.1 OPTICAL TRANSCEIVERS & PLUGGABLE MODULES
- 6.2.2 SOFTWARE-DEFINED NETWORKING
- 6.3 TECHNOLOGY ROADMAP
- 6.4 PATENT ANALYSIS
- 6.5 IMPACT OF AI/GEN AI ON OPTICAL CIRCUIT SWITCHES MARKET
- 6.5.1 TOP USE CASES AND MARKET POTENTIAL
- 6.5.2 BEST PRACTICES FOLLOWED BY MANUFACTURERS IN OPTICAL CIRCUIT SWITCHES MARKET
- 6.5.3 CASE STUDIES RELATED TO AI/GEN AI IMPLEMENTATION IN OPTICAL CIRCUIT SWITCHES MARKET
- 6.5.4 INTERCONNECTED ECOSYSTEM AND IMPACT ON MARKET PLAYERS
- 6.5.5 CLIENTS' READINESS TO ADOPT AI/GEN AI-INTEGRATED OPTICAL CIRCUIT SWITCHES
7 REGULATORY LANDSCAPE
- 7.1 REGIONAL REGULATIONS AND COMPLIANCE
- 7.1.1 REGULATORY BODIES, GOVERNMENT AGENCIES, AND OTHER ORGANIZATIONS
- 7.1.2 STANDARDS
8 CUSTOMER LANDSCAPE AND BUYER BEHAVIOR
- 8.1 DECISION-MAKING PROCESS
- 8.2 KEY STAKEHOLDERS INVOLVED IN BUYING PROCESS AND THEIR EVALUATION CRITERIA
- 8.2.1 KEY STAKEHOLDERS IN BUYING PROCESS
- 8.2.2 BUYING CRITERIA
- 8.3 ADOPTION BARRIERS AND INTERNAL CHALLENGES
- 8.4 UNMET NEEDS OF VARIOUS END USERS
9 OPTICAL CIRCUIT SWITCHES MARKET, BY SWITCHING TECHNOLOGY
- 9.1 INTRODUCTION
- 9.2 MEMS
- 9.2.1 DYNAMIC BANDWIDTH ALLOCATION AND EFFICIENT TRAFFIC MANAGEMENT ACROSS OPTICAL NETWORKS TO DRIVE MARKET
- 9.3 OTHER SWITCHING TECHNOLOGIES
10 OPTICAL CIRCUIT SWITCHES MARKET, BY PORT CONFIGURATION
- 10.1 INTRODUCTION
- 10.2 LOW PORT (<64X64)
- 10.2.1 USE OF COST-EFFECTIVE OPTICAL CONNECTIVITY SOLUTIONS IN SMALL-SCALE NETWORKING ENVIRONMENTS TO FUEL SEGMENTAL GROWTH
- 10.3 MEDIUM PORT (64X64 TO 320X320)
- 10.3.1 DEPLOYMENT OF CLOUD COMPUTING AND HYPERSCALE DATA CENTERS TO ACCELERATE SEGMENTAL GROWTH
- 10.4 HIGH PORT (>320X320)
- 10.4.1 INVESTMENT IN NEXT-GENERATION AI INFRASTRUCTURE AND LARGE-SCALE COMPUTING CLUSTERS TO BOOST SEGMENTAL GROWTH
11 OPTICAL CIRCUIT SWITCHES MARKET, BY APPLICATION
- 11.1 INTRODUCTION
- 11.2 DATA CENTER INTERCONNECTS
- 11.2.1 REQUIREMENT TO SUPPORT ULTRA-HIGH BANDWIDTH AND LOW-LATENCY COMMUNICATION TO AUGMENT SEGMENTAL GROWTH
- 11.3 INTRA DATA CENTERS
- 11.3.1 RISE IN AI TRAINING WORKLOADS AND CLOUD COMPUTING TRAFFIC WITHIN HYPERSCALE FACILITIES TO EXPEDITE SEGMENTAL GROWTH
- 11.4 TELECOMMUNICATIONS NETWORKS
- 11.4.1 INCREASE IN INTERNET USAGE, CLOUD SERVICES, AND MOBILE DATA TRAFFIC TO CONTRIBUTE TO SEGMENTAL GROWTH
- 11.5 OTHER APPLICATIONS
12 OPTICAL CIRCUIT SWITCHES MARKET, BY END USER
- 12.1 INTRODUCTION
- 12.2 CLOUD SERVICE PROVIDERS & HYPERSCALERS
- 12.2.1 HIGH EMPHASIS ON OPTIMIZING BANDWIDTH UTILIZATION AND REDUCING POWER CONSUMPTION TO FUEL SEGMENTAL GROWTH
- 12.3 TELECOMMUNICATIONS SERVICE PROVIDERS
- 12.3.1 RISING DEPLOYMENT OF 5G NETWORKS, CLOUD APPLICATIONS, AND BANDWIDTH-INTENSIVE DIGITAL SERVICES TO BOOST SEGMENTAL GROWTH
- 12.4 ENTERPRISES
- 12.4.1 STRONG FOCUS ON SUPPORTING DIGITAL TRANSFORMATION AND CLOUD-BASED OPERATIONS TO FOSTER SEGMENTAL GROWTH
- 12.5 GOVERNMENT, DEFENSE & RESEARCH ORGANIZATIONS
- 12.5.1 INCREASING INVESTMENT IN SUPERCOMPUTING FACILITIES AND SECURE COMMUNICATION NETWORKS TO AUGMENT SEGMENTAL GROWTH
13 OPTICAL CIRCUIT SWITCHES MARKET, BY REGION
- 13.1 INTRODUCTION
- 13.2 NORTH AMERICA
- 13.2.1 US
- 13.2.1.1 Rapid expansion of AI infrastructure and hyperscale data centers to bolster market growth
- 13.2.2 CANADA
- 13.2.2.1 Increasing investment in sustainable digital infrastructure and research computing facilities to foster market growth
- 13.2.3 MEXICO
- 13.2.3.1 Rising development of telecommunications infrastructure and data center facilities to augment market growth
- 13.2.1 US
- 13.3 EUROPE
- 13.3.1 GERMANY
- 13.3.1.1 Increasing adoption of Industry 4.0 and smart manufacturing technologies to boost market growth
- 13.3.2 UK
- 13.3.2.1 Rapid expansion of digital financial services and media broadcasting infrastructure to accelerate market growth
- 13.3.3 ITALY
- 13.3.3.1 Rising development of industrial design networks and smart logistics infrastructure to fuel market growth
- 13.3.4 FRANCE
- 13.3.4.1 Increasing investment in scientific computing and advanced laboratory networks to contribute to market growth
- 13.3.5 REST OF EUROPE
- 13.3.1 GERMANY
- 13.4 ASIA PACIFIC
- 13.4.1 CHINA
- 13.4.1.1 Rising expansion of semiconductor manufacturing and large-scale digital ecosystems to drive market
- 13.4.2 JAPAN
- 13.4.2.1 Rapid advances in robotics, precision electronics, and next-generation mobility systems to foster market growth
- 13.4.3 INDIA
- 13.4.3.1 Increasing digital public infrastructure and connectivity initiatives to contribute to market growth
- 13.4.4 SOUTH KOREA
- 13.4.4.1 Widespread deployment of high-speed internet infrastructure and advanced mobile communication systems to drive market
- 13.4.5 REST OF ASIA PACIFIC
- 13.4.1 CHINA
- 13.5 ROW
- 13.5.1 MIDDLE EAST & AFRICA
- 13.5.1.1 Rising development of smart cities and connectivity infrastructure to bolster market growth
- 13.5.1.2 GCC countries
- 13.5.1.3 Africa & Rest of Middle East
- 13.5.2 SOUTH AMERICA
- 13.5.2.1 Increasing network modernization initiatives and digital commerce platform adoption to drive market
- 13.5.1 MIDDLE EAST & AFRICA
14 COMPETITIVE LANDSCAPE
- 14.1 OVERVIEW
- 14.2 KEY PLAYER COMPETITIVE STRATEGIES/RIGHT TO WIN, 2022-2026
- 14.3 REVENUE ANALYSIS, 2021-2025
- 14.4 MARKET SHARE ANALYSIS, 2025
- 14.5 COMPANY VALUATION AND FINANCIAL METRICS
- 14.6 BRAND COMPARISON
- 14.6.1 COHERENT CORP. (US)
- 14.6.2 LUMENTUM OPERATIONS LLC (US)
- 14.6.3 DICON (US)
- 14.6.4 ACCELINK TECHNOLOGIES CO., LTD. (CHINA)
- 14.6.5 HUBER+SUHNER (SWITZERLAND)
- 14.7 COMPANY EVALUATION MATRIX: KEY PLAYERS, 2025
- 14.7.1 STARS
- 14.7.2 EMERGING LEADERS
- 14.7.3 PERVASIVE PLAYERS
- 14.7.4 PARTICIPANTS
- 14.7.5 COMPANY FOOTPRINT: KEY PLAYERS, 2025
- 14.7.5.1 Company footprint
- 14.7.5.2 Region footprint
- 14.7.5.3 Switching technology footprint
- 14.7.5.4 Port configuration footprint
- 14.7.5.5 Application footprint
- 14.7.5.6 End user footprint
- 14.8 COMPANY EVALUATION MATRIX: STARTUPS/SMES, 2025
- 14.8.1 PROGRESSIVE COMPANIES
- 14.8.2 RESPONSIVE COMPANIES
- 14.8.3 DYNAMIC COMPANIES
- 14.8.4 STARTING BLOCKS
- 14.8.5 COMPETITIVE BENCHMARKING: STARTUPS/SMES, 2025
- 14.8.5.1 Detailed list of key startups/SMEs
- 14.8.5.2 Competitive benchmarking of key startups/SMEs
- 14.9 COMPETITIVE SCENARIO
- 14.9.1 PRODUCT LAUNCHES
- 14.9.2 DEALS
- 14.9.3 EXPANSIONS
15 COMPANY PROFILES
- 15.1 KEY PLAYERS
- 15.1.1 COHERENT CORP.
- 15.1.1.1 Business overview
- 15.1.1.2 Products/Solutions/Services offered
- 15.1.1.3 Recent developments
- 15.1.1.3.1 Product launches
- 15.1.1.4 MnM view
- 15.1.1.4.1 Key strengths/Right to win
- 15.1.1.4.2 Strategic choices
- 15.1.1.4.3 Weaknesses/Competitive threats
- 15.1.2 LUMENTUM OPERATIONS LLC
- 15.1.2.1 Business overview
- 15.1.2.2 Products/Solutions/Services offered
- 15.1.2.3 Recent developments
- 15.1.2.3.1 Deals
- 15.1.2.4 MnM view
- 15.1.2.4.1 Key strengths/Right to win
- 15.1.2.4.2 Strategic choices
- 15.1.2.4.3 Weaknesses/Competitive threats
- 15.1.3 DICON
- 15.1.3.1 Business overview
- 15.1.3.2 Products/Solutions/Services offered
- 15.1.3.3 MnM view
- 15.1.3.3.1 Key strengths/Right to win
- 15.1.3.3.2 Strategic choices
- 15.1.3.3.3 Weaknesses/Competitive threats
- 15.1.4 ACCELINK TECHNOLOGY CO. LTD
- 15.1.4.1 Business overview
- 15.1.4.2 Products/Solutions/Services offered
- 15.1.4.3 Recent developments
- 15.1.4.3.1 Product launches
- 15.1.4.3.2 Deals
- 15.1.4.4 MnM view
- 15.1.4.4.1 Key strengths/Right to win
- 15.1.4.4.2 Strategic choices
- 15.1.4.4.3 Weaknesses/Competitive threats
- 15.1.5 HUBER+SUHNER
- 15.1.5.1 Business overview
- 15.1.5.2 Products/Solutions/Services offered
- 15.1.5.3 Recent developments
- 15.1.5.3.1 Expansions
- 15.1.5.4 MnM view
- 15.1.5.4.1 Key strengths/Right to win
- 15.1.5.4.2 Strategic choices
- 15.1.5.4.3 Weaknesses/Competitive threats
- 15.1.6 CALIENT.AI, INC.
- 15.1.6.1 Business overview
- 15.1.6.2 Products/Solutions/Services offered
- 15.1.6.3 Recent developments
- 15.1.6.3.1 Deals
- 15.1.7 MOLEX, LLC
- 15.1.7.1 Business overview
- 15.1.7.2 Products/Solutions/Services offered
- 15.1.7.3 Recent developments
- 15.1.7.3.1 Product launches
- 15.1.7.3.2 Deals
- 15.1.8 GUILIN HYGJ COMMUNICATION TECHNOLOGY CO., LTD.
- 15.1.8.1 Business overview
- 15.1.8.2 Products/Solutions/Services offered
- 15.1.9 SHENZHEN HTFUTURE CO. LTD.
- 15.1.9.1 Business overview
- 15.1.9.2 Products/Solutions/Services offered
- 15.1.10 IPRONICS
- 15.1.10.1 Business overview
- 15.1.10.2 Products/Solutions/Services offered
- 15.1.10.3 Recent developments
- 15.1.10.3.1 Product launches
- 15.1.10.3.2 Deals
- 15.1.1 COHERENT CORP.
- 15.2 OTHER PLAYERS
- 15.2.1 JCOPTIX
- 15.2.2 FS.COM INC.
- 15.2.3 HUAWEI TECHNOLOGIES CO., LTD.
- 15.2.4 BRIGHT-SI-TECH
- 15.2.5 TRIPLE-STONE TECHNOLOGY CO., LTD.
- 15.2.6 AGILTRON INC.
- 15.2.7 EXFO INC.
- 15.2.8 SALIENCE LABS
- 15.2.9 GEZHI PHOTONICS CO., LTD.
- 15.2.10 GUILIN GLSUN SCIENCE AND TECH GROUP CO.,LTD.
- 15.2.11 LIGHTMATTER
- 15.2.12 THORLABS, INC.
- 15.2.13 KEYSIGHT TECHNOLOGIES
- 15.2.14 ORBRAY CO., LTD.
- 15.2.15 FLYIN GROUP CO.,LTD.
16 RESEARCH METHODOLOGY
- 16.1 RESEARCH DATA
- 16.2 SECONDARY AND PRIMARY RESEARCH
- 16.2.1 SECONDARY DATA
- 16.2.1.1 Key data from secondary sources
- 16.2.1.2 List of key secondary sources
- 16.2.2 PRIMARY DATA
- 16.2.2.1 Key data from primary sources
- 16.2.2.2 List of primary interview participants
- 16.2.2.3 Breakdown of primary interviews
- 16.2.2.4 Key industry insights
- 16.2.1 SECONDARY DATA
- 16.3 MARKET SIZE ESTIMATION
- 16.3.1 BOTTOM-UP APPROACH
- 16.3.2 TOP-DOWN APPROACH
- 16.3.3 MARKET SIZE CALCULATION FOR BASE YEAR
- 16.4 MARKET FORECAST APPROACH
- 16.4.1 SUPPLY SIDE
- 16.4.2 DEMAND SIDE
- 16.5 DATA TRIANGULATION
- 16.6 FACTOR ANALYSIS
- 16.7 RESEARCH ASSUMPTIONS
- 16.8 RESEARCH LIMITATIONS
- 16.9 RISK ANALYSIS
17 APPENDIX
- 17.1 DISCUSSION GUIDE
- 17.2 KNOWLEDGESTORE: MARKETSANDMARKETS' SUBSCRIPTION PORTAL
- 17.3 CUSTOMIZATION OPTIONS
- 17.4 RELATED REPORTS
- 17.5 AUTHOR DETAILS