|
시장보고서
상품코드
2084066
디스플레이 시장 예측(-2032년) : 디스플레이 기술(LCD, OLED, 마이크로 LED, 양자점 디스플레이, 다이렉트 뷰 LED), 패널 사이즈(마이크로디스플레이, 중소형, 대형), 제품 유형별(자동차용 디스플레이, 웨어러블, 디지털 사이니지, 스마트폰)Display Market by Display Technology (LCD, OLED, Micro-LED, Quantum Dot Display, Direct-view LED), Panel Size (Microdisplays, Small & Medium, Large), Product Type (Automotive Displays, Wearables, Digital Signage, Smartphones) - Global Forecast to 2032 |
||||||

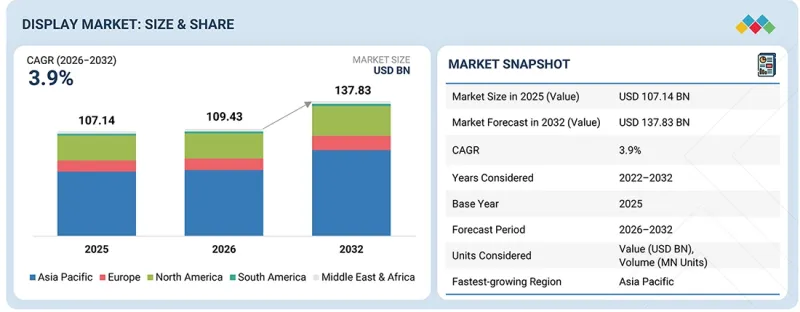
디스플레이 시장 규모는 2026년 1,094억 3,000만 달러에서 2032년에는 1,378억 3,000만 달러로 성장하며, CAGR은 3.9%에 달할 것으로 추정되고 있습니다.
디스플레이 시장의 성장은 스마트폰, TV, 노트북, 자동차용 인포테인먼트 시스템, 디지털 사이니지 등 다양한 제품에서 디스플레이 기술의 통합이 진행되고 있는 것이 원동력이 되고 있습니다. 뛰어난 화질, 대형 화면, 몰입감 있는 시청 경험에 대한 소비자의 높은 수요로 인해 OLED, Mini-LED, Micro-LED와 같은 차세대 디스플레이 기술의 도입이 계속해서 가속화되고 있습니다.
| 조사 범위 | |
|---|---|
| 조사 대상 기간 | 2021-2032년 |
| 기준연도 | 2025년 |
| 예측 기간 | 2026-2032년 |
| 단위 | 금액(달러) |
| 부문 | 기술, 패널 사이즈, 제품 유형, 지역별 |
| 대상 지역 | 북미, 유럽, 아시아태평양 , 기타 지역 |
또한 커넥티드 기기, 전기자동차, 스마트 소매 인프라, AR/VR 생태계의 급속한 확산으로 인해 첨단 디스플레이 솔루션에 대한 지속적인 수요가 발생하고 있습니다. 이러한 추세는 디스플레이 소재 및 제조 공정의 지속적인 혁신에 힘입어 더욱 가속화되고 있으며, 디스플레이 기술 전반에 걸쳐 성능, 유연성, 에너지 효율이 점차 향상되고 있습니다.
대형 패널은 2025년 디스플레이 시장에서 두 번째로 큰 점유율을 차지했습니다.
대형 디스플레이 패널은 TV, 게이밍 디스플레이, 디지털 사이니지, 비디오월, 상업용 디스플레이 분야에서의 보급이 확대됨에 따라 2025년 디스플레이 시장에서 두 번째로 큰 점유율을 차지했습니다. 대형 화면을 선호하는 소비자의 경향이 강해지고 있는 데다, 4K 및 8K 시청 경험에 대한 수요가 증가함에 따라 대형 디스플레이의 수요가 크게 늘어났습니다. 또한 디지털 광고 네트워크, 스마트 소매 환경, 기업 협업 공간, 엔터테인먼트 시설의 확대로 인해 대형 디스플레이 패널의 도입이 더욱 가속화되고 있습니다. LCD, OLED, Mini-LED 기술의 지속적인 발전 또한 화질과 가격 경쟁력을 높여, 이 부문의 견고한 시장 입지를 지원하고 있습니다.
스포츠·엔터테인먼트 분야는 예측 기간 중 두 번째로 높은 연평균 성장률(CAGR)을 기록할 것으로 예상됩니다.
스포츠·엔터테인먼트 분야는 대형 디지털 디스플레이, LED 비디오월, 경기장 스코어보드, 몰입형 팬 참여 기술, 라이브 이벤트 시각화 시스템에 대한 투자가 증가하고 있으며, 두 번째로 빠르게 성장하는 분야가 될 것으로 예상됩니다. 스포츠 경기장, 콘서트 아레나, 극장, 테마파크, 엔터테인먼트 센터에서는 역동적인 컨텐츠 제공, 실시간 정보, 상호작용형 디지털 경험을 통해 관객의 경험을 향상시키기 위해 고해상도 LED 및 마이크로 LED 디스플레이 도입이 점점 더 확대되고 있습니다. 라이브 스포츠 행사, e-sports 대회, 콘서트, 대규모 대중 행사 등에 대한 인기가 높아짐에 따라 뛰어난 밝기, 화질, 내구성을 갖춘 첨단 디스플레이 솔루션에 대한 수요가 더욱 증가하고 있습니다. 또한 증강현실(AR), 가상 제작, 몰입형 디지털 체험과 같은 기술의 통합을 통해 행사장 운영자와 이벤트 주최자들은 차세대 디스플레이 인프라에 대한 투자를 확대하고 있습니다. 이러한 요인들로 인해 예측 기간 중 디스플레이 도입이 가속화되어 스포츠 및 엔터테인먼트 분야의 강력한 성장을 지원할 것으로 예상됩니다.
예측 기간 중 아시아태평양이 가장 높은 연평균 성장률(CAGR)을 보일 것으로 전망됩니다.
아시아태평양은 CE 제품 생산의 급속한 확대, OLED 및 마이크로 LED 기술 도입 가속화, 스마트폰, TV, 노트북, 웨어러블 기기에 대한 수요 증가에 힘입어 디스플레이 시장에서 가장 빠르게 성장하는 지역 시장으로 부상할 전망입니다. 또한 이 지역에서는 첨단인 디스플레이 제조 인프라에 대한 지속적인 투자를 바탕으로 전기자동차 생산 및 자동차용 디스플레이 탑재가 현저히 확대되고 있습니다. 또한 반도체·디스플레이 산업에 대한 정부의 강력한 지원은 물론, 삼성디스플레이, LG디스플레이, BOE 테크놀러지, AUO, 인놀룩스 등 세계 유수의 디스플레이 제조사들이 이 지역에 밀집해 있는 점도 해당 지역의 성장을 지원하고 있습니다. 차세대 디스플레이에 대한 연구개발 투자 확대, 국내 수요 증가, 디지털 사이니지 및 스마트 리테일 솔루션의 보급, 성숙한 공급망 생태계 역시 시장 확대에 기여하고 있습니다. 또한 제조 비용 측면에서의 우위, AR/VR 기기의 보급 확대, 의료·산업·상업 분야에서의 첨단 디스플레이 채택 확대를 배경으로, 아시아태평양은 디스플레이 기술의 혁신, 제조, 상용화를 이끄는 세계적인 핵심 거점으로서의 위상을 확립해 나갈 것으로 전망됩니다.
이 보고서에서는 전 세계 디스플레이 시장을 조사하여, 시장 개요, 시장 성장에 영향을 미치는 다양한 요인에 대한 분석, 기술 및 특허 동향, 법규제 환경, 사례 연구, 시장 규모 추이 및 전망, 각종 분류·지역/주요 국가별 상세 분석, 경쟁 구도, 주요 기업 개요 등을 정리하여 전해드립니다.
자주 묻는 질문
목차
제1장 서론
제2장 개요
제3장 주요 인사이트
제4장 시장 개요
제5장 업계 동향
제6장 기술의 진보, AI의 영향, 특허, 혁신
제7장 규제 상황
제8장 고객 상황과 구매 행동
제9장 디스플레이 치수
제10장 디스플레이 해상도
제11장 디스플레이 패널 유형
제12장 디스플레이 인터랙티브 기능
제13장 디스플레이 폼팩터
제14장 디스플레이 시장 : 리프레시 레이트별
제15장 디스플레이 시장 : 디스플레이 기술별
제16장 디스플레이 시장 : 패널 사이즈별
제17장 디스플레이 시장 : 제품 유형별
제18장 디스플레이 시장 : 업계별
제19장 디스플레이 시장 : 지역별
제20장 경쟁 구도
제21장 기업 개요
제22장 조사 방법
제23장 부록
KSA 26.07.16The display market is estimated to grow from 109.43 billion in 2026 to USD 137.83 billion by 2032, at a CAGR of 3.9%. The display market growth is driven by the increasing integration of display technologies across diverse products, including smartphones, televisions, laptops, automotive infotainment systems, and digital signage. Robust consumer demand for superior image quality, larger screen formats, and immersive viewing experiences continues to accelerate the adoption of next-generation display technologies such as OLED, Mini-LED, and Micro-LED.
| Scope of the Report | |
|---|---|
| Years Considered for the Study | 2021-2032 |
| Base Year | 2025 |
| Forecast Period | 2026-2032 |
| Units Considered | Value (USD Billion) |
| Segments | By Technology, Panel Size, Product Type and Region |
| Regions covered | North America, Europe, APAC, RoW |
Furthermore, the rapid proliferation of connected devices, electric vehicles, smart retail infrastructure, and AR/VR ecosystems is generating sustained demand for advanced display solutions. This momentum is further reinforced by continuous innovation in display materials and manufacturing processes, which are progressively enhancing performance, flexibility, and energy efficiency across the broader display technology landscape.
Large panels held the second-largest share of the display market in 2025
Large display panels accounted for the second-largest share of the display market in 2025 due to their widespread adoption in televisions, gaming displays, digital signage, video walls, and commercial display applications. Growing consumer preference for larger screen sizes, coupled with increasing demand for 4K and 8K viewing experiences, has significantly boosted demand for large-format displays. Additionally, the expansion of digital advertising networks, smart retail environments, corporate collaboration spaces, and entertainment venues has further accelerated the deployment of large display panels. Continuous advancements in LCD, OLED, and Mini-LED technologies have also enhanced image quality and affordability, supporting the segment's strong market position.
The sports & entertainment vertical is expected to register the second-highest CAGR in the display market during the forecast period
Sports & entertainment is expected to be the second fastest-growing vertical due to increasing investments in large-format digital displays, LED video walls, stadium scoreboards, immersive fan engagement technologies, and live event visualization systems. Sports venues, concert arenas, theaters, theme parks, and entertainment centers are increasingly adopting high-resolution LED and Micro-LED displays to enhance audience experiences through dynamic content delivery, real-time information, and interactive digital experiences. The growing popularity of live sports events, esports tournaments, concerts, and large-scale public gatherings is further driving demand for advanced display solutions with superior brightness, image quality, and durability. Additionally, the integration of technologies such as augmented reality (AR), virtual production, and immersive digital experiences is encouraging venue operators and event organizers to invest in next-generation display infrastructure. These factors are expected to accelerate display adoption and support strong growth within the sports & entertainment segment during the forecast period.
Asia Pacific to exhibit the highest CAGR during the forecast period
Asia Pacific is poised to emerge as the fastest-growing regional market for displays, driven by the rapid expansion of consumer electronics manufacturing, accelerating adoption of OLED and Micro-LED technologies, and rising demand for smartphones, televisions, laptops, and wearable devices. The region is also experiencing substantial growth in electric vehicle production and automotive display integration, supported by sustained investment in advanced display fabrication infrastructure. Furthermore, robust government support for semiconductor and display manufacturing, combined with the strong presence of leading industry players, such as Samsung Display, LG Display, BOE Technology, AUO, and Innolux, continues to reinforce the region's growth momentum. Increasing investments in next-generation display R&D, expanding domestic consumption, rising penetration of digital signage and smart retail solutions, and the region's well-established supply chain ecosystem further contribute to market expansion. Additionally, favorable manufacturing economics, growing adoption of AR/VR devices, and the increasing deployment of advanced displays across healthcare, industrial, and commercial applications position Asia Pacific as the global hub for display technology innovation, production, and commercialization.
Extensive primary interviews were conducted with key experts in the display industry to determine and verify the market size for various segments and subsegments gathered through secondary research. The breakdown of primary participants for the report is provided below:
The study contains insights from various industry experts, from component suppliers to Tier 1 companies and OEMs. The break-up of the primaries is as follows:
- By Company Type: Tier 1 - 50%, Tier 2 - 30%, and Tier 3 - 20%
- By Designation: C-level Executives - 35%, Managers - 30%, and Others - 35%
- By Region: North America - 40%, Europe - 25%, Asia Pacific - 20%, and RoW - 15%
The report profiles the key companies in the display market with their respective ranking analysis. Prominent players profiled in this report are Samsung Display (South Korea), LG Display (South Korea), BOE Technology Group (China), AUO Corporation (Taiwan), and Innolux Corporation (Taiwan).
Apart from these, the report also includes other major players such as Sharp Corporation (Japan), Japan Display Inc. (Japan), Tianma Microelectronics (China), and Visionox (China), among others.
Research Coverage:
This research report categorizes the display market based on display technology, panel size, vertical, product type, and region. The report describes the major drivers, restraints, challenges, and opportunities pertaining to the display market and forecasts the same till 2032. Apart from these, the report also consists of leadership mapping and analysis of all the companies included in the automotive sensor ecosystem.
Key Benefits of Buying the Report
The report will help the market leaders/new entrants in this market with information on the closest approximations of the numbers for the overall display market and the subsegments. This report will help stakeholders understand the competitive landscape and gain more insights to position their businesses better and plan suitable go-to-market strategies. The report also helps stakeholders understand the pulse of the market and provides them with information on key market drivers, restraints, challenges, and opportunities.
The report provides insights into the following pointers:
- Analysis of key drivers (rising demand for high-resolution and premium displays across consumer electronics; increasing adoption of OLED, Mini-LED, and Micro-LED technologies), restraints (intense price competition and declining average selling prices (ASPs); high manufacturing costs of OLED and Micro-LED displays), opportunities (development of flexible, foldable, transparent, and rollable displays; growth of AR/VR and mixed-reality devices), and challenges (achieving cost-effective mass production of Micro-LED and other next-generation displays; supply chain disruptions and dependence on critical materials)
- Product Development/Innovation: Detailed insights on upcoming technologies, research & development activities, deals, and product launches in the display market
- Market Development: Comprehensive information about lucrative markets by analyzing the display market across varied regions
- Market Diversification: Exhaustive information about new products, untapped geographies, recent developments, and investments in the display market
- Competitive Assessment: In-depth assessment of market shares, growth strategies, and service offerings of leading market players such as Samsung Display (South Korea), LG Display (South Korea), BOE Technology Group (China), AUO Corporation (Taiwan), and Innolux Corporation (Taiwan).
TABLE OF CONTENTS
1 INTRODUCTION
- 1.1 STUDY OBJECTIVES
- 1.2 MARKET DEFINITION
- 1.3 MARKET SCOPE
- 1.3.1 MARKETS COVERED AND REGIONAL SEGMENTATION
- 1.3.2 INCLUSIONS & EXCLUSIONS
- 1.3.3 YEARS CONSIDERED
- 1.4 CURRENCY CONSIDERED
- 1.5 UNITS CONSIDERED
- 1.6 LIMITATIONS
- 1.7 STAKEHOLDERS
- 1.8 SUMMARY OF CHANGES
2 EXECUTIVE SUMMARY
- 2.1 MARKET HIGHLIGHTS AND KEY INSIGHTS
- 2.2 KEY MARKET PARTICIPANTS: MAPPING OF STRATEGIC DEVELOPMENTS
- 2.3 DISRUPTIVE TRENDS IN DISPLAY MARKET
- 2.4 HIGH-GROWTH SEGMENTS
- 2.5 REGIONAL SNAPSHOT: MARKET SIZE, GROWTH RATE, AND FORECAST
3 PREMIUM INSIGHTS
- 3.1 OPPORTUNITIES FOR PLAYERS IN DISPLAY MARKET
- 3.2 DISPLAY MARKET, BY DISPLAY TECHNOLOGY
- 3.3 DISPLAY MARKET, BY PRODUCT TYPE
- 3.4 DISPLAY MARKET, BY PANEL SIZE
- 3.5 DISPLAY MARKET IN ASIA PACIFIC, BY DISPLAY TECHNOLOGY AND COUNTRY
4 MARKET OVERVIEW
- 4.1 INTRODUCTION
- 4.2 DISPLAY MARKET DYNAMICS
- 4.2.1 DRIVERS
- 4.2.1.1 Growing integration of OLED displays across consumer electronics and automotive systems
- 4.2.1.2 Increasing demand for LED displays from consumer electronics, retail, commercial, and education sectors
- 4.2.1.3 Expanding use of advanced displays in automotive and healthcare industries
- 4.2.1.4 Elevating adoption of interactive displays across industries
- 4.2.2 RESTRAINTS
- 4.2.2.1 Growing trend of digital advertising and shopping
- 4.2.2.2 High costs associated with R&D, manufacturing, and limited production
- 4.2.2.3 Adoption of interactive projector alternatives and emergence of screenless display technologies
- 4.2.3 OPPORTUNITIES
- 4.2.3.1 Increasing demand for flexible and foldable displays
- 4.2.3.2 Rapid adoption of AMOLED displays driven by expansion of 5G-enabled devices
- 4.2.3.3 Commercialization of micro-LED and mini-LED technologies
- 4.2.3.4 Integration of advanced control and interactive features into display technology
- 4.2.4 CHALLENGES
- 4.2.4.1 Impact of technological obsolescence
- 4.2.4.2 Adverse impact of severe weather or harsh conditions on display functionality and lifespan
- 4.2.1 DRIVERS
- 4.3 INTERCONNECTED MARKETS AND CROSS-SECTOR OPPORTUNITIES
- 4.4 STRATEGIC MOVES BY TIER 1/2/3/ PLAYERS
5 INDUSTRY TRENDS
- 5.1 INTRODUCTION
- 5.2 PORTER'S FIVE FORCES ANALYSIS
- 5.2.1 THREAT OF NEW ENTRANTS
- 5.2.2 THREAT OF SUBSTITUTES
- 5.2.3 BARGAINING POWER OF SUPPLIERS
- 5.2.4 BARGAINING POWER OF BUYERS
- 5.2.5 INTENSITY OF COMPETITIVE RIVALRY
- 5.3 MACROECONOMIC OUTLOOK
- 5.3.1 INTRODUCTION
- 5.3.2 GDP TRENDS AND FORECAST
- 5.3.3 TRENDS IN GLOBAL DISPLAY INDUSTRY
- 5.4 VALUE CHAIN ANALYSIS
- 5.5 ECOSYSTEM ANALYSIS
- 5.6 PRICING ANALYSIS
- 5.6.1 AVERAGE SELLING PRICE TREND OF LARGE DISPLAY PANELS, BY KEY PLAYER, 2021-2025
- 5.6.2 PRICING TREND OF LCD DISPLAY PANELS, BY REGION, 2021-2025
- 5.7 TRADE ANALYSIS
- 5.7.1 IMPORT SCENARIO (HS CODE 8524)
- 5.8 KEY CONFERENCES AND EVENTS, 2026-2027
- 5.9 TRENDS/DISRUPTIONS IMPACTING CUSTOMER BUSINESS
- 5.10 INVESTMENT AND FUNDING SCENARIO, 2021-2024
- 5.11 CASE STUDY ANALYSIS
- 5.11.1 SAMSUNG DISPLAY ADVANCES ROLLABLE AND SLIDABLE OLED DISPLAYS FOR NEXT-GENERATION DEVICES
- 5.11.2 BOE DRIVES INTELLIGENT COCKPIT INNOVATION THROUGH ADVANCED AUTOMOTIVE DISPLAYS
- 5.11.3 SAMSUNG DISPLAY DEVELOPS OLED-ON-SILICON (OLEDOS) DISPLAYS FOR XR APPLICATIONS
- 5.12 IMPACT OF US TARIFF - DISPLAY MARKET
- 5.12.1 INTRODUCTION
- 5.12.2 KEY TARIFF RATES
- 5.12.3 PRICE IMPACT ANALYSIS
- 5.12.4 IMPACT ON COUNTRIES/REGIONS
- 5.12.4.1 US
- 5.12.4.2 Europe
- 5.12.4.3 Asia Pacific
- 5.12.5 IMPACT ON VERTIALS
6 TECHNOLOGICAL ADVANCEMENTS, AI-DRIVEN IMPACT, PATENTS, AND INNOVATIONS
- 6.1 KEY EMERGING TECHNOLOGIES
- 6.1.1 MINI-LED DISPLAYS
- 6.1.2 ELECTROWETTING DISPLAYS (EWD)
- 6.2 COMPLEMENTARY TECHNOLOGIES
- 6.2.1 IMMERSIVE DISPLAYS
- 6.2.2 FOLDABLE DISPLAYS
- 6.3 TECHNOLOGY ROADMAP
- 6.3.1 SHORT-TERM (2025-2027): DISPLAY TECHNOLOGY ADVANCEMENT AND PRODUCT OPTIMIZATION
- 6.3.2 MID-TERM (2028-2030): INTELLIGENT DISPLAYS AND ECOSYSTEM EXPANSION
- 6.4 PATENT ANALYSIS
- 6.5 IMPACT OF AI ON DISPLAY MARKET
- 6.5.1 TOP USE CASES AND MARKET POTENTIAL
- 6.5.2 BEST PRACTICES FOLLOWED BY PLAYERS IN DISPLAY MARKET
- 6.5.3 CASE STUDIES RELATED TO AI IMPLEMENTATION IN DISPLAY MARKET
- 6.5.4 INTERCONNECTED ECOSYSTEM AND IMPACT ON MARKET PLAYERS
- 6.5.5 CLIENTS' READINESS TO ADOPT GENERATIVE AI IN DISPLAY MARKET
7 REGULATORY LANDSCAPE
- 7.1 REGIONAL REGULATIONS AND COMPLIANCE
- 7.1.1 REGULATORY BODIES, GOVERNMENT AGENCIES, AND OTHER ORGANIZATIONS
- 7.1.2 STANDARDS
8 CUSTOMER LANDSCAPE AND BUYER BEHAVIOR
- 8.1 INTRODUCTION
- 8.2 DECISION-MAKING PROCESS
- 8.3 KEY STAKEHOLDERS INVOLVED IN BUYING PROCESS AND THEIR EVALUATION CRITERIA
- 8.3.1 KEY STAKEHOLDERS IN BUYING PROCESS
- 8.3.2 BUYING CRITERIA
- 8.4 ADOPTION BARRIERS AND INTERNAL CHALLENGES
- 8.5 UNMET NEEDS OF VARIOUS VERTICALS
9 DISPLAY DIMENSIONS
- 9.1 INTRODUCTION
- 9.2 2D DISPLAYS
- 9.3 3D DISPLAYS
10 DISPLAY RESOLUTIONS
- 10.1 INTRODUCTION
- 10.2 8K
- 10.3 4K
- 10.4 FULL HIGH DEFINITION (FHD)
- 10.5 HIGH DEFINITION (HD)
- 10.6 LOWER THAN HIGH DEFINITION
11 DISPLAY PANEL TYPES
- 11.1 INTRODUCTION
- 11.2 FIXED DISPLAY PANEL
- 11.2.1 TRANSPARENT DISPLAY PANEL
- 11.2.2 NON-TRANSPARENT DISPLAY PANEL
- 11.3 FLEXIBLE DISPLAY PANEL
- 11.3.1 FOLDABLE DISPLAY PANEL
- 11.3.2 OTHER DISPLAY PANEL TYPES (ROLLABLE, CURVED, STRETCHABLE, E-PAPER, AND TRANSPARENT FLEXIBLE DISPLAYS)
12 INTERACTIVE CAPABILITIES OF DISPLAYS
- 12.1 INTRODUCTION
- 12.2 PASSIVE DISPLAYS
- 12.3 INTERACTIVE DISPLAYS
- 12.4 SMART DISPLAYS
13 DISPLAY FORM FACTORS
- 13.1 INTRODUCTION
- 13.2 FLAT DISPLAY
- 13.3 CURVED DISPLAY
- 13.4 FLEXIBLE DISPLAY
- 13.5 TRANSPARENT DISPLAY
- 13.6 STRETCHABLE DISPLAY
14 DISPLAYS, BY REFRESH RATE
- 14.1 INTRODUCTION
- 14.2 STANDARD REFRESH RATE DISPLAYS (60 HZ TO 75 HZ)
- 14.3 HIGH REFRESH RATE DISPLAYS (90 HZ TO 240 HZ)
- 14.4 GAMING-GRADE DISPLAYS (240 HZ, 360 HZ, 480 HZ, AND BEYOND)
15 DISPLAY MARKET, BY DISPLAY TECHNOLOGY
- 15.1 INTRODUCTION
- 15.2 LCD
- 15.2.1 HIGH ADOPTION OF LCD TECHNOLOGY IN SMARTPHONES AND TELEVISION SETS
- 15.2.2 TWISTED NEMATIC (TN) DISPLAY
- 15.2.3 IN-PLANE SWITCHING (IPS)
- 15.2.4 VERTICAL ALIGNMENT (VA)
- 15.2.5 ADVANCED FRINGE FIELD SWITCHING (AFFS)
- 15.2.6 LED-BACKLIGHT LCD
- 15.2.7 THIN-FILM TRANSISTORS (TFTS)
- 15.3 OLED
- 15.3.1 ABILITY TO PROVIDE VIBRANT COLORS AND WIDER VIEWING ANGLES TO BOOST DEMAND
- 15.3.2 PASSIVE MATRIX ORGANIC LIGHT-EMITTING DIODE (PMOLED)
- 15.3.3 ACTIVE-MATRIX ORGANIC LIGHT-EMITTING DIODE (AMOLED)
- 15.4 MICRO-LED
- 15.4.1 ENHANCED CONTRAST, GREATER ENERGY EFFICIENCY, AND FASTER RESPONSE TIME TO ACCELERATE ADOPTION
- 15.5 DIRECT-VIEW LED
- 15.5.1 TRANSFORMATIVE SHIFT TOWARD VIDEO WALL TECHNOLOGY TO CREATE OPPORTUNITY
- 15.5.2 DIRECT-VIEW FINE-PIXEL LED
- 15.5.3 DIRECT-VIEW LARGE-PIXEL LED
- 15.6 QUANTUM DOT
- 15.6.1 EXTENDED LIFESPAN AND ENHANCED STABILITY TO FUEL SEGMENTAL GROWTH
- 15.6.2 QD-LCD
- 15.6.3 MINI-LED
- 15.6.4 QD-OLED
- 15.7 OTHER DISPLAY TECHNOLOGIES
- 15.7.1 E-PAPER DISPLAY (ELECTROPHORETIC DISPLAYS)
- 15.7.2 DIGITAL LIGHT PROCESSING (DLP)
- 15.7.3 PROJECTION CUBES
- 15.7.4 LIQUID CRYSTAL ON SILICON (LCOS)
16 DISPLAY MARKET, BY PANEL SIZE
- 16.1 INTRODUCTION
- 16.2 MICRODISPLAYS
- 16.2.1 SURGING DEMAND FOR WEARABLE DEVICES TO AUGMENT SEGMENTAL GROWTH
- 16.3 SMALL & MEDIUM-SIZED PANELS
- 16.3.1 RISING DEMAND FOR SMARTPHONES TO GENERATE OPPORTUNITIES FOR SMALL & MEDIUM-SIZED DISPLAY PANEL PROVIDERS
- 16.4 LARGE PANELS
- 16.4.1 WIDESPREAD USE ACROSS ENTERTAINMENT, ADVERTISING, EDUCATION, RETAIL INDUSTRIES TO SUPPORT SEGMENTAL GROWTH
17 DISPLAY MARKET, BY PRODUCT TYPE
- 17.1 INTRODUCTION
- 17.2 SMARTPHONES
- 17.2.1 USE OF OLED AND AMOLED DISPLAYS IN HIGH-END PHONES TO FUEL MARKET GROWTH
- 17.3 TELEVISION SETS
- 17.3.1 GROWING DEMAND FOR HIGH-QUALITY VISUAL CONTENT TO AUGMENT MARKET
- 17.4 MONITORS & LAPTOPS
- 17.4.1 ELEVATING DEMAND FOR HOME AUTOMATION, ENTERTAINMENT, AND SECURITY SYSTEMS TO STIMULATE MARKET EXPANSION
- 17.5 DIGITAL SIGNAGE & LARGE FORMAT DISPLAYS
- 17.5.1 SURGING ADOPTION OF LARGE-SIZED DISPLAYS IN PUBLIC SPACES, HOTELS, AND MUSEUMS TO PROMOTE MARKET GROWTH
- 17.6 AUTOMOTIVE DISPLAYS
- 17.6.1 INCREASING FOCUS OF AUTOMAKERS ON ENHANCING IN-VEHICLE INTERACTION TO ENSURE SAFETY TO PROPEL MARKET
- 17.7 TABLETS
- 17.7.1 INCREASING DEMAND FOR THINNER AND LIGHTER TABLETS TO STRENGTHEN MARKET GROWTH
- 17.8 WEARABLES
- 17.8.1 SMARTWATCHES
- 17.8.1.1 Increasing demand for superior visuals and longer battery life to contribute to market expansion
- 17.8.2 VR HMD
- 17.8.2.1 Booming gaming & entertainment industry to boost demand
- 17.8.3 AR HMD
- 17.8.3.1 Rising use in pre-hospital medical care and nursing care in clinical settings to contribute to market growth
- 17.8.1 SMARTWATCHES
- 17.9 OTHER PRODUCT TYPES
18 DISPLAY MARKET, BY VERTICAL
- 18.1 INTRODUCTION
- 18.2 CONSUMER ELECTRONICS
- 18.2.1 ESCALATING DEMAND FOR HIGH-QUALITY DISPLAYS ACROSS CONSUMER DEVICES TO AUGMENT MARKET GROWTH
- 18.3 AUTOMOTIVE
- 18.3.1 EXPANDING ADOPTION OF OLED DISPLAYS IN AUTOMOTIVE APPLICATIONS TO UNLOCK MARKET OPPORTUNITIES
- 18.4 SPORTS & ENTERTAINMENT
- 18.4.1 RISING USE OF AR/VR HEAD-MOUNTED DISPLAYS IN SPORTS & ENTERTAINMENT TO DRIVE MARKET
- 18.5 TRANSPORTATION
- 18.5.1 GROWING IMPLEMENTATION OF LARGE FORMAT DISPLAYS AT TRANSPORTATION HUBS TO DRIVE MARKET
- 18.6 RETAIL, HOSPITALITY, & BFSI
- 18.6.1 HEIGHTENED DEPLOYMENT OF DIGITAL SIGNAGE SOLUTIONS TO FOSTER MARKET GROWTH
- 18.7 INDUSTRIAL & ENTERPRISE
- 18.7.1 INTEGRATION OF DIGITAL DISPLAYS IN LOGISTICS OPERATIONS TO FACILITATE MARKET EXPANSION
- 18.8 EDUCATION
- 18.8.1 SHIFT TOWARD ONLINE EDUCATION TO SPUR DEMAND
- 18.9 HEALTHCARE
- 18.9.1 RISING ADOPTION OF DISPLAYS IN RADIATION THERAPY AND SURGICAL PROCEDURES TO SUPPORT MARKET GROWTH
- 18.10 AEROSPACE & DEFENSE
- 18.10.1 NEED TO PROJECT CRITICAL FLIGHT DATA DIRECTLY INTO PILOT'S FIELD OF VIEW TO DRIVE MARKET
- 18.11 OTHER VERTICALS
19 DISPLAY MARKET, BY REGION
- 19.1 INTRODUCTION
- 19.2 NORTH AMERICA
- 19.2.1 US
- 19.2.1.1 Robust presence of display module and TFT LCD manufacturers to support market growth
- 19.2.2 CANADA
- 19.2.2.1 Surging deployment of digital menu boards in restaurants to contribute to market growth
- 19.2.3 MEXICO
- 19.2.3.1 Expanding consumer electronics, automotive, and retail sectors to drive market
- 19.2.1 US
- 19.3 EUROPE
- 19.3.1 GERMANY
- 19.3.1.1 Rising adoption of display solutions in automotive and healthcare industries to contribute to market growth
- 19.3.2 FRANCE
- 19.3.2.1 Increasing use of interactive and digital displays in museums and tourist places to fuel market growth
- 19.3.3 UK
- 19.3.3.1 Elevating use of advanced display solutions in retail sector to improve customer experience to stimulate market growth
- 19.3.4 REST OF EUROPE
- 19.3.1 GERMANY
- 19.4 ASIA PACIFIC
- 19.4.1 CHINA
- 19.4.1.1 Government-led development of advanced display technologies to expedite market growth
- 19.4.2 SOUTH KOREA
- 19.4.2.1 Constant launch of advanced display products by giant manufacturers to contribute to market growth
- 19.4.3 JAPAN
- 19.4.3.1 Strategic investments and innovations by display panel manufacturers to facilitate market expansion
- 19.4.4 TAIWAN
- 19.4.4.1 Significant presence of display panel manufacturers and semiconductor foundries to support market growth
- 19.4.5 REST OF ASIA PACIFIC
- 19.4.1 CHINA
- 19.5 SOUTH AMERICA
- 19.5.1 BRAZIL
- 19.5.1.1 Prominent base of consumer and commercial display manufacturers to create growth opportunities
- 19.5.2 ARGENTINA
- 19.5.2.1 Growing demand for smart televisions, gaming displays, and commercial signage to support market expansion
- 19.5.3 REST OF SOUTH AMERICA
- 19.5.1 BRAZIL
- 19.6 MIDDLE EAST & AFRICA
- 19.6.1 GCC
- 19.6.1.1 Rising adoption of smartphones, tablets, and televisions with advanced display technologies to drive market
- 19.6.2 SOUTH AFRICA
- 19.6.2.1 Increasing popularity of e-sports and online gaming to elevate demand
- 19.6.3 REST OF MIDDLE EAST & AFRICA
- 19.6.1 GCC
20 COMPETITIVE LANDSCAPE
- 20.1 OVERVIEW
- 20.2 KEY PLAYER COMPETITIVE STRATEGIES/RIGHT TO WIN, 2022-2026
- 20.3 REVENUE ANALYSIS, 2021-2025
- 20.4 MARKET SHARE ANALYSIS, 2025
- 20.5 COMPANY VALUATION AND FINANCIAL METRICS
- 20.5.1 COMPANY VALUATION
- 20.5.2 FINANCIAL METRICS
- 20.6 BRAND/PRODUCT COMPARISON
- 20.6.1 SAMSUNG DISPLAY (SOUTH KOREA)
- 20.6.2 BOE TECHNOLOGY GROUP (CHINA)
- 20.6.3 LG DISPLAY CO., LTD. (SOUTH KOREA)
- 20.6.4 AUO CORPORATION (TAIWAN)
- 20.6.5 INNOLUX CORPORATION (TAIWAN)
- 20.7 COMPANY EVALUATION MATRIX: KEY PLAYERS, 2025
- 20.7.1 STARS
- 20.7.2 EMERGING LEADERS
- 20.7.3 PERVASIVE PLAYERS
- 20.7.4 PARTICIPANTS
- 20.7.5 COMPANY FOOTPRINT: KEY PLAYERS, 2025
- 20.7.5.1 Company footprint
- 20.7.5.2 Region footprint
- 20.7.5.3 Display technology footprint
- 20.7.5.4 Panel size footprint
- 20.7.5.5 Product type footprint
- 20.7.5.6 Vertical footprint
- 20.8 COMPANY EVALUATION MATRIX: STARTUPS/SMES, 2025
- 20.8.1 PROGRESSIVE COMPANIES
- 20.8.2 RESPONSIVE COMPANIES
- 20.8.3 DYNAMIC COMPANIES
- 20.8.4 STARTING BLOCKS
- 20.8.5 COMPETITIVE BENCHMARKING, STARTUPS/SMES, 2025
- 20.8.5.1 Detailed list of startups/SMEs
- 20.8.5.2 Competitive benchmarking of key startups/SMEs
- 20.9 COMPETITIVE SCENARIO
- 20.9.1 PRODUCT LAUNCHES
- 20.9.2 DEALS
21 COMPANY PROFILES
- 21.1 INTRODUCTION
- 21.2 KEY PLAYERS
- 21.2.1 SAMSUNG DISPLAY
- 21.2.1.1 Business overview
- 21.2.1.2 Products/Solutions/Services offered
- 21.2.1.3 Recent developments
- 21.2.1.3.1 Product launches
- 21.2.1.3.2 Deals
- 21.2.1.4 MnM view
- 21.2.1.4.1 Key strengths/Right to win
- 21.2.1.4.2 Strategic choices
- 21.2.1.4.3 Weaknesses/Competitive threats
- 21.2.2 LG DISPLAY CO., LTD.
- 21.2.2.1 Business overview
- 21.2.2.2 Products/Solutions/Services offered
- 21.2.2.3 Recent developments
- 21.2.2.3.1 Product launches
- 21.2.2.3.2 Deals
- 21.2.2.4 MnM view
- 21.2.2.4.1 Key strengths/Right to win
- 21.2.2.4.2 Strategic choices
- 21.2.2.4.3 Weaknesses/Competitive threats
- 21.2.3 SHARP CORPORATION
- 21.2.3.1 Business overview
- 21.2.3.2 Products/Solutions/Services offered
- 21.2.3.3 Recent developments
- 21.2.3.3.1 Deals
- 21.2.3.4 MnM view
- 21.2.3.4.1 Right to win
- 21.2.3.4.2 Strategic choices
- 21.2.3.4.3 Weaknesses and competitive threats
- 21.2.4 BOE TECHNOLOGY GROUP CO., LTD.
- 21.2.4.1 Business overview
- 21.2.4.2 Products/Solutions/Services offered
- 21.2.4.3 Recent developments
- 21.2.4.3.1 Deals
- 21.2.4.4 MnM view
- 21.2.4.4.1 Right to win
- 21.2.4.4.2 Strategic choices
- 21.2.4.4.3 Weaknesses/Competitive threats
- 21.2.5 INNOLUX CORPORATION
- 21.2.5.1 Business overview
- 21.2.5.2 Products/Solutions/Services offered
- 21.2.5.3 MnM view
- 21.2.5.3.1 Right to win
- 21.2.5.3.2 Strategic choices
- 21.2.5.3.3 Weaknesses and competitive threats
- 21.2.6 AUO CORPORATION
- 21.2.6.1 Business overview
- 21.2.6.2 Products/Solutions/Services offered
- 21.2.6.3 Recent developments
- 21.2.6.3.1 Deals
- 21.2.7 SONY GROUP CORPORATION
- 21.2.7.1 Business overview
- 21.2.7.2 Products/Solutions/Services offered
- 21.2.7.3 Recent developments
- 21.2.7.3.1 Deals
- 21.2.8 QISDA CORPORATION
- 21.2.8.1 Business overview
- 21.2.8.2 Products/Solutions/Services offered
- 21.2.9 TCL CHINA STAR OPTOELECTRONICS TECHNOLOGY CO., LTD.
- 21.2.9.1 Business overview
- 21.2.9.2 Products/Solutions/Services offered
- 21.2.9.3 Recent developments
- 21.2.9.3.1 Product launches
- 21.2.10 LEYARD
- 21.2.10.1 Business overview
- 21.2.10.2 Products/Solutions/Services offered
- 21.2.10.3 Recent developments
- 21.2.10.3.1 Deals
- 21.2.1 SAMSUNG DISPLAY
- 21.3 OTHER PLAYERS
- 21.3.1 E INK HOLDINGS INC.
- 21.3.2 TIANMA MICROELECTRONICS CO., LTD.
- 21.3.3 UNIVERSAL DISPLAY
- 21.3.4 TRULY INTERNATIONAL HOLDINGS LIMITED
- 21.3.5 PANASONIC HOLDINGS CORPORATION
- 21.3.6 HANNSTAR
- 21.3.7 EMAGIN
- 21.3.8 KOPIN CORPORATION
- 21.3.9 NORITAKE ITRON CORP.
- 21.3.10 JAPAN DISPLAY INC.
- 21.3.11 UNILUMIN
- 21.3.12 ELUX, INC.
- 21.3.13 VISIONOX COMPANY
- 21.3.14 WINSTAR DISPLAY CO., LTD.
- 21.3.15 WISECHIP SEMICONDUCTOR INC.
22 RESEARCH METHODOLOGY
- 22.1 RESEARCH DATA
- 22.1.1 SECONDARY DATA
- 22.1.1.1 Key data from secondary sources
- 22.1.1.2 Key secondary sources
- 22.1.2 PRIMARY DATA
- 22.1.2.1 Key data from primary sources
- 22.1.2.2 Interviews with experts
- 22.1.2.3 Breakdown of interviews with experts
- 22.1.2.4 Insights of industry experts
- 22.1.3 SECONDARY AND PRIMARY RESEARCH
- 22.1.1 SECONDARY DATA
- 22.2 MARKET SIZE ESTIMATION
- 22.2.1 GROWTH FORECAST ASSUMPTIONS
- 22.2.2 BOTTOM-UP APPROACH
- 22.2.2.1 Approach to derive market size using bottom-up analysis
- 22.2.3 TOP-DOWN APPROACH
- 22.2.3.1 Approach to derive market size using top-down analysis
- 22.3 MARKET SHARE ESTIMATION
- 22.4 DATA TRIANGULATION
- 22.5 RISK ASSESSMENT
- 22.6 RESEARCH ASSUMPTIONS AND LIMITATIONS
- 22.6.1 RESEARCH ASSUMPTIONS
- 22.6.2 RESEARCH LIMITATIONS
23 APPENDIX
- 23.1 INSIGHTS FROM INDUSTRY EXPERTS
- 23.2 DISCUSSION GUIDE
- 23.3 KNOWLEDGESTORE: MARKETSANDMARKETS' SUBSCRIPTION PORTAL
- 23.4 CUSTOMIZATION OPTIONS
- 23.5 RELATED REPORTS
- 23.6 AUTHOR DETAILS