
|
시장보고서
상품코드
2107275
옵저버빌리티 도구 및 플랫폼 시장 : 제공별, 텔레메트리 유형별, 전개 방식별, 조직 규모별, 업계별, 지역별 - 세계 예측(-2031년)Observability Tools & Platforms Market By Offering (Solutions and Services), Telemetry Type (Logs, Metrics, Traces, Events, and Profiles), Deployment Model, Organization Size, Vertical, and Region - Global Forecast to 2031 |
||||||

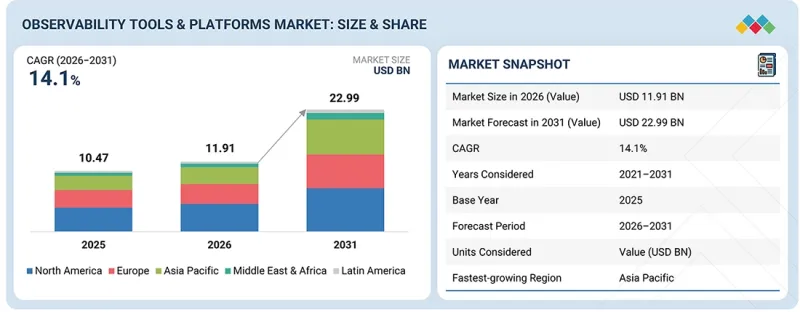
세계의 옵저버빌리티 도구 및 플랫폼 시장 규모는 2026년 119억 1,000만 달러에서 2031년까지 229억 9,000만 달러로, CAGR 14.1%로 확대될 것으로 예측됩니다.
이러한 성장은 클라우드 네이티브 애플리케이션, 쿠버네티스(Kubernetes), 마이크로서비스, 하이브리드 인프라의 확대, 그리고 텔레메트리 데이터의 증가에 힘입은 것입니다. 기업들은 애플리케이션 및 인프라 전반에 걸친 메트릭, 로그, 트레이스, 이벤트, 프로파일을 상호 연관시키기 위해 통합 플랫폼을 도입하고 있습니다.
| 조사 범위 | |
|---|---|
| 조사 대상 기간 | 2021-2031년 |
| 기준 연도 | 2025년 |
| 예측 기간 | 2026-2031년 |
| 산정 단위 | 금액(100만/10억 달러) |
| 부문 | 제공별, 텔레메트리 유형별, 전개 방식별, 조직 규모별, 업계별, 지역별 |
| 대상 지역 | 북미, 유럽, 아시아태평양, 중동 및 아프리카, 라틴아메리카 |
AI를 활용한 이상 탐지, 근본 원인 분석, 자동화된 사고 대응, 디지털 경험 모니터링 및 OpenTelemetry 기반 계측에 대한 수요가 증가하고 있습니다. DevOps, 사이트 신뢰성 엔지니어링(SRE), 보안 운영 및 클라우드 관리 워크플로우와의 통합을 통해 플랫폼의 가치가 높아지고 있습니다. 그러나 텔레메트리 비용, 데이터의 복잡성, 기술 인력 부족, 통합 관련 과제, 거버넌스 및 데이터 소재지에 대한 우려 등이 도입을 저해할 수 있습니다. 이러한 제약이 있음에도 불구하고, 애플리케이션 현대화 및 디지털 서비스에 대한 수요가 증가함에 따라 가시성(Observability)은 지속적인 운영 투자로 자리 잡아가고 있습니다.
"도입 형태별로는 SaaS/클라우드 기반 부문이 예측 기간 동안 가장 빠른 성장세를 보일 것으로 전망됩니다."
예측 기간 동안 옵저버빌리티 도구 및 플랫폼 시장에서 SaaS/클라우드 기반 도입이 가장 빠른 성장세를 기록할 것으로 예상됩니다. 기업들은 인프라 관리 부담을 줄이고, 도입을 가속화하며, 급변하는 디지털 환경에 대응할 수 있다는 점에서 클라우드 호스팅형 가시성을 점점 더 선호하고 있습니다. SaaS 플랫폼은 고객이 별도의 분석 인프라를 유지할 필요 없이 쿠버네티스(Kubernetes), 서버리스, 멀티 클라우드 및 SaaS 워크로드 전반에 걸쳐 텔레메트리 수집을 확장합니다. 플랫폼의 지속적인 업데이트를 통해 AI 기반 인시던트 조사, 이상 탐지, 워크플로우 자동화 및 새로운 통합 기능에 대한 접근도 가속화됩니다. OpenTelemetry는 다양한 환경에 걸쳐 표준화된 텔레메트리 수집을 가능하게함으로써 도입을 더욱 촉진하고 있습니다. 이 모델은 유연한 구독 기반 가격 책정, 분산형 사용자 액세스 및 간소화된 용량 확장을 원하는 조직에 특히 매력적입니다. 향후 성장은 애플리케이션 현대화, 원격 운영, 그리고 다양한 규모의 기업 및 전 세계 산업 분야에서 관리형 가시성 기능에 대한 수요 증가에 힘입을 것으로 예상됩니다.
"솔루션별로는 인프라 가시성이 가장 큰 시장 점유율을 차지할 것으로 예상됩니다."
예측 기간 동안 인프라 가시성은 옵저버빌리티 도구 및 플랫폼 시장에서 가장 큰 점유율을 차지할 것으로 예상됩니다. 기업들은 퍼블릭 클라우드, 프라이빗 데이터센터, 가상 머신, 컨테이너, 쿠버네티스 클러스터, 데이터베이스, 네트워크, 엣지 인프라에 걸쳐 점점 더 분산화된 환경을 운영하고 있습니다. 인프라 가시성 플랫폼은 이러한 환경 전반에 걸친 리소스 사용 현황, 가용성, 구성 변경, 종속성 및 성능 이상에 대해 지속적인 가시성을 제공합니다. 애플리케이션의 신뢰성은 기반이 되는 컴퓨팅, 스토리지, 네트워크, 오케스트레이션 계층의 건전성에 직접적으로 의존하기 때문에 이 부문은 계속해서 기반이 되는 역할을 수행하고 있습니다. 하이브리드 클라우드의 복잡성이 증가하고 동적 워크로드의 확장이 진행됨에 따라, 자동 탐지, 토폴로지 매핑, 용량 분석, AI를 활용한 근본 원인 파악에 대한 수요가 높아지고 있습니다. 로그, 트레이스, 디지털 경험 모니터링, 인시던트 워크플로우와의 통합을 통해 그 가치는 더욱 높아지고 있습니다. 클라우드 도입과 인프라 현대화가 지속됨에 따라, 통합된 인프라 가시성 기능에 대한 기업의 지출은 유지될 전망입니다.
"북미는 선진적인 클라우드 도입과 기업의 디지털 성숙도 덕분에 옵저버빌리티 도구 및 플랫폼 시장을 주도하고 있습니다."
북미는 성숙한 클라우드 도입, 광범위한 디지털 인프라, 그리고 견조한 엔터프라이즈 소프트웨어 지출에 힘입어 옵저버빌리티 도구 및 플랫폼 시장을 주도하고 있습니다. 미국 및 캐나다의 조직들은 애플리케이션, 인프라, 네트워크, 데이터베이스, 컨테이너, 디지털 경험 전반에 걸친 지속적인 가시성이 필요한 복잡한 하이브리드 및 멀티 클라우드 환경을 운영하고 있습니다. 이 지역은 플랫폼 혁신을 가속화하는 주요 가시성 벤더, 하이퍼스케일러, 클라우드 네이티브 기업, 그리고 대규모 기술 구매 기업의 존재로 인해 혜택을 받고 있습니다. DevOps, 사이트 신뢰성 엔지니어링(SRE), 쿠버네티스(Kubernetes), OpenTelemetry 및 AI 기반 운영은 금융 서비스, 기술, 통신, 의료, 소매, 제조 등 다양한 산업 분야에서 널리 채택되고 있습니다. 기업들은 인시던트 조사 자동화, 서비스 수준 모니터링, 텔레메트리를 통한 비용 관리, 보안 통합을 점점 더 우선시하고 있습니다. 지속적인 애플리케이션 현대화, 인공지능 도입, 디지털 복원력 강화 노력에 힘입어, 예측 기간 동안 북미는 가장 크고 가장 선진적인 지역 가시성 시장으로서의 입지를 공고히 하고 있습니다.
본 보고서에는 옵저버빌리티 도구 및 플랫폼 시장의 주요 업체에 대한 상세한 조사가 포함되어 있습니다. 주요 벤더에 대해서는 사업 개요, 제품 포트폴리오, 텔레메트리 기능, 도입 모델, 사업 전개 지역, 파트너십 및 전략적 전개에 기반하여 프로필을 작성했습니다. 주요 시장 참여 기업으로는 Datadog(미국), Dynatrace(미국), Splunk(미국), New Relic(미국), Elastic(미국), IBM(미국), Grafana Labs(미국), SolarWinds(미국), ServiceNow(미국), Microsoft(미국), Oracle(미국), LogicMonitor(미국), Coralogix(이스라엘), Chronosphere(미국), ScienceLogic(미국), Honeycomb(미국), Sentry(미국), Acceldata(미국), Kentik(미국), Arize AI(미국), Fiddler AI(미국), Arthur AI(미국), Anomalo(미국), SigNoz(미국), Better Stack(체코), Middleware(미국), Logz.io(이스라엘), Mezmo(미국), Observe(미국), Groundcover(이스라엘) 등이 있습니다.
조사 범위
본 조사 보고서에서는 관측가능성(Observability) 도구 및 플랫폼 시장을 제공 내용(솔루션 및 서비스), 솔루션 유형(애플리케이션 성능 모니터링, 인프라 관측가능성, 로그 관리 및 분석, 분산 트레이싱, AIOps 및 인시던트 인텔리전스, 기타), 텔레메트리 유형(로그, 메트릭 및 트레이스, 이벤트, 프로파일 등을 포함한 기타), 조직 규모(대기업 및 중소기업), 도입 모델(SaaS/클라우드 호스팅형, 자체 관리형, 하이브리드형), 업종(BFSI, IT 및 ITeS, 통신, 의료·생명과학, 소매·E-Commerce, 제조, 정부·공공 부문, 에너지·공익 사업, 운송·물류, 미디어·엔터테인먼트 및 기타 업종), 그리고 지역(북미, 유럽, 아시아태평양, 중동 및 아프리카 및 라틴아메리카)에 따라 분류되어 있습니다.
본 보고서에서는 시장 발전에 영향을 미치는 시장 촉진요인, 억제요인, 기회, 과제에 대해 상세히 분석하고 있습니다. 또한, 경쟁 동향, 기술 트렌드, OpenTelemetry 도입 현황, AI를 활용한 가시성, 클라우드 네이티브 아키텍처, 텔레메트리 관리, 가격 모델 및 전략적 전개에 대해서도 평가하고 있습니다. 주요 기업에 대해서는 사업 개요, 플랫폼 기능, 제품 라인업, 사업 전개 지역, 파트너십, 인수합병, 그리고 경쟁사와의 위치 관계를 바탕으로 분석하고 있습니다.
본 보고서를 구매해야 하는 이유
본 보고서는 시장을 선도하는 기업 및 신규 진입 기업에게 관측가능성 도구 및 플랫폼 시장 전체와 그 하위 부문에 관한 신뢰할 수 있는 추정치를 제공합니다. 이를 통해 이해관계자는 경쟁 동향을 파악하고, 벤더의 포지셔닝을 평가하며, 적절한 시장 진입, 제품 개발, 파트너십 및 시장 출시 전략을 수립할 수 있습니다. 또한, 본 조사를 통해 조직은 솔루션, 텔레메트리 유형, 도입 모델, 기업 규모, 산업 분야 및 지역에 걸친 시장의 성장 동향을 평가할 수 있습니다. 더 나아가, 가시성 생태계를 형성하는 주요 시장 촉진요인, 시장 제약요인, 기회, 과제, 기술 변화, 고객 요구 사항 및 경쟁 동향에 대한 체계적인 인사이트를 제공합니다.
본 보고서에서는 다음 사항에 대한 인사이트를 제공합니다:
- 주요 촉진요인, 제약요인, 기회, 과제에 대한 분석 : 촉진요인에는 클라우드 네이티브 애플리케이션의 채택 확대, 텔레메트리 양의 증가, 쿠버네티스 및 마이크로서비스의 활용 확대, AI를 활용한 인시던트 분석에 대한 수요 증가 등이 포함됩니다. 제약요인으로는 텔레메트리 저장 비용, 통합의 복잡성, 툴체인의 파편화, 숙련된 가시성 전문가 부족 등이 있습니다. 기회로는 OpenTelemetry 기반 플랫폼, AI 및 LLM(대규모 언어 모델)을 활용한 가시성, 자율 운영, 텔레메트리 최적화, 관리형 가시성 서비스 등이 있습니다. 과제로는 데이터 품질 유지, 기밀성이 높은 텔레메트리 관리, 이기종 환경에 걸친 신호 상관관계 분석, 측정 가능한 비즈니스 가치 입증 등이 있습니다.
- 제품 개발/혁신 : 관측가능성 도구 및 플랫폼 시장 전반에 걸친 신기술, 연구 개발 활동, 플랫폼 기능 강화, 인공지능(AI) 기능, OpenTelemetry 지원, 텔레메트리 파이프라인, 자동 복구, 그리고 신제품 및 서비스 출시에 관한 상세한 인사이트.
- 시장 동향 : 매력적인 시장에 대한 종합적인 정보. 여기에는 지역별 도입 동향, 클라우드 성숙도, 기업의 IT 지출, 디지털 전환 동향, 주요 산업 분야의 수요 등이 포함됩니다.
- 시장 다각화 : 관측가능성 도구 및 플랫폼 시장 전반에 걸친 신제품, 서비스, 도입 모델, 파트너십, 인수, 지리적 확장, 자금 조달 활동 및 투자에 대한 상세한 정보.
- 경쟁사 분석 : Datadog(미국), Dynatrace(미국), Splunk(미국), New Relic(미국), Elastic(미국), IBM(미국), Grafana Labs(미국), SolarWinds(미국), ServiceNow(미국), Microsoft(미국), Oracle(미국), LogicMonitor(미국), Coralogix(이스라엘), Chronosphere(미국), ScienceLogic(미국), Honeycomb(미국), Sentry(미국), Acceldata(미국), Kentik(미국), Arize AI(미국), Fiddler AI(미국), Arthur AI(미국), Anomalo(미국), SigNoz(미국), Better Stack(체코), Middleware(미국), Logz.io(이스라엘), Mezmo(미국), Observe(미국), 그리고 Groundcover(이스라엘)입니다.
자주 묻는 질문
목차
제1장 소개
제2장 주요 요약
제3장 주요 인사이트
제4장 시장 개요
제5장 업계 동향
제6장 고객 상황과 구매 행동
제7장 규제 상황
제8장 기술, 특허, 디지털 기술, AI의 도입에 의한 전략적 파괴
제9장 옵저버빌리티 도구 및 플랫폼 시장(제공별)
제10장 옵저버빌리티 도구 및 플랫폼 시장(텔레메트리 유형별)
제11장 옵저버빌리티 도구 및 플랫폼 시장(전개 방식별)
제12장 옵저버빌리티 도구 및 플랫폼 시장(조직 규모별)
제13장 옵저버빌리티 도구 및 플랫폼 시장(업계별)
제14장 옵저버빌리티 도구 및 플랫폼 시장(지역별)
제15장 경쟁 구도
제16장 기업 개요
제17장 조사 방법
제18장 부록
KSM 26.08.14The global observability tools & platforms market is projected to grow from USD 11.91 billion in 2026 to USD 22.99 billion by 2031, at a CAGR of 14.1%. Growth is supported by expanding cloud-native applications, Kubernetes, microservices, hybrid infrastructure, and increasing telemetry volumes. Enterprises are adopting unified platforms to correlate metrics, logs, traces, events, and profiles across applications and infrastructure.
| Scope of the Report | |
|---|---|
| Years Considered for the Study | 2021-2031 |
| Base Year | 2025 |
| Forecast Period | 2026-2031 |
| Units Considered | Value (USD Million/Billion) |
| Segments | Offering, Solution, Telemetry Type, Deployment Model, Organization Size, Vertical |
| Regions covered | North America, Europe, Asia Pacific, Middle East & Africa, Latin America |
Demand is rising for AI-assisted anomaly detection, root-cause analysis, automated incident response, digital experience monitoring, and OpenTelemetry-based instrumentation. Integration with DevOps, Site Reliability Engineering, security operations, and cloud management workflows is strengthening platform value. However, telemetry costs, data complexity, skills shortages, integration challenges, and concerns surrounding governance and data residency can constrain adoption. Despite limitations, application modernization and demand for digital services are reinforcing observability as a recurring operational investment.
"By deployment mode, the SaaS/cloud-based segment is expected to register the fastest growth during the forecast period"
SaaS/cloud-based deployment is expected to record the fastest growth in the observability tools & platforms market during the forecast period. Enterprises increasingly prefer cloud-hosted observability because it reduces infrastructure management, accelerates implementation, and supports rapidly changing digital environments. SaaS platforms scale telemetry ingestion across Kubernetes, serverless, multi-cloud, and software-as-a-service workloads without requiring customers to maintain separate analytics infrastructure. Continuous platform updates also provide faster access to AI-assisted incident investigation, anomaly detection, workflow automation, and new integrations. OpenTelemetry further strengthens adoption by enabling standardized telemetry collection across diverse environments. The model particularly appeals to organizations seeking flexible subscription pricing, distributed user access, and simplified capacity expansion. Future growth will be supported by application modernization, remote operations, and rising demand for managed observability capabilities across enterprises of varying sizes and global industries.
"By solution, infrastructure observability is expected to hold the largest market share."
Infrastructure observability is expected to hold the largest share of the observability tools & platforms market during the forecast period. Enterprises operate increasingly distributed estates spanning public clouds, private data centers, virtual machines, containers, Kubernetes clusters, databases, networks, and edge infrastructure. Infrastructure observability platforms provide continuous visibility into resource utilization, availability, configuration changes, dependencies, and performance anomalies across these environments. The segment remains foundational because application reliability depends directly on the health of underlying compute, storage, network, and orchestration layers. Growing hybrid-cloud complexity and dynamic workload scaling are increasing demand for automated discovery, topology mapping, capacity analysis, and AI-assisted root-cause identification. Integration with logs, traces, digital experience monitoring, and incident workflows further strengthens its value. Continued cloud adoption and infrastructure modernization will sustain enterprise spending on unified infrastructure observability capabilities.
"North America leads the observability tools & platforms market through advanced cloud adoption and enterprise digital maturity."
North America leads the observability tools & platforms market, supported by mature cloud adoption, extensive digital infrastructure, and strong enterprise software spending. Organizations across the United States and Canada operate complex hybrid and multi-cloud environments requiring continuous visibility across applications, infrastructure, networks, databases, containers, and digital experiences. The region benefits from the presence of leading observability vendors, hyperscalers, cloud-native companies, and large technology buyers that accelerate platform innovation. DevOps, Site Reliability Engineering, Kubernetes, OpenTelemetry, and AI-driven operations are widely adopted across financial services, technology, telecommunications, healthcare, retail, and manufacturing. Enterprises increasingly prioritize automated incident investigation, service-level monitoring, telemetry cost management, and security integration. Continued application modernization, artificial intelligence deployment, and digital resilience initiatives reinforce North America's position as the largest and most advanced regional observability market throughout the forecast period.
Breakdown of Primaries
In-depth interviews were conducted with Chief Executive Officers (CEOs), Chief Technology Officers (CTOs), product leaders, observability architects, system integrators, managed service providers, and executives from organizations operating across the observability tools & platforms market.
- By Company: Tier I - 35%, Tier II - 45%, and Tier III - 20%
- By Designation: Directors - 35%, Managers - 25%, and others - 40%
- By Region: North America - 45%, Europe - 20%, Asia Pacific - 25%, Middle East & Africa - 5%, and Latin America - 5%
The report includes a detailed study of leading participants in the observability tools & platforms market. It profiles major vendors based on their business overview, product portfolio, telemetry capabilities, deployment models, geographic presence, partnerships, and strategic developments. Key market players include Datadog (US), Dynatrace (US), Splunk (US), New Relic (US), Elastic (US), IBM (US), Grafana Labs (US), SolarWinds (US), ServiceNow (US), Microsoft (US), Oracle (US), LogicMonitor (US), Coralogix (Israel), Chronosphere (US), ScienceLogic (US), Honeycomb (US), Sentry (US), Acceldata (US), Kentik (US), Arize AI (US), Fiddler AI (US), Arthur AI (US), Anomalo (US), SigNoz (US), Better Stack (Czech Republic), Middleware (US), Logz.io (Israel), Mezmo (US), Observe (US), and Groundcover (Israel).
Research Coverage
This research report categorizes the observability tools & platforms market by offering (solutions and services), solution (application performance monitoring, infrastructure observability, log management & analytics, distributed tracing, AIOps & incident intelligence, and others), telemetry type (logs, metrics, and others, including traces, events, and profiles), organization size (large enterprises and small & medium-sized enterprises), deployment model (SaaS/cloud-hosted, self-managed, and hybrid), vertical (BFSI, IT & ITeS, telecommunications, healthcare & life sciences, retail & eCommerce, manufacturing, government & public sector, energy & utilities, transportation & logistics, media & entertainment, and other verticals), and region (North America, Europe, Asia Pacific, Middle East & Africa, and Latin America).
The report provides a detailed analysis of market drivers, restraints, opportunities, and challenges influencing market development. It also evaluates competitive dynamics, technology trends, OpenTelemetry adoption, AI-driven observability, cloud-native architectures, telemetry management, pricing models, and strategic developments. Leading companies are analyzed based on their business overview, platform capabilities, product offerings, geographic presence, partnerships, acquisitions, and competitive positioning.
Reason to buy this Report
The report provides market leaders and new entrants with reliable estimates for the overall observability tools & platforms market and its subsegments. It helps stakeholders understand competitive dynamics, evaluate vendor positioning, and identify suitable market-entry, product-development, partnership, and go-to-market strategies. The study also enables organizations to assess market momentum across solutions, telemetry types, deployment models, enterprise sizes, verticals, and regions. Additionally, it provides structured insights into key market drivers, restraints, opportunities, challenges, technology shifts, customer requirements, and competitive developments shaping the observability ecosystem.
The report provides insights on the following pointers:
- Analysis of key drivers, restraints, opportunities, and challenges: Drivers include growing cloud-native application adoption, expanding telemetry volumes, increasing use of Kubernetes and microservices, and rising demand for AI-assisted incident analysis. Restraints include telemetry storage costs, integration complexity, fragmented toolchains, and shortages of skilled observability professionals. Opportunities include OpenTelemetry-based platforms, AI and LLM observability, autonomous operations, telemetry optimization, and managed observability services. Challenges include maintaining data quality, governing sensitive telemetry, correlating signals across heterogeneous environments, and demonstrating measurable business value.
- Product Development/Innovation: Detailed insights into emerging technologies, research and development activities, platform enhancements, artificial intelligence capabilities, OpenTelemetry support, telemetry pipelines, automated remediation, and new product and service launches across the observability tools & platforms market.
- Market Development: Comprehensive information on attractive markets, including regional adoption patterns, cloud maturity, enterprise IT spending, digital transformation activity, and demand across major industry verticals.
- Market Diversification: Detailed information regarding new products, services, deployment models, partnerships, acquisitions, geographic expansions, funding activity, and investments across the observability tools & platforms market.
- Competitive Assessment: In-depth evaluation of market shares, platform capabilities, growth strategies, product portfolios, partnerships, and geographic presence of leading players, including Datadog (US), Dynatrace (US), Splunk (US), New Relic (US), Elastic (US), IBM (US), Grafana Labs (US), SolarWinds (US), ServiceNow (US), Microsoft (US), Oracle (US), LogicMonitor (US), Coralogix (Israel), Chronosphere (US), ScienceLogic (US), Honeycomb (US), Sentry (US), Acceldata (US), Kentik (US), Arize AI (US), Fiddler AI (US), Arthur AI (US), Anomalo (US), SigNoz (US), Better Stack (Czech Republic), Middleware (US), Logz.io (Israel), Mezmo (US), Observe (US), and Groundcover (Israel).
TABLE OF CONTENTS
1 INTRODUCTION
- 1.1 STUDY OBJECTIVES
- 1.2 MARKET DEFINITION
- 1.3 MARKET SCOPE
- 1.3.1 MARKET SEGMENTATION AND REGIONAL SCOPE
- 1.4 CURRENCY CONSIDERED
- 1.5 LIMITATIONS
- 1.6 STAKEHOLDERS
2 EXECUTIVE SUMMARY
- 2.1 MARKET HIGHLIGHTS AND KEY INSIGHTS
- 2.2 KEY MARKET PARTICIPANTS: MAPPING OF STRATEGIC DEVELOPMENTS
- 2.3 DISRUPTIVE TRENDS IN OBSERVABILITY TOOLS & PLATFORMS MARKET
- 2.4 HIGH-GROWTH SEGMENTS
- 2.5 REGIONAL SNAPSHOT: MARKET SIZE, GROWTH RATE, AND FORECAST
3 PREMIUM INSIGHTS
- 3.1 ATTRACTIVE OPPORTUNITIES FOR PLAYERS IN OBSERVABILITY TOOLS & PLATFORMS MARKET
- 3.2 OBSERVABILITY TOOLS & PLATFORMS MARKET, BY OFFERING
- 3.3 OBSERVABILITY TOOLS & PLATFORMS MARKET, BY TELEMETRY TYPE
- 3.4 OBSERVABILITY TOOLS & PLATFORMS MARKET, BY DEPLOYMENT MODE
- 3.5 OBSERVABILITY TOOLS & PLATFORMS MARKET, BY REGION
4 MARKET OVERVIEW
- 4.1 INTRODUCTION
- 4.2 MARKET DYNAMICS
- 4.2.1 DRIVERS
- 4.2.1.1 Cloud-Native Expansion Accelerates Demand for Full-Stack Observability
- 4.2.1.2 Rising Outage Costs Increase Enterprise Observability Spending
- 4.2.1.3 Platform Consolidation Expands Multi-Module Observability Revenue
- 4.2.1.4 Consumption-Based Subscriptions Increase Platform Expansion Revenue
- 4.2.2 RESTRAINTS
- 4.2.2.1 Rising Telemetry Costs Constrain Observability Budget Expansion
- 4.2.2.2 Unpredictable Usage Charges Limit Telemetry Adoption and Expansion
- 4.2.3 OPPORTUNITIES
- 4.2.3.1 AI and Agentic Workloads Create New Observability Revenue Pool
- 4.2.3.2 Telemetry Optimization Expands Cost-Governance Product Revenue
- 4.2.4 CHALLENGES
- 4.2.4.1 Explosive Log Data Growth Increasing Cost Pressures and Reshaping Enterprise Spending
- 4.2.4.2 Cross-Signal Inconsistency Limits Reliable Telemetry Correlation
- 4.2.1 DRIVERS
- 4.3 UNMET NEEDS AND WHITE SPACES
- 4.3.1 UNMET NEEDS IN OBSERVABILITY TOOLS AND PLATFORMS MARKET
- 4.3.2 WHITE SPACE OPPORTUNITIES
- 4.4 INTERCONNECTED MARKETS AND CROSS-SECTOR OPPORTUNITIES
- 4.4.1 CROSS-SECTOR OPPORTUNITIES
- 4.5 EMERGING BUSINESS MODELS AND ECOSYSTEM SHIFTS
- 4.5.1 EMERGING BUSINESS MODELS
- 4.5.1.1 Observability Tools & Platforms Business Models
- 4.5.2 ECOSYSTEM SHIFTS
- 4.5.1 EMERGING BUSINESS MODELS
- 4.6 STRATEGIC MOVES BY TIER-1/2/3 PLAYERS
- 4.6.1 KEY MOVES AND STRATEGIC FOCUS
5 INDUSTRY TRENDS
- 5.1 PORTER'S FIVE FORCES ANALYSIS
- 5.1.1 THREAT OF NEW ENTRANTS
- 5.1.2 THREAT OF SUBSTITUTES
- 5.1.3 BARGAINING POWER OF SUPPLIERS
- 5.1.4 BARGAINING POWER OF BUYERS
- 5.1.5 INTENSITY OF COMPETITIVE RIVALRY
- 5.2 MACROECONOMIC INDICATORS
- 5.2.1 INTRODUCTION
- 5.2.2 GDP TRENDS AND FORECASTS
- 5.2.3 TRENDS IN IT OPERATIONS MANAGEMENT (ITOM) INDUSTRY
- 5.2.4 TRENDS IN APPLICATION PERFORMANCE MONITORING INDUSTRY
- 5.3 VALUE CHAIN ANALYSIS
- 5.4 ECOSYSTEM ANALYSIS
- 5.5 KEY CONFERENCES AND EVENTS, 2026-2027
- 5.6 TRENDS/DISRUPTIONS IMPACTING CUSTOMER BUSINESS
- 5.7 CASE STUDY ANALYSIS
- 5.8 IMPACT OF 2025 US TARIFF - OBSERVABILITY TOOLS & PLATFORMS MARKET
- 5.8.1 INTRODUCTION
- 5.8.2 KEY TARIFF RATES
- 5.8.3 PRICE IMPACT ANALYSIS
- 5.8.4 IMPACT ON COUNTRY/REGION
- 5.8.4.1 US
- 5.8.4.2 Europe
- 5.8.4.3 Asia Pacific
- 5.8.5 IMPACT ON END-USE INDUSTRIES
- 5.8.5.1 BFSI
- 5.8.5.2 IT & ITES
- 5.8.5.3 Telecommunications
- 5.8.5.4 Healthcare & Life Sciences
- 5.8.5.5 Retail & E-Commerce
- 5.8.5.6 Manufacturing
- 5.8.5.7 Government & Public Sector
- 5.8.5.8 Energy & Utilities
- 5.8.5.9 Transportation & Logistics
- 5.8.5.10 Media & Entertainment
6 CUSTOMER LANDSCAPE AND BUYER BEHAVIOR
- 6.1 DECISION-MAKING PROCESS
- 6.2 BUYER STAKEHOLDERS AND BUYING EVALUATION CRITERIA
- 6.2.1 KEY STAKEHOLDERS IN BUYING PROCESS
- 6.2.2 BUYING CRITERIA
- 6.3 ADOPTION BARRIERS AND INTERNAL CHALLENGES
- 6.4 UNMET NEEDS ACROSS END-USE INDUSTRIES
- 6.5 MARKET PROFITABILITY
- 6.5.1 REVENUE POTENTIAL
- 6.5.2 COST DYNAMICS
- 6.5.3 MARGIN OPPORTUNITIES IN END-USE INDUSTRIES
7 REGULATORY LANDSCAPE
- 7.1 REGULATORY LANDSCAPE
- 7.1.1 REGULATORY BODIES, GOVERNMENT AGENCIES, AND OTHER ORGANIZATIONS
- 7.1.2 INDUSTRY STANDARDS, BY REGION
8 STRATEGIC DISRUPTION THROUGH TECHNOLOGY, PATENTS, DIGITAL, AND AI ADOPTION
- 8.1 TECHNOLOGY ANALYSIS
- 8.1.1 KEY EMERGING TECHNOLOGIES
- 8.1.1.1 Ai-powered observability and automated operations
- 8.1.1.2 Opentelemetry and vendor-neutral instrumentation
- 8.1.1.3 Ebpf-based observability and continuous profiling
- 8.1.2 COMPLEMENTARY TECHNOLOGIES
- 8.1.2.1 Cloud-Native, Kubernetes, And Serverless IOT
- 8.1.2.2 IT service management, AIOPS, and workflow automation
- 8.1.2.3 Cybersecurity, Privacy, and Telemetry Governance
- 8.1.3 ADJACENT TECHNOLOGIES
- 8.1.3.1 AI, LLM, AND agent observability
- 8.1.3.2 Finops And Cloud Cost Intelligence
- 8.1.3.3 Digital Experience and Business Observability
- 8.1.1 KEY EMERGING TECHNOLOGIES
- 8.2 TECHNOLOGY/PRODUCT ROADMAP
- 8.2.1 SHORT-TERM (2026-2028) | UNIFIED TELEMETRY, AI-ASSISTED OPERATIONS, AND CLOUD-NATIVE EXPANSION
- 8.2.2 MID-TERM (2028-2031) | AUTONOMOUS INVESTIGATION, BUSINESS CONTEXT, AND VERTICALIZED PLATFORMS
- 8.2.3 LONG-TERM (2031-2035) | SELF-OPTIMIZING, AI-NATIVE, AND BUSINESS-AWARE OPERATIONS
- 8.3 PATENT ANALYSIS
- 8.4 FUTURE APPLICATIONS
- 8.5 IMPACT OF AI/GENERATIVE AI ON OBSERVABILITY TOOLS & PLATFORMS MARKET
- 8.5.1 TOP USE CASES AND MARKET POTENTIAL
- 8.5.2 BEST PRACTICES IN OBSERVABILITY TOOLS AND PLATFORMS
- 8.5.3 CASE STUDY OF AI IMPLEMENTATION IN OBSERVABILITY TOOLS & PLATFORMS MARKET
- 8.5.4 INTERCONNECTED ADJACENT ECOSYSTEMS AND IMPACT ON MARKET PLAYERS
- 8.5.5 CLIENT READINESS TO ADOPT AI/GENERATIVE AI IN OBSERVABILITY TOOLS & PLATFORMS MARKET
- 8.5.6 DATADOG ENABLES APPFOLIO TO MONITOR AND OPTIMIZE ITS GENERATIVE AI APPLICATION
- 8.5.7 HONEYCOMB ENABLES INTERCOM TO OBSERVE AND OPERATE ITS FIN AI CUSTOMER-SERVICE AGENT
9 OBSERVABILITY TOOLS & PLATFORMS MARKET, BY OFFERING
- 9.1 INTRODUCTION
- 9.1.1 OFFERING: OBSERVABILITY TOOLS & PLATFORMS MARKET DRIVERS
- 9.2 SOLUTIONS
- 9.2.1 LOG MANAGEMENT & ANALYTICS
- 9.2.1.1 Rising Machine-Generated Data Volumes Strengthen Demand for Scalable, AI-Assisted Log Analytics
- 9.2.2 INFRASTRUCTURE OBSERVABILITY
- 9.2.2.1 Hybrid Infrastructure Complexity Accelerates Adoption of Unified, Topology-Aware Observability Platforms
- 9.2.2.2 Infrastructure Monitoring
- 9.2.2.3 Network Monitoring
- 9.2.2.4 Cloud Monitoring
- 9.2.2.5 Kubernetes & Container Monitoring
- 9.2.3 APPLICATION PERFORMANCE MONITORING (APM)
- 9.2.3.1 Cloud-Native Application Growth Elevates Demand for Proactive, Transaction-Level Performance Visibility
- 9.2.3.2 Application Monitoring
- 9.2.3.3 Database Monitoring
- 9.2.3.4 API Monitoring
- 9.2.4 DISTRIBUTED TRACING
- 9.2.4.1 Microservices Expansion Drives Need for End-to-End Transaction Tracing and Dependency Analysis
- 9.2.5 AIOPS & INCIDENT INTELLIGENCE
- 9.2.5.1 Rising Alert Volumes and Operational Complexity Accelerate Adoption of AI-Driven Incident Intelligence
- 9.2.6 OTHER SOLUTIONS
- 9.2.1 LOG MANAGEMENT & ANALYTICS
- 9.3 SERVICES
- 9.3.1 PROFESSIONAL SERVICES
- 9.3.1.1 Complex Implementations and Open-Standard Adoption Drive Demand for Specialized Observability Consulting
- 9.3.2 MANAGED SERVICES
- 9.3.2.1 Skills Shortages and Continuous Monitoring Requirements Accelerate Adoption of Managed Observability Services
- 9.3.1 PROFESSIONAL SERVICES
10 OBSERVABILITY TOOLS & PLATFORMS MARKET, BY TELEMETRY TYPE
- 10.1 INTRODUCTION
- 10.1.1 TELEMETRY TYPE: OBSERVABILITY TOOLS & PLATFORMS MARKET DRIVERS
- 10.2 LOGS
- 10.2.1 RISING TELEMETRY VOLUMES AND AI-ASSISTED ANALYTICS STRENGTHEN DEMAND FOR UNIFIED LOG OBSERVABILITY
- 10.3 METRICS
- 10.3.1 CLOUD-NATIVE SCALE AND PREDICTIVE ANALYTICS ACCELERATE DEMAND FOR HIGH-PERFORMANCE METRICS OBSERVABILITY
- 10.4 OTHER TELEMETRY TYPES
11 OBSERVABILITY TOOLS & PLATFORMS MARKET, BY DEPLOYMENT MODE
- 11.1 INTRODUCTION
- 11.1.1 DEPLOYMENT MODE: OBSERVABILITY TOOLS & PLATFORMS MARKET DRIVERS
- 11.2 SAAS/CLOUD-HOSTED
- 11.2.1 ELASTIC SCALABILITY AND REDUCED PLATFORM MANAGEMENT POSITION SAAS AS THE PREFERRED DEPLOYMENT MODE
- 11.3 SELF-MANAGED (ON-PREMISES)
- 11.3.1 DATA SOVEREIGNTY AND OPERATIONAL CONTROL SUSTAIN DEMAND FOR SELF-MANAGED OBSERVABILITY DEPLOYMENTS
- 11.4 HYBRID
- 11.4.1 HYBRID DEPLOYMENT BALANCES CLOUD-SCALE ANALYTICS WITH LOCAL TELEMETRY CONTROL AND GOVERNANCE
12 OBSERVABILITY TOOLS & PLATFORMS MARKET, BY ORGANIZATION SIZE
- 12.1 INTRODUCTION
- 12.1.1 ORGANIZATION SIZE: OBSERVABILITY TOOLS & PLATFORMS MARKET DRIVERS
- 12.2 LARGE ORGANIZATIONS
- 12.2.1 COMPLEX DIGITAL ESTATES AND HIGH TELEMETRY VOLUMES DRIVE ENTERPRISE-WIDE OBSERVABILITY CONSOLIDATION
- 12.3 SMES
- 12.3.1 AFFORDABLE SAAS PLATFORMS AND AUTOMATED OPERATIONS ACCELERATE OBSERVABILITY ADOPTION AMONG TITLE
13 OBSERVABILITY TOOLS & PLATFORMS MARKET, BY VERTICAL
- 13.1 INTRODUCTION
- 13.1.1 VERTICAL: OBSERVABILITY TOOLS & PLATFORMS MARKET DRIVERS
- 13.2 BFSI
- 13.2.1 TRANSACTION RELIABILITY AND REGULATORY RESILIENCE MAKE OBSERVABILITY CRITICAL ACROSS FINANCIAL OPERATIONS
- 13.3 IT & ITES
- 13.3.1 RAPID SOFTWARE DELIVERY AND SLA COMMITMENTS STRENGTHEN OBSERVABILITY ADOPTION ACROSS IT SERVICE PROVIDERS
- 13.4 TELECOMMUNICATIONS
- 13.4.1 5G, NETWORK CLOUDIFICATION, AND RISING TRAFFIC DRIVE REAL-TIME TELECOM SERVICE OBSERVABILITY
- 13.5 HEALTHCARE & LIFE SCIENCES
- 13.5.1 DIGITAL CARE EXPANSION AND CLINICAL-SYSTEM CRITICALITY INCREASE DEMAND FOR PRIVACY-AWARE OBSERVABILITY
- 13.6 RETAIL & E-COMMERCE
- 13.6.1 REVENUE-CRITICAL DIGITAL JOURNEYS DRIVE REAL-TIME OBSERVABILITY ACROSS COMMERCE AND FULFILLMENT ECOSYSTEMS
- 13.7 MANUFACTURING
- 13.7.1 CONNECTED FACTORIES AND INDUSTRIAL AI ACCELERATE IT-OT OBSERVABILITY ADOPTION
- 13.8 GOVERNMENT & PUBLIC SECTOR
- 13.8.1 DIGITAL PUBLIC SERVICES AND LEGACY MODERNIZATION STRENGTHEN DEMAND FOR SECURE, SOVEREIGN OBSERVABILITY
- 13.9 ENERGY & UTILITIES
- 13.9.1 GRID MODERNIZATION AND DISTRIBUTED ENERGY SYSTEMS DRIVE REAL-TIME OPERATIONAL OBSERVABILITY
- 13.10 TRANSPORTATION & LOGISTICS
- 13.10.1 CONNECTED FLEETS AND SUPPLY-CHAIN VOLATILITY INCREASE DEMAND FOR PREDICTIVE OPERATIONAL VISIBILITY
- 13.11 MEDIA & ENTERTAINMENT
- 13.11.1 STREAMING SCALE AND EXPERIENCE EXPECTATIONS DRIVE END-TO-END MEDIA SERVICE OBSERVABILITY
- 13.12 OTHER VERTICALS
14 OBSERVABILITY TOOLS & PLATFORMS MARKET, BY REGION
- 14.1 INTRODUCTION
- 14.2 NORTH AMERICA
- 14.2.1 US
- 14.2.1.1 Advanced cloud environments and AI workloads driving platform consolidation, telemetry optimization, and automated observability adoption
- 14.2.2 CANADA
- 14.2.2.1 Unified telemetry consolidation and AI-assisted incident management improving reliability across Canada's regulated digital enterprises
- 14.2.1 US
- 14.3 EUROPE
- 14.3.1 UK
- 14.3.1.1 Advanced digital infrastructure, regulated industries, and cloud modernization driving broader observability adoption across the UK
- 14.3.2 GERMANY
- 14.3.2.1 Industrial digitalization, multicloud complexity, and strict data-governance requirements advancing unified observability adoption across Germany
- 14.3.3 FRANCE
- 14.3.3.1 Large-scale platform consolidation reshaping service reliability across France's banking, transport, and aviation sectors
- 14.3.4 ITALY
- 14.3.4.1 Customer-journey optimization and critical transport operations accelerating observability investment across Italy
- 14.3.5 REST OF EUROPE
- 14.3.1 UK
- 14.4 ASIA PACIFIC
- 14.4.1 CHINA
- 14.4.1.1 Hyperscale applications and complex domestic cloud environments advancing demand for intelligent telemetry analysis and automation
- 14.4.2 JAPAN
- 14.4.2.1 Hybrid-cloud modernization and stringent service-reliability requirements supporting broader adoption of enterprise-wide observability platforms
- 14.4.3 INDIA
- 14.4.3.1 High-volume digital transactions and cloud-native platforms accelerating demand for real-time, cost-efficient observability capabilities
- 14.4.4 AUSTRALIA
- 14.4.4.1 Australia's regulated digital economy shifting observability from fragmented monitoring to unified service assurance
- 14.4.5 REST OF ASIA PACIFIC
- 14.4.1 CHINA
- 14.5 MIDDLE EAST & AFRICA
- 14.5.1 GCC COUNTRIES
- 14.5.1.1 Saudi Arabia
- 14.5.1.1.1 Financial-sector modernization and cloud expansion increasing demand for automated observability and faster incident resolution
- 14.5.1.2 United Arab Emirates (UAE)
- 14.5.1.2.1 Large-scale digital government and enterprise transformation accelerating adoption of AI-powered, end-to-end observability platforms
- 14.5.1.3 Other GCC countries
- 14.5.1.1 Saudi Arabia
- 14.5.2 SOUTH AFRICA
- 14.5.2.1 Digital payments, telecom modernization, and cloud-native services strengthening demand for unified, real-time observability
- 14.5.3 REST OF MIDDLE EAST & AFRICA
- 14.5.1 GCC COUNTRIES
- 14.6 LATIN AMERICA
- 14.6.1 BRAZIL
- 14.6.1.1 Expanding digital services and cloud-native operations strengthening enterprise demand for unified, AI-enabled observability capabilities
- 14.6.2 MEXICO
- 14.6.2.1 Rapid growth in e-commerce and distributed applications accelerating adoption of scalable, full-stack observability solutions
- 14.6.3 REST OF LATIN AMERICA
- 14.6.1 BRAZIL
15 COMPETITIVE LANDSCAPE
- 15.1 INTRODUCTION
- 15.2 KEY PLAYER STRATEGIES/RIGHT TO WIN, 2023-2026
- 15.3 REVENUE ANALYSIS, 2021-2025
- 15.4 MARKET SHARE ANALYSIS, 2026
- 15.5 PRODUCT COMPARISON, 2026
- 15.6 COMPANY EVALUATION MATRIX: KEY PLAYERS, 2026 (OBSERVABILITY TOOLS & PLATFORMS MARKET)
- 15.6.1 STARS
- 15.6.2 EMERGING LEADERS
- 15.6.3 PERVASIVE PLAYERS
- 15.6.4 PARTICIPANTS
- 15.6.5 COMPANY FOOTPRINT: KEY PLAYERS, 2026
- 15.6.5.1 Company footprint
- 15.6.5.2 Region footprint
- 15.6.5.3 Solution footprint
- 15.6.5.4 Service footprint
- 15.6.5.5 Vertical footprint
- 15.7 COMPANY EVALUATION MATRIX: STARTUPS/SMES, 2026
- 15.7.1 PROGRESSIVE COMPANIES
- 15.7.2 RESPONSIVE COMPANIES
- 15.7.3 DYNAMIC COMPANIES
- 15.7.4 STARTING BLOCKS
- 15.7.5 COMPETITIVE BENCHMARKING: STARTUPS/SMES, 2026
- 15.7.5.1 Detailed list of key startups/SMEs
- 15.7.5.2 Competitive benchmarking of key startups/SMEs
- 15.8 COMPANY VALUATION AND FINANCIAL METRICS, 2026
- 15.8.1 COMPANY VALUATION OF KEY VENDORS
- 15.8.2 FINANCIAL METRICS OF KEY VENDORS
- 15.9 COMPETITIVE SCENARIO
- 15.9.1 PRODUCT LAUNCHES
- 15.9.2 DEALS
16 COMPANY PROFILES
- 16.1 INTRODUCTION
- 16.2 KEY PLAYERS
- 16.2.1 DATADOG
- 16.2.1.1 Business overview
- 16.2.1.2 Products/Solutions/Services offered
- 16.2.1.3 Recent developments
- 16.2.1.3.1 Product launches and enhancements
- 16.2.1.3.2 Deals
- 16.2.1.4 MnM view
- 16.2.1.4.1 Right to win
- 16.2.1.4.2 Strategic choices
- 16.2.1.4.3 Weaknesses and competitive threats
- 16.2.2 DYNATRACE
- 16.2.2.1 Business overview
- 16.2.2.2 Products/Solutions/Services offered
- 16.2.2.3 Recent developments
- 16.2.2.3.1 Product launches and enhancements
- 16.2.2.3.2 Deals
- 16.2.2.4 MnM view
- 16.2.2.4.1 Right to win
- 16.2.2.4.2 Strategic choices
- 16.2.2.4.3 Weaknesses and competitive threats
- 16.2.3 SPLUNK
- 16.2.3.1 Business overview
- 16.2.3.2 Products/Solutions/Services offered
- 16.2.3.3 Recent developments
- 16.2.3.3.1 Product launches and enhancements
- 16.2.3.3.2 Deals
- 16.2.3.4 MnM view
- 16.2.3.4.1 Right to win
- 16.2.3.4.2 Strategic choices
- 16.2.3.4.3 Weaknesses and competitive threats
- 16.2.4 NEW RELIC
- 16.2.4.1 Business overview
- 16.2.4.2 Products/Solutions/Services offered
- 16.2.4.3 Recent developments
- 16.2.4.3.1 Product launches and enhancements
- 16.2.4.3.2 Deals
- 16.2.4.4 MnM view
- 16.2.4.4.1 Right to win
- 16.2.4.4.2 Strategic choices
- 16.2.4.4.3 Weaknesses and competitive threats
- 16.2.5 ELASTIC
- 16.2.5.1 Business overview
- 16.2.5.2 Products/Solutions/Services offered
- 16.2.5.3 Recent developments
- 16.2.5.3.1 Product launches and enhancements
- 16.2.5.3.2 Deals
- 16.2.5.4 MnM view
- 16.2.5.4.1 Right to win
- 16.2.5.4.2 Strategic choices
- 16.2.5.4.3 Weaknesses and competitive threats
- 16.2.6 AMAZON WEB SERVICES (AWS)
- 16.2.6.1 Business overview
- 16.2.6.2 Products/Solutions/Services offered
- 16.2.6.3 Recent developments
- 16.2.6.3.1 Product launches and enhancements
- 16.2.6.3.2 Deals
- 16.2.7 MICROSOFT
- 16.2.7.1 Business overview
- 16.2.7.2 Products/Solutions/Services offered
- 16.2.7.3 Recent developments
- 16.2.7.3.1 Product launches and enhancements
- 16.2.7.3.2 Deals
- 16.2.8 SOLARWINDS
- 16.2.8.1 Business overview
- 16.2.8.2 Products/Solutions/Services offered
- 16.2.8.3 Recent developments
- 16.2.8.3.1 Product launches and enhancements
- 16.2.8.3.2 Deals
- 16.2.9 GRAFANA LABS
- 16.2.9.1 Business overview
- 16.2.9.2 Products/Solutions/Services offered
- 16.2.9.3 Recent developments
- 16.2.9.3.1 Product launches and enhancements
- 16.2.9.3.2 Deals
- 16.2.10 IBM
- 16.2.10.1 Business overview
- 16.2.10.2 Products/Solutions/Services offered
- 16.2.10.3 Recent developments
- 16.2.10.3.1 Product launches and enhancements
- 16.2.10.3.2 Deals
- 16.2.1 DATADOG
- 16.3 OTHER PLAYERS
- 16.3.1 CHRONOSPHERE
- 16.3.2 SENTRY
- 16.3.3 ITRS
- 16.3.4 ARTHUR
- 16.3.5 ACCELDATA
- 16.3.6 ARIZE AI
- 16.3.7 NETSCOUT SYSTEMS
- 16.3.8 RIVERBED
- 16.3.9 ZOHO CORPORATION
- 16.3.10 APICA
- 16.3.11 HEWLETT PACKARD ENTERPRISE (HPE)
- 16.3.12 ALIBABA
- 16.3.13 ORACLE
- 16.3.14 BMC SOFTWARE
- 16.3.15 SCIENCELOGIC
- 16.3.16 HONEYCOMB
- 16.3.17 SERVICENOW
- 16.3.18 CORALOGIX
- 16.3.19 SUMO LOGIC
- 16.3.20 LANGFUSE
- 16.3.21 MAXIM AI
- 16.3.22 LAST9
- 16.3.23 EMBRACE
- 16.3.24 DASH0
- 16.3.25 LAST9
17 RESEARCH METHODOLOGY
- 17.1 RESEARCH DATA
- 17.1.1 SECONDARY DATA
- 17.1.1.1 Data & List of Key Secondary Sources
- 17.1.2 PRIMARY DATA
- 17.1.2.1 Key industry insights
- 17.1.3 MARKET SIZE ESTIMATION
- 17.1.1 SECONDARY DATA
- 17.2 DATA TRIANGULATION
- 17.2.1 FACTOR ANALYSIS
- 17.2.2 RESEARCH ASSUMPTIONS
18 APPENDIX
- 18.1 DISCUSSION GUIDE
- 18.2 KNOWLEDGESTORE: MARKETSANDMARKETS' SUBSCRIPTION PORTAL
- 18.3 CUSTOMIZATION OPTIONS
- 18.4 RELATED REPORTS
- 18.5 AUTHOR DETAILS


