

|
시장보고서
상품코드
2111120
멀티오믹스 시장 예측(-2031년) : 오퍼링별, 기술별, 방법별, 워크플로우별, 용도별, 최종사용자별, 지역별Multiomics Market by Offerings [Product (Instrument, Kits, Reagents), Service], Method (Epigenomics, Single Cell, Spatial), Technology [Sequencing, Proteomics (NGS, PCR, MS)], Workflow (Sample Prep), Application, Competition - Global Forecast to 2031 |
||||||

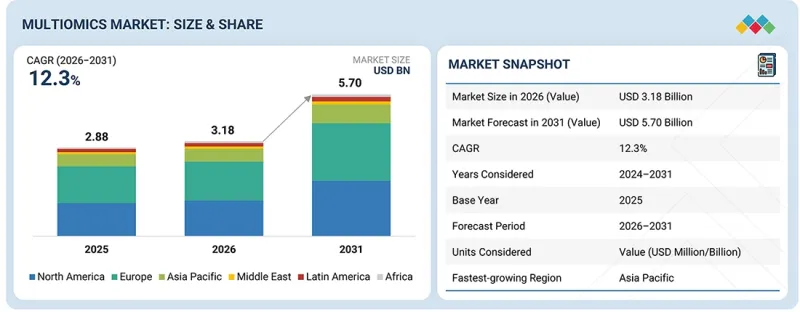
세계의 멀티오믹스 시장 규모는 2026년 31억 8,000만 달러에서 2031년까지 57억 달러에 달할 것으로 추정되고 있으며, 예측 기간 중 CAGR은 12.3%에 달할 전망입니다.
전 세계 멀티오믹스 시장은 게놈, 전사체학, 단백질체학, 대사체학, 에피게놈 프로파일링 기술을 통합한 기법의 채택 확대를 원동력으로 삼아 2031년까지 현저한 성장을 이룰 것으로 예상됩니다.
| 조사 범위 | |
|---|---|
| 조사 대상 기간 | 2026-2031년 |
| 기준연도 | 2025년 |
| 예측 기간 | 2026-2031년 |
| 산정 단위 | 금액(10억 달러) |
| 부문 | 오퍼링별, 기술별, 방법별, 워크플로우별, 용도별, 최종사용자별, 지역별 |
| 대상 지역 | 북미, 유럽, 아시아태평양, 라틴아메리카, 중동 및 아프리카 |
시장 확대는 종양학, 신약 개발, 정밀 의료, 중개 연구 분야에서 포괄적인 생물학적 특성 평가에 대한 수요 증가에 힘입고 있습니다. 단일 세포 분석, 공간 오믹스, 차세대 염기서열 분석, 질량분석 및 AI를 활용한 바이오인포매틱스 플랫폼의 발전이 이러한 도입을 더욱 가속화하고 있습니다. 그러나 높은 기술 비용, 복잡한 데이터 통합 요건, 그리고 전문적인 계산 과학 지식이 필요하므로 자원이 제한된 연구 환경에서는 도입이 제한될 수 있습니다.
"2025년 멀티오믹스 시장에서 제품 부문이 제공 형태별로 가장 큰 점유율을 차지했습니다."
제공 형태에 따라 멀티오믹스 시장은 제품과 서비스로 구분됩니다. 2025년에는 멀티오믹스 워크플로우 전반에 걸쳐 필요한 시퀀싱 플랫폼, 분석 장비, 어세이 키트, 시약, 소모품 및 소프트웨어 솔루션의 보급에 힘입어 제품이 시장에서 가장 큰 점유율을 차지했습니다. 이러한 제품들은 제약 회사, 생명공학 기업, 학술기관 및 연구소에서 시료 전처리, 시퀀싱, 특성 평가 및 데이터 분석 활동을 지원하고 있습니다. 서비스 부문은 복잡한 멀티오믹스 프로파일링, 바이오인포매틱스 분석 및 통합 오믹스 해석을 전문 서비스 제공업체에 아웃소싱하는 사례가 증가함에 따라 예측 기간 중 가장 높은 성장률을 보일 것으로 예상됩니다.
"2025년 멀티오믹스 시장에서 기법별로는 단일 세포 오믹스가 가장 큰 점유율을 차지했습니다."
기법별로 보면 멀티오믹스 시장은 에피게노믹스, 단일 세포 오믹스, 공간 오믹스, 롱 리드 및 롱 레인지 시퀀싱, 단백질체학, 기타 기법으로 분류됩니다. 2025년에는 개별 세포 수준에서 세포의 이질성 및 분자 간 상호작용을 분석할 수 있다는 점 때문에 단일 세포 오믹스가 최대 점유율을 차지했습니다. 종양학, 면역학, 발생생물학, 신약 개발 분야에서의 채택 확대가 그 주도적인 위치를 지속적으로 지원하고 있습니다. 공간 오믹스는 조직 구조를 유지하면서 분자 프로파일링을 동시에 수행하는 기술에 대한 수요 증가에 힘입어, 예측 기간 중 가장 빠른 성장을 기록할 것으로 예상됩니다.
"2026-2031년에 멀티오믹스 시장에서 아시아태평양이 가장 높은 연평균 성장률(CAGR)을 기록하고 있습니다."
멀티오믹스 시장은 북미, 유럽, 아시아태평양, 라틴아메리카, 중동 및 아프리카로 구분됩니다. 예측 기간 중 아시아태평양은 유전체학 및 생명과학 연구에 대한 투자 증가, 정밀 의학 구상의 확대, 그리고 차세대 염기서열 분석(NGS), 단일 세포 분석, 공간 생물학, 고해상도 질량분석 기술의 채택 확대에 힘입어 가장 높은 연평균 성장률(CAGR)을 기록할 것으로 예상됩니다. 또한 오믹스 연구에 대한 정부 자금의 증가, 생명공학 및 제약 분야의 연구개발(R&D)의 급속한 확대, 첨단 연구 인프라의 가용성 향상, 그리고 계약연구기관(CRO) 및 유전체 서비스 제공업체의 존재감 증대가 지역적 성장을 지원하고 있습니다. 또한 BGI Genomics 및 Novogene과 같은 지역을 대표하는 주요 기업의 강력한 입지에 더해, 전 세계 멀티오믹스 기술 제공업체들의 지속적인 투자로 인해 멀티오믹스 연구, 바이오마커 발견 및 정밀 의료 응용 분야에서의 해당 지역 역량이 강화되고 있으며, 아시아태평양은 예측 기간 중 가장 빠르게 성장하는 시장이 될 전망입니다.
이 보고서에서 다룬 기업 개요 리스트
- 10x Genomics, Inc.
- Thermo Fisher Scientific Inc.
- Illumina, Inc.
- Oxford Nanopore Technologies plc
- Bruker
- PacBio
- Danaher Corporation
- Vizgen Corporation
- Agilent Technologies, Inc
- Biognosys AG
- Merck KGaA
- QIAGEN N.V.
- Revvity, Inc.
- Waters Corporation
- Syngene International
- Bio-Rad Laboratories, Inc
- Takara Bio Inc
- Metabolon, Inc
- BGI Genomics
조사 범위
본 조사 보고서에서는 멀티오믹스 시장을 제공, 기법, 기술, 워크플로우, 용도, 최종사용자 및 지역별로 분류하고 있습니다. 조사 범위에는 멀티오믹스 시장의 성장에 영향을 미치는 주요 요인(시장 촉진요인, 과제, 기회, 제약 등)에 대한 상세 정보가 포함되어 있습니다. 주요 업계 플레이어에 대한 상세한 분석을 통해 각 기업의 사업 개요, 제품 포트폴리오, 제품 및 서비스의 승인 및 출시, 제휴, 파트너십, 사업 확장, 계약, 그리고 멀티오믹스 시장과 관련된 최근 동향 등 주요 전략에 대한 인사이트를 제공합니다. 이 보고서에서는 멀티오믹스 시장 생태계내 주요 기업 및 신생 스타트업 간의 경쟁 분석도 다루고 있습니다.
이 보고서 구매의 주요 이점
이 보고서는 멀티오믹스 시장 전체 및 그 하위 부문의 매출에 대해 가장 정확한 추정치를 제공함으로써, 시장을 선도하는 기업과 신규 진입 기업을 지원합니다. 또한 이해관계자가 경쟁 구도를 더 깊이 이해하고, 비즈니스를 보다 효과적으로 포지셔닝하며, 적절한 시장 진입 전략을 수립하기 위한 인사이트를 얻는 데에도 도움이 됩니다. 이 보고서를 통해 이해관계자는 시장 동향을 파악하고, 주요 시장 촉진요인, 억제요인, 기회 및 과제에 대한 정보를 얻을 수 있습니다.
이 보고서는 다음 사항에 대한 인사이트를 제공합니다. :
- 주요 촉진요인(정밀 의료 및 질환 계층화 분야에서 멀티오믹스의 채택 확대, 단일 세포 및 공간 멀티오믹스의 급속한 보급, 연구를 위한 고품질 통합 오믹스 데이터에 대한 접근성 향상, 그리고 크로스오믹스 데이터 해석을 위한 AI, 기계학습, 클라우드 바이오정보학의 발전)에 대한 분석, 제약 요인(멀티오믹스 데이터의 통합 및 표준화의 복잡성, 그리고 멀티오믹스 기술에 수반되는 높은 비용으로 인한 보급 제한), 기회(조직 컨텍스트 분석 및 바이오마커 발견을 위한 공간 단백질체학의 채택 확대, 그리고 고해상도 세포 프로파일링을 위한 단일 세포 단백질체학의 부상), 그리고 과제(멀티오믹스 워크플로우 전반에 걸친 표준화 부재) 등, 멀티오믹스 시장의 성장에 영향을 미치는 요인에 대해 해설하고 있습니다
- 제품 개발/혁신: 멀티오믹스 시장에서 새로 출시된 제품에 대한 상세한 분석
- 시장 개발: 수익성이 높은 시장에 대한 포괄적인 정보 ? 이 보고서에서는 다양한 지역에 걸친 멀티오믹스 시장을 분석하고 있습니다
- 시장 다각화: 멀티오믹스 시장의 신제품, 미개발 지역, 최근 동향 및 투자에 대한 포괄적인 정보
- 경쟁 분석: 10x Genomics, Inc.(미국), Thermo Fisher Scientific Inc.(미국), Illumina, Inc.(미국), Oxford Nanopore Technologies plc(영국), Bruker Corporation(미국) 등 주요 기업의 시장 점유율, 성장 전략, 제품 라인업에 대한 상세한 평가
자주 묻는 질문
목차
제1장 서론
제2장 개요
제3장 주요 인사이트
제4장 시장 개요
제5장 업계 동향
제6장 기술 진보, AI에 의한 영향, 특허, 혁신, 향후 응용
제7장 규제 상황과 지속가능성 구상
제8장 멀티오믹스 시장(오퍼링별)
제9장 멀티오믹스 시장(기술별)
제10장 멀티오믹스 시장(방법별)
제11장 멀티오믹스 시장(워크플로우별)
제12장 멀티오믹스 시장(용도별)
제13장 멀티오믹스 시장(최종사용자별)
제14장 지역별 멀티오믹스 시장
제15장 경쟁 구도
제16장 기업 개요
제17장 조사 방법
제18장 부록
KSA 26.08.19The global multiomics market is estimated to reach USD 5.70 billion by 2031 from USD 3.18 billion in 2026, at a CAGR of 12.3% during the forecast period. The global multiomics market is expected to witness significant growth through 2031, driven by the increasing adoption of integrated genomic, transcriptomic, proteomic, metabolomic, and epigenomic profiling technologies.
| Scope of the Report | |
|---|---|
| Years Considered for the Study | 2026-2031 |
| Base Year | 2025 |
| Forecast Period | 2026-2031 |
| Units Considered | Value (USD billion) |
| Segments | Offering, Method, Technology, Workflow, Application, and End User |
| Regions covered | North America, Europe, the Asia Pacific, Latin America, the Middle East, and Africa |
The market expansion is supported by rising demand for comprehensive biological characterization in oncology, drug discovery, precision medicine, and translational research. Advancements in single-cell analysis, spatial omics, next-generation sequencing, mass spectrometry, and AI-enabled bioinformatics platforms are further accelerating adoption. However, high technology costs, complex data integration requirements, and the need for specialized computational expertise may limit adoption across resource-constrained research environments.
"The product segment accounted for the largest share by offering in the multiomics market in 2025."
Based on offering, the multiomics market is segmented into products and services. In 2025, products accounted for the largest share of the market, driven by widespread adoption of sequencing platforms, analytical instruments, assay kits, reagents, consumables, and software solutions required throughout multiomics workflows. These products support sample preparation, sequencing, characterization, and data analysis activities across pharmaceutical companies, biotechnology firms, academic institutions, and research laboratories. The services segment is expected to grow at the fastest rate during the forecast period, supported by increasing outsourcing of complex multiomics profiling, bioinformatics analysis, and integrated omics interpretation to specialized service providers.
"Single-cell omics accounted for the largest share, by method, in the multiomics market in 2025."
Based on method, the multiomics market is segmented into epigenomics, single-cell omics, spatial omics, long-read & long-range sequencing, proteomics, and other methods. Single-cell omics accounted for the largest share in 2025 due to its ability to characterize cellular heterogeneity and molecular interactions at individual cell resolution. Increasing adoption in oncology, immunology, developmental biology, and drug discovery applications continues to support its leading position. Spatial omics is expected to register the fastest growth during the forecast period, driven by increasing demand for technologies that preserve tissue architecture while enabling simultaneous molecular profiling.
"The Asia Pacific is growing at the highest CAGR in the multiomics market from 2026 to 2031."
The multiomics market is segmented into North America, Europe, Asia Pacific, Latin America, the Middle East, and Africa. During the forecast period, the Asia Pacific region is expected to register the highest CAGR, driven by increasing investments in genomics and life sciences research, expanding precision medicine initiatives, and the growing adoption of next-generation sequencing (NGS), single-cell, spatial biology, and high-resolution mass spectrometry technologies. Regional growth is further supported by rising government funding for omics research, rapid expansion of biotechnology and pharmaceutical R&D, increasing availability of advanced research infrastructure, and the growing presence of contract research organizations (CROs) and genomic service providers. Additionally, the strong presence of leading regional companies such as BGI Genomics and Novogene, along with continued investments by global multiomics technology providers, is strengthening the region's capabilities in multiomics research, biomarker discovery, and precision medicine applications, making Asia Pacific the fastest-growing market during the forecast period.
The primary interviews conducted for this report can be categorized as follows:
- By Respondent: Supply Side - 70% and Demand Side - 30%
- By Company Type: Tier 1 - 40%, Tier 2 - 30%, and Tier 3 - 30%
- By Designation: CXOs and Directors - 30%, Managers - 45%, and Others - 25%
- By Region: North America - 40%, Europe - 25%, Asia Pacific - 20%, Latin America - 10%, and the Middle East & Africa - 5%
List of Companies Profiled in the Report
- 10x Genomics, Inc.
- Thermo Fisher Scientific Inc.
- Illumina, Inc.
- Oxford Nanopore Technologies plc
- Bruker
- PacBio
- Danaher Corporation
- Vizgen Corporation
- Agilent Technologies, Inc
- Biognosys AG
- Merck KGaA
- QIAGEN N.V.
- Revvity, Inc.
- Waters Corporation
- Syngene International
- Bio-Rad Laboratories, Inc
- Takara Bio Inc
- Metabolon, Inc
- BGI Genomics Co., Ltd
Research Coverage
This research report categorizes the multiomics market by offering, method, technology, workflow, application, end user, and region. The scope of the report covers detailed information regarding the major factors, such as drivers, challenges, opportunities, and restraints, influencing the growth of the multiomics market. A detailed analysis of the key industry players has been done to provide insights into their business overview, product portfolio, key strategies such as product and service approvals and launches, collaborations, partnerships, expansions, agreements, and recent developments associated with the multiomics market. This report covers competitive analysis of top players and upcoming startups in the multiomics market ecosystem.
Key Benefits of Buying the Report
The report will help market leaders/new entrants by providing the closest approximations of revenue for the overall multiomics market and its subsegments. It will also help stakeholders better understand the competitive landscape and gain more insights to position their business more effectively and develop suitable go-to-market strategies. This report will enable stakeholders to understand the market's pulse and provide information on key market drivers, restraints, opportunities, and challenges.
The report provides insights into the following pointers:
- Analysis of key drivers (rising adoption of multiomics in precision medicine and disease stratification, rapid adoption of single-cell and spatial multiomics, increasing accessibility of high-quality integrated omics data for research, and advances in AI, machine learning, and cloud bioinformatics for cross-omics data interpretation), restraints (complexity of multiomics data integration and standardization, and high costs associated with multiomics technologies limiting widespread adoption), opportunities (growing adoption of spatial proteomics for tissue-context analysis and biomarker discovery, and increasing emergence of single-cell proteomics for high-resolution cellular profiling), and challenges (lack of standardization across multiomics workflows) influencing the growth of multiomics market
- Product Development/Innovation: Detailed insights on newly launched products of the multiomics market
- Market Development: Comprehensive information about lucrative markets - the report analyses the Multiomics market across varied regions
- Market Diversification: Exhaustive information about new products, untapped geographies, recent developments, and investments in the multiomics market
- Competitive Assessment: In-depth assessment of market shares, growth strategies, and product offerings of leading players such as 10x Genomics, Inc. (US), Thermo Fisher Scientific Inc. (US), Illumina, Inc. (US), Oxford Nanopore Technologies plc (UK), and Bruker Corporation (US), among others
TABLE OF CONTENTS
1 INTRODUCTION
- 1.1 STUDY OBJECTIVES
- 1.2 MARKET DEFINITION
- 1.3 STUDY SCOPE
- 1.3.1 MARKET SEGMENTATION AND REGIONAL SCOPE
- 1.3.2 INCLUSIONS & EXCLUSIONS
- 1.3.3 YEARS CONSIDERED
- 1.3.4 CURRENCY CONSIDERED
- 1.4 STAKEHOLDERS
2 EXECUTIVE SUMMARY
- 2.1 KEY INSIGHTS AND MARKET HIGHLIGHTS
- 2.2 KEY MARKET PARTICIPANTS: SHARE INSIGHTS AND STRATEGIC DEVELOPMENTS
- 2.3 DISRUPTIVE TRENDS SHAPING THE MARKET
- 2.4 HIGH-GROWTH SEGMENTS & EMERGING FRONTIERS
- 2.5 SNAPSHOT: GLOBAL MARKET SIZE, GROWTH RATE, AND FORECAST
3 PREMIUM INSIGHTS
- 3.1 MULTIOMICS MARKET OVERVIEW
- 3.2 MULTIOMICS MARKET, BY OFFERING AND REGION
- 3.3 MULTIOMICS MARKET: GEOGRAPHIC SNAPSHOT
- 3.4 MULTIOMICS MARKET, BY OFFERING
4 MARKET OVERVIEW
- 4.1 INTRODUCTION
- 4.2 MARKET DYNAMICS
- 4.2.1 DRIVERS
- 4.2.1.1 Rising use of multiomics in precision medicine and disease stratification
- 4.2.1.2 Rapid adoption of single-cell and spatial multiomics
- 4.2.1.3 Increasing accessibility of high-quality, integrated omics data for research
- 4.2.1.4 AI, machine learning, and cloud bioinformatics improving cross-omics interpretation
- 4.2.2 RESTRAINTS
- 4.2.2.1 Complexity of multiomics data integration and standardization
- 4.2.2.2 High costs constrain technology adoption
- 4.2.3 OPPORTUNITIES
- 4.2.3.1 Growing adoption of spatial proteomics for tissue-context analysis and biomarker discovery
- 4.2.3.2 Increasing emergence of single-cell proteomics for high-resolution characterization of cellular profiles
- 4.2.4 CHALLENGES
- 4.2.4.1 Lack of standardization across multiomics workflows
- 4.2.1 DRIVERS
- 4.3 UNMET NEEDS AND WHITE SPACES
- 4.4 INTERCONNECTED MARKETS & CROSS-SECTOR OPPORTUNITIES
- 4.5 STRATEGIC MOVES BY TIER-1/2/3 PLAYERS
5 INDUSTRY TRENDS
- 5.1 PORTER'S FIVE FORCES ANALYSIS
- 5.1.1 THREAT OF NEW ENTRANTS
- 5.1.2 THREAT OF SUBSTITUTES
- 5.1.3 BARGAINING POWER OF BUYERS
- 5.1.4 BARGAINING POWER OF SUPPLIERS
- 5.1.5 INTENSITY OF COMPETITIVE RIVALRY
- 5.2 MACROECONOMIC OUTLOOK
- 5.2.1 INTRODUCTION
- 5.2.2 GDP TRENDS AND FORECAST
- 5.2.3 TRENDS IN GLOBAL HEALTHCARE INDUSTRY
- 5.2.4 TRENDS IN GLOBAL PHARMACEUTICAL INDUSTRY
- 5.3 VALUE CHAIN ANALYSIS
- 5.4 ECOSYSTEM ANALYSIS
- 5.5 PRICING ANALYSIS
- 5.5.1 AVERAGE SELLING PRICE TREND OF INSTRUMENTS, BY TYPE (2023-2025)
- 5.5.2 AVERAGE SELLING PRICE TREND OF CONSUMABLES, BY TYPE, 2023-2025
- 5.5.3 AVERAGE SELLING PRICE TREND, BY REGION, 2023-2025
- 5.6 TRADE ANALYSIS
- 5.6.1 IMPORT DATA FOR HS CODE 9027
- 5.6.2 EXPORT DATA FOR HS CODE 9027
- 5.6.3 IMPORT VOLUME FOR HS CODE 9027
- 5.6.4 EXPORT VOLUME FOR HS CODE 9027
- 5.7 KEY CONFERENCES & EVENTS
- 5.8 TRENDS/DISRUPTIONS IMPACTING CUSTOMERS' BUSINESSES
- 5.9 INVESTMENT/FUNDING ACTIVITY
- 5.10 CASE STUDY ANALYSIS
- 5.10.1 ADVANCED MULTIOMICS PROFILING TO SUPPORT PRECISION MEDICINE ADOPTION
- 5.10.2 INTEGRATED LONG-READ SEQUENCING TO SUPPORT MULTIOMICS RESEARCH
- 5.10.3 MULTIOMICS DATA INTEGRATION TO ACCELERATE BIOMARKER DISCOVERY
- 5.11 IMPACT OF 2025 US TARIFFS-MULTIOMICS MARKET
- 5.11.1 INTRODUCTION
- 5.11.2 KEY TARIFF RATES
- 5.11.3 PRICE IMPACT ANALYSIS
- 5.11.4 IMPACT ON COUNTRIES/REGIONS
- 5.11.4.1 North America
- 5.11.4.2 Europe
- 5.11.4.3 Asia Pacific
- 5.11.5 IMPACT ON END-USE INDUSTRIES
- 5.11.5.1 Pharmaceutical and biotechnology companies
- 5.11.5.2 Hospitals and diagnostic laboratories
- 5.11.5.3 Academic & research institutes
- 5.11.5.4 CROs & CDMOs
6 TECHNOLOGICAL ADVANCEMENTS, AI-DRIVEN IMPACT, PATENTS, INNOVATIONS, AND FUTURE APPLICATIONS
- 6.1 KEY TECHNOLOGIES
- 6.1.1 SINGLE-CELL MULTIOMICS CO-ASSAYS AND SCALABLE BARCODING
- 6.1.2 SPATIAL MULTIOMICS AND SUBCELLULAR TISSUE MAPPING
- 6.1.3 HIGH-PLEX PROTEOGENOMICS AND NGS/PCR-BASED PROTEIN READOUTS
- 6.2 ADJACENT TECHNOLOGIES
- 6.2.1 MICROARRAYS AND HYBRIDIZATION-BASED PROFILING
- 6.2.2 DIGITAL PATHOLOGY AND ADVANCED SPATIAL IMAGING
- 6.3 COMPLEMENTARY TECHNOLOGIES
- 6.3.1 MICROFLUIDICS, CELL/NUCLEI CAPTURE, AND SAMPLE INDEXING
- 6.3.2 HIGH-RESOLUTION MASS SPECTROMETRY AND ION MOBILITY
- 6.4 TECHNOLOGY/PRODUCT ROADMAP
- 6.5 PATENT ANALYSIS
- 6.5.1 TOP APPLICANTS/OWNERS (COMPANIES) FOR MULTIOMICS PATENTS, 2015-2025
- 6.6 FUTURE APPLICATIONS
- 6.7 IMPACT OF AI/GEN AI ON MULTIOMICS MARKET
- 6.7.1 TOP USE CASES AND MARKET POTENTIAL
- 6.7.2 BEST PRACTICES IN AI-ENABLED MULTIOMICS WORKFLOWS
- 6.7.3 CASE STUDIES OF AI IMPLEMENTATION IN MULTIOMICS MARKET
- 6.7.4 INTERCONNECTED ADJACENT ECOSYSTEMS AND IMPACT ON MARKET PLAYERS
- 6.7.5 CLIENTS' READINESS TO ADOPT GENERATIVE AI IN MULTIOMICS MARKET
7 REGULATORY LANDSCAPE AND SUSTAINABILITY INITIATIVES
- 7.1 REGIONAL REGULATIONS AND COMPLIANCE
- 7.1.1 REGULATORY BODIES, GOVERNMENT AGENCIES, AND OTHER ORGANIZATIONS
- 7.1.2 INDUSTRY STANDARDS
- 7.2 SUSTAINABILITY INITIATIVES
- 7.3 IMPACT OF REGULATORY POLICIES ON SUSTAINABILITY INITIATIVES
- 7.4 CERTIFICATIONS, LABELING, AND ECO-STANDARDS
8 MULTIOMICS MARKET, BY OFFERING
- 8.1 INTRODUCTION
- 8.2 PRODUCTS
- 8.2.1 CONSUMABLES
- 8.2.1.1 Increasing experiment volumes, higher multiplexing, and recurring reagent requirements support growth
- 8.2.1.2 Assay kits & reagents
- 8.2.1.2.1 Recurring assay consumption, higher multiplexing, and improved low-input performance drive market growth
- 8.2.1.3 Other consumables
- 8.2.2 INSTRUMENTS & SOFTWARE
- 8.2.2.1 Integrated multiomics platforms, automated workflows, and AI-enabled data interpretation strengthen demand
- 8.2.1 CONSUMABLES
- 8.3 SERVICES
- 8.3.1 RISING OUTSOURCING OF SPECIALIZED PROFILING AND INTERPRETATION TO DRIVE MARKET GROWTH
9 MULTIOMICS MARKET, BY TECHNOLOGY
- 9.1 INTRODUCTION
- 9.2 SEQUENCING
- 9.2.1 LONG-READ SEQUENCING
- 9.2.1.1 Nanopore sequencing
- 9.2.1.1.1 Real-time native-molecule analysis, scalable platforms, and integrated genomic-epigenomic readouts are accelerating nanopore sequencing adoption
- 9.2.1.2 SMRT Sequencing
- 9.2.1.2.1 High-accuracy HiFi reads and lower sequencing cost to expand SMRT-based multiomics
- 9.2.1.1 Nanopore sequencing
- 9.2.2 OTHER SEQUENCING TECHNOLOGIES
- 9.2.1 LONG-READ SEQUENCING
- 9.3 PROTEOMICS
- 9.3.1 ADVANCES IN HIGH-SENSITIVITY MASS SPECTROMETRY, SINGLE-CELL ANALYSIS, AND SCALABLE PROTEIN QUANTIFICATION ARE ACCELERATING PROTEOMICS ADOPTION IN MULTIOMICS RESEARCH
- 9.4 OTHER TECHNOLOGIES
10 MULTIOMICS MARKET, BY METHOD
- 10.1 INTRODUCTION
- 10.2 SINGLE-CELL OMICS
- 10.2.1 IMPROVED CELL CAPTURE AND GROWING DEMAND TO RESOLVE CELLULAR HETEROGENEITY DRIVE MARKET GROWTH
- 10.2.2 SINGLE-CELL TRANSCRIPTOMICS
- 10.2.2.1 Higher sample throughput, improved cell recovery, and compatibility with fixed clinical samples are expanding single-cell transcriptomics
- 10.2.3 SINGLE-CELL EPIGENOMICS
- 10.2.3.1 Growing interest in gene regulation, chromatin state, and treatment resistance is accelerating single-cell epigenomics research
- 10.2.4 SINGLE-CELL PROTEOMICS
- 10.2.4.1 Ultrasensitive mass spectrometry and higher-throughput protein quantification expanding functional analysis at single-cell resolution
- 10.2.5 SINGLE-CELL GENOMICS
- 10.2.5.1 Improved detection of clonal variation and simultaneous genotype-phenotype analysis are driving single-cell genomics adoption
- 10.2.6 OTHER SINGLE-CELL OMICS
- 10.3 PROTEOMICS
- 10.3.1 MS-BASED PROTEOMICS
- 10.3.1.1 Data-independent acquisition and improved quantitative depth to sustain MS-based proteomics leadership
- 10.3.2 NGS-BASED PROTEOMICS
- 10.3.2.1 Sequencing readouts and ultra-high-plex panels to make NGS-based proteomics the fastest-growing proteomics method
- 10.3.3 PCR-BASED PROTEOMICS
- 10.3.3.1 Sensitive proximity-amplification assays to support targeted, low-volume protein profiling
- 10.3.4 OTHER PROTEOMICS METHODS
- 10.3.1 MS-BASED PROTEOMICS
- 10.4 SPATIAL OMICS
- 10.4.1 SPATIAL TRANSCRIPTOMICS
- 10.4.1.1 Whole-transcriptome tissue mapping and higher resolution to sustain spatial transcriptomics leadership
- 10.4.2 SPATIAL PROTEOMICS
- 10.4.2.1 Higher-plex imaging and tissue phenotyping to accelerate spatial proteomics adoption
- 10.4.3 SPATIAL EPIGENOMICS
- 10.4.3.1 Mapping regulatory states within tissue to expand spatial epigenomics from early research applications
- 10.4.4 SPATIAL GENOMICS
- 10.4.4.1 In situ variant and copy-number mapping to support spatial genomics growth
- 10.4.5 OTHER SPATIAL OMICS
- 10.4.1 SPATIAL TRANSCRIPTOMICS
- 10.5 LONG-READ & LONG-RANGE SEQUENCING
- 10.5.1 IMPROVED STRUCTURAL VARIANT, ISOFORM, AND NATIVE EPIGENETIC RESOLUTION TO ACCELERATE ADOPTION
- 10.5.2 LONG-READ SEQUENCING
- 10.5.2.1 Higher accuracy and throughput to ensure market leadership
- 10.5.3 LONG-RANGE SEQUENCING
- 10.5.3.1 Genome mapping and linked information to improve structural and haplotype characterization
- 10.5.4 OTHER LONG-READ & LONG-RANGE SEQUENCING METHODS
- 10.6 EPIGENOMICS
- 10.6.1 SEQUENCING-BASED EPIGENOMICS
- 10.6.1.1 DNA methylation sequencing
- 10.6.1.1.1 Genome-wide and targeted methylation analysis to sustain the largest sequencing-based epigenomics share
- 10.6.1.2 Chromatin accessibility sequencing
- 10.6.1.2.1 ATAC-seq adoption and regulatory element mapping to make accessibility profiling the fastest-growing epigenomics method
- 10.6.1.3 Histone modification profiling
- 10.6.1.3.1 Lower-input chromatin profiling to broaden analysis of histone-associated regulatory states
- 10.6.1.4 Chromatin interaction analysis
- 10.6.1.4.1 3D genome mapping to connect distal regulatory elements with gene activity
- 10.6.1.1 DNA methylation sequencing
- 10.6.2 OTHER EPIGENOMICS METHODS
- 10.6.1 SEQUENCING-BASED EPIGENOMICS
- 10.7 OTHER METHODS
11 MULTIOMICS MARKET, BY WORKFLOW
- 11.1 INTRODUCTION
- 11.2 SEQUENCING & ANALYSIS/SAMPLE CHARACTERIZATION
- 11.2.1 HIGHER-THROUGHPUT MOLECULAR PROFILING AND INCREASINGLY SENSITIVE ANALYTICAL PLATFORMS TO STRENGTHEN SEQUENCING AND SAMPLE CHARACTERIZATION WORKFLOWS
- 11.3 SAMPLE PREPARATION
- 11.3.1 IMPROVED SAMPLE PRESERVATION, CELL CAPTURE, AUTOMATION, AND MULTIPLEXING TO EXPAND SCALE AND REPRODUCIBILITY OF MULTIOMICS STUDIES
- 11.4 DATA VISUALIZATION & ANALYSIS
- 11.4.1 AI-ENABLED ANALYTICS AND MULTIMODAL INTEGRATION TO ACCELERATE CONVERSION OF COMPLEX MULTIOMICS DATA INTO BIOLOGICAL INSIGHTS
12 MULTIOMICS MARKET, BY APPLICATION
- 12.1 INTRODUCTION
- 12.2 ONCOLOGY
- 12.2.1 GROWING USE OF TUMOR MULTIOMICS FOR BIOMARKER DISCOVERY AND PATIENT STRATIFICATION DRIVES MARKET LEADERSHIP
- 12.3 DRUG DISCOVERY & DEVELOPMENT
- 12.3.1 DATA-DRIVEN TARGET SELECTION AND MECHANISM STUDIES TO MAKE DRUG DISCOVERY FASTEST-GROWING APPLICATION
- 12.4 IMMUNOLOGY
- 12.4.1 LARGE-SCALE IMMUNE PROFILING PROGRAMS TO ACCELERATE MULTIMODAL IMMUNOLOGY RESEARCH
- 12.5 PRECISION MEDICINE
- 12.5.1 INTEGRATED MOLECULAR AND CLINICAL DATA TO EXPAND PATIENT-SPECIFIC DECISION SUPPORT
- 12.6 BIOMARKER DISCOVERY
- 12.6.1 CROSS-OMICS VALIDATION TO IMPROVE BIOMARKER ROBUSTNESS AND CLINICAL RELEVANCE
- 12.7 CELL BIOLOGY
- 12.7.1 HIGHER-RESOLUTION PROFILING OF CELL STATES, INTERACTIONS, AND DIFFERENTIATION PROCESSES EXPANDING ROLE OF MULTIOMICS IN CELL BIOLOGY
- 12.8 TRANSLATIONAL RESEARCH
- 12.8.1 IMPROVED ANALYSIS OF SPECIMENS AND MORE SCALABLE SPATIAL WORKFLOWS ACCELERATE TRANSLATION OF MULTIOMICS DISCOVERIES INTO THERAPEUTIC RESEARCH
- 12.9 NEUROLOGY
- 12.9.1 BRAIN-CELL ATLASES AND SPATIALLY RESOLVED MOLECULAR PROFILING DRIVE UNDERSTANDING OF NEUROLOGICAL DISEASE PROGRESSION AND THERAPEUTIC TARGETS
- 12.10 CLINICAL DIAGNOSTICS
- 12.10.1 GROWING CLINICAL SEQUENCING INFRASTRUCTURE TO SUPPORT MULTIOMICS-RELATED DIAGNOSTIC ADOPTION
- 12.11 OTHER APPLICATIONS
13 MULTIOMICS MARKET, BY END USER
- 13.1 INTRODUCTION
- 13.2 PHARMACEUTICAL & BIOTECHNOLOGY COMPANIES
- 13.2.1 EXPANDING PRECISION MEDICINE INITIATIVES ACCELERATE MULTIOMICS ADOPTION
- 13.3 ACADEMIC & RESEARCH INSTITUTES
- 13.3.1 GROWING RESEARCH FUNDING DRIVING MULTIOMICS USAGE AMONG ACADEMIC AND RESEARCH INSTITUTES
- 13.4 CROS & CDMOS
- 13.4.1 OUTSOURCING OF COMPLEX PROFILING AND ANALYTICS TO MAKE CROS & CDMOS THE FASTEST-GROWING END USERS
- 13.5 HOSPITALS & DIAGNOSTIC/CLINICAL LABORATORIES
- 13.5.1 CLINICAL EVIDENCE AND WORKFLOW STANDARDIZATION TO SUPPORT MEASURED ADOPTION IN HOSPITALS AND LABORATORIES
14 MULTIOMICS MARKET, BY REGION
- 14.1 INTRODUCTION
- 14.2 NORTH AMERICA
- 14.2.1 US
- 14.2.1.1 Regulatory acceptance, clinically integrated molecular testing, and population-scale health datasets accelerate multiomics adoption
- 14.2.2 CANADA
- 14.2.2.1 Population-scale precision health initiatives expand integration capacity
- 14.2.1 US
- 14.3 EUROPE
- 14.3.1 GERMANY
- 14.3.1.1 Clinical integration of genome sequencing and strong translational research networks drive market growth
- 14.3.2 UK
- 14.3.2.1 Population-scale multimodal datasets, NHS integration, and industry-backed biomarker programs propel market growth
- 14.3.3 FRANCE
- 14.3.3.1 Standardized precision-medicine pathways and strong oncology research networks drive market
- 14.3.4 ITALY
- 14.3.4.1 Shared research infrastructure widening access beyond leading academic centers
- 14.3.5 SPAIN
- 14.3.5.1 Hospital-linked genomics programs support steady adoption of integrated profiling
- 14.3.6 REST OF EUROPE
- 14.3.1 GERMANY
- 14.4 ASIA PACIFIC
- 14.4.1 CHINA
- 14.4.1.1 Large-scale genomic initiatives and rapid adoption of precision medicine technologies drive growth
- 14.4.2 JAPAN
- 14.4.2.1 Mature biobanks and pharmaceutical research support stable, high-value adoption
- 14.4.3 SOUTH KOREA
- 14.4.3.1 National bio-data infrastructure and digital-health capabilities accelerate multiomics use
- 14.4.4 INDIA
- 14.4.4.1 GenomeIndia and expanding translational capacity propel rapid growth in Indian multiomics market
- 14.4.5 AUSTRALIA
- 14.4.5.1 Mission-led genomics investment strengthens clinical translation and data integration
- 14.4.6 REST OF ASIA PACIFIC
- 14.4.1 CHINA
- 14.5 LATIN AMERICA
- 14.5.1 BRAZIL
- 14.5.1.1 Growing genomics infrastructure and increasing precision medicine adoption drive market growth
- 14.5.2 REST OF LATIN AMERICA
- 14.5.1 BRAZIL
- 14.6 MIDDLE EAST
- 14.6.1 GCC COUNTRIES
- 14.6.1.1 Saudi Arabia
- 14.6.1.1.1 Rising healthcare expenditure, expanding genomics research, and investments in precision medicine to propel market
- 14.6.1.2 UAE
- 14.6.1.2.1 Large-scale citizen sequencing moves genomics toward preventive and personalized care
- 14.6.1.3 Rest of GCC Countries
- 14.6.1.1 Saudi Arabia
- 14.6.2 REST OF MIDDLE EAST
- 14.6.1 GCC COUNTRIES
- 14.7 AFRICA
- 14.7.1 DESPITE EMERGING OPPORTUNITIES, GROWTH REMAINS SLOW DUE TO LIMITED ACCESS TO ADVANCED TECHNOLOGY AND INADEQUATE FUNDING & WORKFORCE
15 COMPETITIVE LANDSCAPE
- 15.1 OVERVIEW
- 15.2 KEY PLAYER STRATEGIES/RIGHT TO WIN
- 15.2.1 OVERVIEW OF STRATEGIES ADOPTED BY PLAYERS IN MULTIOMICS MARKET
- 15.3 REVENUE ANALYSIS, 2021-2025
- 15.4 MARKET SHARE ANALYSIS, 2025
- 15.5 COMPANY EVALUATION MATRIX: KEY PLAYERS, 2025
- 15.5.1 STARS
- 15.5.2 EMERGING LEADERS
- 15.5.3 PERVASIVE PLAYERS
- 15.5.4 PARTICIPANTS
- 15.5.5 COMPANY FOOTPRINT: KEY PLAYERS, 2025
- 15.5.5.1 Company footprint
- 15.5.5.2 Region footprint
- 15.5.5.3 Offering footprint
- 15.5.5.4 Technology footprint
- 15.5.5.5 Workflow footprint
- 15.6 COMPANY EVALUATION MATRIX: STARTUPS/SMES, 2025
- 15.6.1 PROGRESSIVE COMPANIES
- 15.6.2 RESPONSIVE COMPANIES
- 15.6.3 DYNAMIC COMPANIES
- 15.6.4 STARTING BLOCKS
- 15.6.5 COMPETITIVE BENCHMARKING: STARTUPS/SMES, 2025
- 15.6.5.1 Detailed list of key startups/SMEs
- 15.6.5.2 Competitive benchmarking of key startups/SMEs
- 15.7 COMPANY VALUATION AND FINANCIAL METRICS
- 15.7.1 COMPANY VALUATION
- 15.7.2 FINANCIAL METRICS
- 15.8 BRAND/PRODUCT COMPARISON
- 15.9 COMPETITIVE SCENARIO
- 15.9.1 PRODUCT & SERVICE LAUNCHES
- 15.9.2 DEALS
- 15.9.3 EXPANSIONS
16 COMPANY PROFILES
- 16.1 KEY COMPANIES
- 16.1.1 10X GENOMICS
- 16.1.1.1 Business overview
- 16.1.1.2 Products & services offered
- 16.1.1.3 Recent developments
- 16.1.1.3.1 Product & service launches
- 16.1.1.3.2 Deals
- 16.1.1.4 MnM view
- 16.1.1.4.1 Key strengths
- 16.1.1.4.2 Strategic choices
- 16.1.1.4.3 Weaknesses and competitive threats
- 16.1.2 THERMO FISHER SCIENTIFIC INC.
- 16.1.2.1 Business overview
- 16.1.2.2 Products & services offered
- 16.1.2.3 Recent developments
- 16.1.2.3.1 Product & service launches
- 16.1.2.3.2 Deals
- 16.1.2.4 MnM view
- 16.1.2.4.1 Key strengths
- 16.1.2.4.2 Strategic choices
- 16.1.2.4.3 Weaknesses and competitive threats
- 16.1.3 ILLUMINA, INC.
- 16.1.3.1 Business overview
- 16.1.3.2 Products & services offered
- 16.1.3.3 Recent developments
- 16.1.3.3.1 Product & service launches
- 16.1.3.3.2 Deals
- 16.1.3.4 MnM view
- 16.1.3.4.1 Key strengths
- 16.1.3.4.2 Strategic choices
- 16.1.3.4.3 Weaknesses and competitive threats
- 16.1.4 OXFORD NANOPORE TECHNOLOGIES PLC
- 16.1.4.1 Business overview
- 16.1.4.2 Products & services offered
- 16.1.4.3 Recent developments
- 16.1.4.3.1 Deals
- 16.1.4.3.2 Expansions
- 16.1.4.4 MnM view
- 16.1.4.4.1 Key strengths
- 16.1.4.4.2 Strategic choices
- 16.1.4.4.3 Weaknesses and competitive threats
- 16.1.5 BRUKER
- 16.1.5.1 Business overview
- 16.1.5.2 Products & services offered
- 16.1.5.3 Recent developments
- 16.1.5.3.1 Product & service launches
- 16.1.5.3.2 Deals
- 16.1.5.4 MnM view
- 16.1.5.4.1 Key strengths
- 16.1.5.4.2 Strategic choices
- 16.1.5.4.3 Weaknesses and competitive threats
- 16.1.6 PACBIO
- 16.1.6.1 Business overview
- 16.1.6.2 Products & services offered
- 16.1.6.3 Recent developments
- 16.1.6.3.1 Product & service launches
- 16.1.6.3.2 Deals
- 16.1.7 DANAHER CORPORATION
- 16.1.7.1 Business overview
- 16.1.7.2 Products & services offered
- 16.1.7.3 Recent developments
- 16.1.7.3.1 Product & service launches
- 16.1.7.3.2 Deals
- 16.1.8 VIZGEN, INC.
- 16.1.8.1 Business overview
- 16.1.8.2 Products & services offered
- 16.1.8.3 Recent developments
- 16.1.8.3.1 Deals
- 16.1.9 AGILENT TECHNOLOGIES, INC.
- 16.1.9.1 Business overview
- 16.1.9.2 Products & services offered
- 16.1.9.3 Recent developments
- 16.1.9.3.1 Product & service launches
- 16.1.9.3.2 Deals
- 16.1.9.3.3 Expansions
- 16.1.10 BIOGNOSYS
- 16.1.10.1 Business overview
- 16.1.10.2 Products & services offered
- 16.1.10.3 Recent developments
- 16.1.10.3.1 Deals
- 16.1.11 MERCK KGAA
- 16.1.11.1 Business overview
- 16.1.11.2 Products & services offered
- 16.1.11.3 Recent developments
- 16.1.11.3.1 Expansions
- 16.1.12 QIAGEN N.V.
- 16.1.12.1 Business overview
- 16.1.12.2 Products & services offered
- 16.1.12.3 Recent developments
- 16.1.12.3.1 Product & service launches
- 16.1.12.3.2 Deals
- 16.1.12.3.3 Expansions
- 16.1.13 REVVITY, INC.
- 16.1.13.1 Business overview
- 16.1.13.2 Products & services offered
- 16.1.13.3 Recent developments
- 16.1.13.3.1 Product & service launches
- 16.1.13.3.2 Deals
- 16.1.14 WATERS CORPORATION
- 16.1.14.1 Business overview
- 16.1.14.2 Products & services offered
- 16.1.14.3 Recent developments
- 16.1.14.3.1 Product & service launches
- 16.1.14.3.2 Deals
- 16.1.14.3.3 Expansions
- 16.1.15 BIO-RAD LABORATORIES, INC.
- 16.1.15.1 Business overview
- 16.1.15.2 Products & services offered
- 16.1.15.3 Recent developments
- 16.1.15.3.1 Product & service launches
- 16.1.15.3.2 Deals
- 16.1.16 TAKARA BIO INC.
- 16.1.16.1 Business overview
- 16.1.16.2 Products & services offered
- 16.1.16.3 Recent developments
- 16.1.16.3.1 Expansions
- 16.1.17 METABOLON, INC.
- 16.1.17.1 Business overview
- 16.1.17.2 Products & services offered
- 16.1.17.3 Recent developments
- 16.1.17.3.1 Product & service launches
- 16.1.1 10X GENOMICS
- 16.2 OTHER PLAYERS
- 16.2.1 BGI GENOMICS CO., LTD.
- 16.2.2 NOVOGENE CO., LTD.
- 16.2.3 AZENTA, INC.
- 16.2.4 EVOTEC SE
- 16.2.5 MEDGENOME LABS LTD.
- 16.2.6 CD GENOMICS
- 16.2.7 BIOGENITY
- 16.2.8 SAPIENT BIOANALYTICS, LLC
- 16.2.9 RAYBIOTECH, INC.
- 16.2.10 SOURCE BIOSCIENCE LTD.
17 RESEARCH METHODOLOGY
- 17.1 RESEARCH DATA
- 17.1.1 SECONDARY DATA
- 17.1.2 PRIMARY DATA
- 17.2 MARKET ESTIMATION METHODOLOGY
- 17.2.1 MARKET SIZE ESTIMATION
- 17.2.2 INSIGHTS OF PRIMARY EXPERTS
- 17.2.3 TOP-DOWN APPROACH
- 17.3 MARKET GROWTH RATE PROJECTIONS
- 17.4 MARKET BREAKDOWN AND DATA TRIANGULATION
- 17.5 RESEARCH ASSUMPTIONS
- 17.6 RESEARCH LIMITATIONS
- 17.7 RISK ANALYSIS
18 APPENDIX
- 18.1 DISCUSSION GUIDE
- 18.2 KNOWLEDGESTORE: MARKETSANDMARKETS' SUBSCRIPTION PORTAL
- 18.3 CUSTOMIZATION OPTIONS
- 18.4 RELATED REPORTS
- 18.5 AUTHOR DETAILS


