|
시장보고서
상품코드
1430978
윤활유 시장 : 시장 점유율 분석, 산업 동향 및 통계, 성장 전망(2021-2026년)Global Lubricants - Market Share Analysis, Industry Trends & Statistics, Growth Forecasts (2021 - 2026) |
||||||
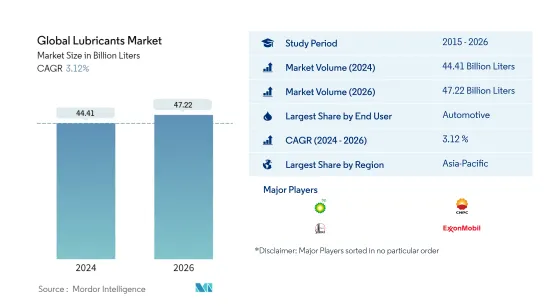
세계 윤활유 시장 규모는 2024년 444억 1,000만 리터로 추정되며, 2026년에는 472억 2,000만 리터에 달할 것으로 예상되며, 예측 기간(2024-2026년) 동안 3.12%의 연평균 복합 성장률(CAGR)로 성장할 것으로 예상됩니다.

주요 하이라이트
- 최종 용도별 최대 부문: 자동차: 자동차는 다른 산업용도에 비해 윤활유 교체 주기가 길어 전체 카테고리 중 가장 큰 최종 사용자로 나타났습니다.
- 최종 사용자 산업별 가장 빠른 성장률 부문: 발전: 발전은 천연가스 및 풍력 발전소의 저비용 에너지 수요 증가로 인해 전 세계적으로 가장 빠르게 성장하는 최종 사용자로 예측됩니다.
- 가장 규모가 큰 지역 시장 - 아시아태평양: 인도, 중국, 일본이 주도하는 아시아태평양은 다른 어떤 지역보다 자동차 및 산업기계 보유량이 많아 윤활유 소비의 주요 지역입니다.
- 급성장 지역 - 아시아태평양: 중국과 인도의 도시화, 전력 사용 증가, 자동차 소유율 증가로 인해 아시아태평양이 가장 빠르게 성장할 것으로 예상됩니다.
윤활유 시장 동향
최종 사용자별 최대 부문: 자동차
- 2020년 자동차 산업은 세계 윤활유 시장을 장악하고 윤활유 소비량의 약 절반을 차지했으며, 2015년부터 2019년까지 자동차 산업의 윤활유 소비량은 자동차 판매량과 사용량 증가로 인해 11% 증가했습니다.
- 2020년, 코로나19 관련 규제로 인해 일부 산업에서 유지보수 요구사항이 감소했습니다. 가장 큰 영향을 받은 산업은 자동차 산업으로 10.1%의 감소를 기록했고, 중장비(7.66%)가 그 뒤를 이었습니다.
- 2021-2026년 세계 윤활유 시장의 최종 사용자 산업에서 발전 산업은 연평균 4.8%의 빠른 성장세를 보일 것으로 예상되며, 자동차 산업(3.8%)이 그 뒤를 이을 것으로 보입니다. 세계 재생에너지 발전 부문의 용량 증가는 발전 산업에서 윤활유 소비를 촉진할 가능성이 높습니다.
최대 지역: 아시아태평양
- 2020년 아시아태평양은 세계 윤활유 소비량의 약 46%를 차지하며 세계 윤활유 소비량 1위를 차지했으며, 2015년부터 2019년까지 아시아태평양의 윤활유 소비량은 중국, 인도, 인도네시아가 주도하여 약 20% 증가했습니다.
- 2020년, 코로나19 사태로 인해 일부 산업의 가동이 중단되어 전 세계 윤활유 소비가 억제되었습니다. 북미가 가장 큰 영향을 받아 2019-20년윤활유 소비량이 13.4% 감소했고 유럽이 11.29% 감소했습니다.
- 아시아태평양은 2021년부터 26년까지 아프리카에서 가장 빠르게 성장하는 윤활유 시장이 될 것으로 예상되며, CAGR은 약 4.3%를 나타낼 것으로 보입니다. 이 지역의 자동차 판매 및 사용량 회복과 산업 활동의 확대는 가까운 미래에 아시아태평양의 윤활유 시장 성장을 견인할 가능성이 높습니다.
윤활유 산업 개요
세계 윤활유 시장은 세분화되어 있으며, 상위 5개 기업이 38.45%를 점유하고 있습니다. 이 시장의 주요 기업은 BP PLC(Castrol), China National Petroleum Corporation, China Petroleum & Chemical Corporation, ExxonMobil Corporation and Royal Dutch Shell PLC(알파벳순) 등입니다.
기타 혜택 :
기타 혜택- 엑셀 형식 시장 예측(ME) 시트
- 3개월간의 애널리스트 지원
목차
제1장 주요 요약과 주요 조사 결과
제2장 서론
- 조사의 전제조건과 시장 정의
- 조사 범위
- 조사 방법
제3장 주요 산업 동향
- 자동차 업계 동향
- 제조업 동향
- 발전 산업 동향
- 규제 프레임워크
- 밸류체인과 유통 채널 분석
제4장 시장 세분화
- 최종사용자별
- 자동차
- 중기
- 야금·금속 가공
- 발전
- 기타 최종사용자 산업
- 제품 유형별
- 엔진오일
- 그리스
- 유압작동유
- 금속 가공유
- 변속기&기어 오일
- 기타 제품 유형
- 지역별
- 아프리카
- 이집트
- 모로코
- 나이지리아
- 남아프리카공화국
- 기타 아프리카
- 아시아태평양
- 중국
- 인도
- 인도네시아
- 일본
- 말레이시아
- 한국
- 태국
- 베트남
- 기타 아시아태평양
- 유럽
- 프랑스
- 독일
- 이탈리아
- 러시아
- 스페인
- 영국
- 기타 유럽
- 중동
- 이란
- 카타르
- 사우디아라비아
- 터키
- 아랍에미리트
- 기타 중동
- 북미
- 캐나다
- 멕시코
- 미국
- 기타 북미
- 남미
- 아르헨티나
- 브라질
- 기타 남미
- 아프리카
제5장 경쟁 구도
- 주요 전략 동향
- 시장 점유율 분석
- 기업 개요
- Behran Oil Company
- BP PLC(Castrol)
- Carl Bechem GmbH
- Chevron Corporation
- China National Petroleum Corporation
- China Petroleum & Chemical Corporation
- Coperative Soceite des petroleum
- ENEOS Corporation
- Eni SpA
- ExxonMobil Corporation
- FUCHS
- Gazprom
- GS Caltex
- Gulf Oil International
- Hindustan Petroleum Corporation Limited
- Idemitsu Kosan Co. Ltd
- Indian Oil Corporation Limited
- Lukoil
- Motul
- Petromin Corporation
- Petronas Lubricants International
- Phillips 66 Lubricants
- PT Pertamina
- PTT Lubricants
- Rosneft
- Royal Dutch Shell PLC
- Terpel
- TotalEnergies
- Valvoline Inc.
- YPF
제6장 부록
- 부록 1 참고 문헌
- 부록 2 도표
제7장 CEO에 대한 주요 전략적 질문
LSH 24.02.29The Global Lubricants Market size is estimated at 44.41 Billion Liters in 2024, and is expected to reach 47.22 Billion Liters by 2026, growing at a CAGR of 3.12% during the forecast period (2024-2026).
Key Highlights
- Largest Segment by End-user Industry - Automotive : Automotive was the largest end-user among all categories due to the high replacement cycles of lubricants used in motor vehicles compared to any other industrial application.
- Fastest Segment by End-user Industry - Power Generation : Power generation is projected to be the fastest-growing end-user globally due to the increasing demand for low-cost energy from natural gas and wind power plants.
- Largest Region Market - Asia-Pacific : Asia-Pacific, driven mainly by India, China, and Japan, is the major lubricant-consuming region due to high vehicle ownerships and industrial machinery than any other region.
- Fastest Growing Region Market - Asia-Pacific : Due to rising urbanization, increased electricity use, and rising vehicle ownership in China and India, Asia-Pacific is projected to be the fastest-growing region.
Lubricants Market Trends
Largest Segment By End User : Automotive
- In 2020, the automotive industry dominated the global lubricants market, accounting for around half of the total lubricant consumption. During 2015-2019, lubricant consumption in the automotive industry increased by 11% due to growth in vehicle sales and usage.
- In 2020, COVID-19-related restrictions led to declined maintenance requirements from several industries. The major impact was observed in the automotive industry, which recorded a dip of 10.1% during the year, followed by heavy equipment (7.66%).
- Power generation is likely to be the fastest-growing end-user industry of the global lubricants market during 2021-2026, with a CAGR of 4.8%, followed by automotive (3.8%). The capacity additions in the renewable energy sector worldwide will likely drive lubricant consumption in the power generation industry.
Largest Region : Asia-Pacific
- In 2020, Asia-Pacific was the leading consumer of lubricants in the world, accounting for around 46% of the global lubricant consumption. During 2015-2019, lubricant consumption in the Asia-Pacific region increased by around 20%, driven by China, India, and Indonesia.
- In 2020, the COVID-19 outbreak restrained the operations of several industries, thereby restraining lubricant consumption across the globe. North America was the most affected, with a 13.4% drop in its lubricant consumption, followed by Europe, with an 11.29% drop, during 2019-20.
- Asia-Pacific is likely to be the fastest-growing lubricants market in Africa during 2021-26, with a CAGR of around 4.3%. The recovering automotive sales and usage combined with growing industrial activities in the region are likely to drive the growth of the Asia-Pacific lubricants market in the near future.
Lubricants Industry Overview
The Global Lubricants Market is fragmented, with the top five companies occupying 38.45%. The major players in this market are BP PLC (Castrol), China National Petroleum Corporation, China Petroleum & Chemical Corporation, ExxonMobil Corporation and Royal Dutch Shell PLC (sorted alphabetically).
Additional Benefits:
- The market estimate (ME) sheet in Excel format
- 3 months of analyst support
TABLE OF CONTENTS
1 Executive Summary & Key Findings
2 Introduction
- 2.1 Study Assumptions & Market Definition
- 2.2 Scope of the Study
- 2.3 Research Methodology
3 Key Industry Trends
- 3.1 Automotive Industry Trends
- 3.2 Manufacturing Industry Trends
- 3.3 Power Generation Industry Trends
- 3.4 Regulatory Framework
- 3.5 Value Chain & Distribution Channel Analysis
4 Market Segmentation
- 4.1 By End User
- 4.1.1 Automotive
- 4.1.2 Heavy Equipment
- 4.1.3 Metallurgy & Metalworking
- 4.1.4 Power Generation
- 4.1.5 Other End-user Industries
- 4.2 By Product Type
- 4.2.1 Engine Oils
- 4.2.2 Greases
- 4.2.3 Hydraulic Fluids
- 4.2.4 Metalworking Fluids
- 4.2.5 Transmission & Gear Oils
- 4.2.6 Other Product Types
- 4.3 By Region
- 4.3.1 Africa
- 4.3.1.1 Egypt
- 4.3.1.2 Morocco
- 4.3.1.3 Nigeria
- 4.3.1.4 South Africa
- 4.3.1.5 Rest of Africa
- 4.3.2 Asia-Pacific
- 4.3.2.1 China
- 4.3.2.2 India
- 4.3.2.3 Indonesia
- 4.3.2.4 Japan
- 4.3.2.5 Malaysia
- 4.3.2.6 South Korea
- 4.3.2.7 Thailand
- 4.3.2.8 Vietnam
- 4.3.2.9 Rest of Asia-Pacific
- 4.3.3 Europe
- 4.3.3.1 France
- 4.3.3.2 Germany
- 4.3.3.3 Italy
- 4.3.3.4 Russia
- 4.3.3.5 Spain
- 4.3.3.6 United Kingdom
- 4.3.3.7 Rest of Europe
- 4.3.4 Middle East
- 4.3.4.1 Iran
- 4.3.4.2 Qatar
- 4.3.4.3 Saudi Arabia
- 4.3.4.4 Turkey
- 4.3.4.5 UAE
- 4.3.4.6 Rest of Middle East
- 4.3.5 North America
- 4.3.5.1 Canada
- 4.3.5.2 Mexico
- 4.3.5.3 United States
- 4.3.5.4 Rest of North America
- 4.3.6 South America
- 4.3.6.1 Argentina
- 4.3.6.2 Brazil
- 4.3.6.3 Rest of South America
- 4.3.1 Africa
5 Competitive Landscape
- 5.1 Key Strategic Moves
- 5.2 Market Share Analysis
- 5.3 Company Profiles
- 5.3.1 Behran Oil Company
- 5.3.2 BP PLC (Castrol)
- 5.3.3 Carl Bechem GmbH
- 5.3.4 Chevron Corporation
- 5.3.5 China National Petroleum Corporation
- 5.3.6 China Petroleum & Chemical Corporation
- 5.3.7 Coperative Soceite des petroleum
- 5.3.8 ENEOS Corporation
- 5.3.9 Eni SpA
- 5.3.10 ExxonMobil Corporation
- 5.3.11 FUCHS
- 5.3.12 Gazprom
- 5.3.13 GS Caltex
- 5.3.14 Gulf Oil International
- 5.3.15 Hindustan Petroleum Corporation Limited
- 5.3.16 Idemitsu Kosan Co. Ltd
- 5.3.17 Indian Oil Corporation Limited
- 5.3.18 Lukoil
- 5.3.19 Motul
- 5.3.20 Petromin Corporation
- 5.3.21 Petronas Lubricants International
- 5.3.22 Phillips 66 Lubricants
- 5.3.23 PT Pertamina
- 5.3.24 PTT Lubricants
- 5.3.25 Rosneft
- 5.3.26 Royal Dutch Shell PLC
- 5.3.27 Terpel
- 5.3.28 TotalEnergies
- 5.3.29 Valvoline Inc.
- 5.3.30 YPF
6 Appendix
- 6.1 Appendix-1 References
- 6.2 Appendix-2 List of Tables & Figures