|
시장보고서
상품코드
1431450
점유 추적 : 시장 점유율 분석, 산업 동향 및 통계, 성장 예측(2024-2029년)Occupancy Tracking - Market Share Analysis, Industry Trends & Statistics, Growth Forecasts (2024 - 2029) |
||||||
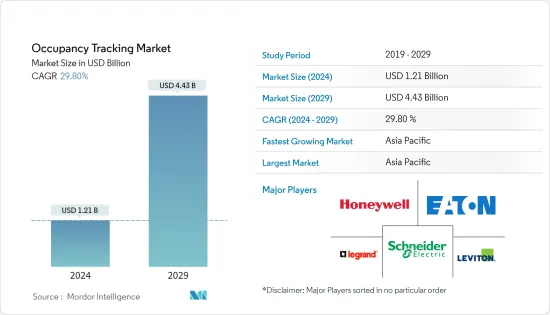
세계 점유 추적 시장 규모는 2024년 12억 1,000만 달러로 추정되며, 2029년에는 44억 3,000만 달러에 달할 것으로 예상되며, 예측 기간(2024-2029년) 동안 연평균 29.80% 성장할 것으로 예상됩니다.
다양한 건물 소유주들이 실제 공간 사용량을 모니터링하고 에너지 소비를 줄이고 탈탄소화 및 지속가능성 목표를 달성하기 위한 감축 노력을 목표로 삼아야 할 필요성이 증가함에 따라 예측 기간 동안 시장 성장을 촉진했습니다.
주요 하이라이트
- 점유 추적 기술은 기업이 비용을 절감하고 효율적으로 운영하기 위해 적절한 건물 공간만 사용한다는 지속적인 목표를 달성할 수 있도록 도와줍니다. 가동률 모니터링 센서는 건물을 현명하고 효율적으로 관리하고자 하는 사람들에게 필수적입니다.
- 많은 조직이 그 공간의 절반을 낭비하고 있습니다. 즉, 절약할 수 있는 잠재력은 엄청납니다. World Green Building Study에 따르면, 유럽 기업들은 사무실 건물의 낭비되는 공간을 줄이면 2,430억 달러를 절약할 수 있다고 합니다. 또한, 업무공간을 최적화하면 전 세계적으로 최대 1조 5,000억 달러를 절약할 수 있다고 합니다. 다른 자료에 따르면, 북미에서는 평균적으로 책상이나 사무실의 약 2/3가 사용되지 않는 것으로 나타났습니다. 또한, 허먼밀러의 공간 활용도 조사에 따르면, 개인 사무실은 하루 평균 77%가 사용되지 않는 것으로 나타났습니다.
- 에너지 효율이 높은 장비에 대한 수요 증가는 조사 대상 시장의 성장을 촉진할 것으로 보입니다. 에너지 소비를 줄이기 위해서는 가동률 파악이 중요한 역할을 합니다. 이는 가동률에 따라 장비 및 기타 장치를 종료하는 가동률 센서에 의해 달성됩니다. 이는 빛 공해를 줄이는 데 도움이 되며, 실내외 공간에서 사용할 수 있습니다. 예를 들어, 미국에서는 조명이 전체 건물 에너지 사용량의 11%를 차지하고 공조 시스템이 35%를 차지합니다. 미국 상업용 건물에서는 전체 전력 사용량의 약 36%를 차지합니다. 이러한 에너지 사용은 피할 수 없는 비용으로 여겨지기 쉽습니다. 그러나 이 에너지의 대부분은 매일 낭비되고 있습니다. 수많은 기업들이 아무도 사용하지 않는 방의 난방, 냉방, 조명에 대한 비용을 지불하고 있는 것입니다.
- 스마트 하우스, 기업 건물, 공장, 도시 개발을 위한 투자 확대가 예측 기간 동안 시장을 견인할 것으로 보입니다. 인도 정부는 디지털 인디아(Digital India) 구상의 일환으로 국내 IoT를 추진할 계획입니다. 정부는 700억 루피의 기금을 할당하여 IoT 기기를 통해 100개의 스마트 시티를 개발하여 교통을 제어하고, 전력과 물을 효율적으로 사용하며, IoT 센서를 사용하여 의료 및 기타 서비스를 위한 데이터를 수집할 계획입니다.
- 또한 건물 관리 시스템의 주요 임무는 에너지 효율을 최적화하고 거주자의 편안함을 유지하기 위해 건물의 능동적 및 수동적 전략을 제어하는 것입니다. 그러나 이러한 시스템의 대부분은 미리 정의된 구성을 사용하며 일반적으로 거주자의 선호도와 일치하지 않습니다. 따라서 점유 추적은 주로 주거용 및 산업용 건물의 에너지 사용 관리에 필수적입니다.
- 2022년 10월에 실시된 조사에 따르면, 가동률 기술 기업 Occuspace의 고객 중 85%가 물리적 공간의 사용량을 측정하기 위해 데이터를 사용하고 있다고 보고했습니다. 또한, 밴더빌트 대학교는 Waitz 앱을 사용하여 식당과 도서관의 혼잡한 시간을 탐색하는 학생들로부터 압도적으로 긍정적인 반응을 얻었다고 보고했습니다. 밴더빌트 외에도 최근 퍼듀대학교, 컬럼비아대학교, 캘리포니아대학교 로스앤젤레스 캠퍼스(UCLA) 등이 Occuspace 기술을 도입했습니다.
- 팬데믹으로 인해 단기적으로 점유 추적에 대한 관심과 투자가 급증했지만, 이 기술의 필요성은 앞으로도 계속될 것이라는 지적도 있습니다. 건강한 공간에 대한 인식을 높이고 향후 유행병으로부터 보호하기 위한 규제와 가이드라인 중 일부는 어떤 형태로든 지속될 것으로 보입니다. 또한, 재택근무로의 전환과 팬데믹으로 인한 재정적 역풍으로 인해 기업들은 물리적 사무실 공간의 필요성에 의문을 제기하고 있습니다. 미국 상업용 부동산 서비스(US Commercial Real Estate Services)는 COVID-19 사태 이전부터 미국 내 미사용 상업용 부동산의 가치가 약 1조 달러에 달한다고 추정했습니다.
점유 추적 시장 동향
오피스텔 면적 증가가 건물 유형 부문의 성장을 견인
- 점유 추적 센서는 리셉션 구역, 회의실, 매장 층, 사무실 건물 전체에 설치됩니다. 점유 추적 시스템은 공간이 어떻게 사용되고 있는지에 대한 귀중한 인사이트를 제공합니다. 이러한 인사이트를 통해 공간, 직원 및 자원 배분에 대한 더 나은 의사결정을 내릴 수 있어 기업의 효율적이고 안전한 경영에 기여합니다.
- 또한, 이러한 센서는 사무실에 여러 전략적 위치에 설치하여 유동인구가 많은 곳의 움직임을 감지하여 공간 활용도, 회의실 효율성, 책상 배치 등을 효율적으로 관리하기 위해 사무실에 사용되고 있습니다.
- 많은 실내 센서 제조업체들이 사용자 경험을 개선하기 위해 전략적 제휴를 적극적으로 추진하고 있으며, 2022년 1월 스웨덴에 본사를 둔 세계 IoT 솔루션 제공업체인 Sensative와 IoT용 저전력 광역 네트워크 연결 솔루션 제공업체인 Actility는 WMW와의 협력과 함께 IoT를 위한 현저하게 저전력 네트워크 연결 솔루션 제공업체인 Actility는 WMW와의 협력과 함께 IoT를 위한 저전력 네트워크 연결 솔루션 제공업체인 Sensative와 협력 관계를 맺었습니다. 전자는 이번 협력을 통해 통합형 LoRaWAN 지원 IoT 데스크 운영 모니터링 솔루션을 발표했습니다. 이 솔루션은 책상 모니터링을 위해 능동형 적외선 센서를 채택했습니다.
- 각 지역의 사무실 공간 확대는 점유 추적 솔루션에 대한 수요를 더욱 증가시킬 수 있습니다. 영국 통계청에 따르면, 2023년 1분기 신규 오피스 빌딩 건설 수주액은 공공 및 민간 사무실을 합해 26억 달러를 넘어섰다고 합니다.
- 또한, Colliers International에 따르면, 2022년 2분기 북동부 지역은 미국에서 가장 많은 사무실 공간이 건설 중이라고 합니다. 북동부 지역에는 약 3,000만 평방피트의 사무실 공간이 건설 중이었습니다.
- COVID-19 이후 많은 포춘지 선정 100대 기업이 하이브리드 근무 모델을 채택하여 다양한 산업 분야에서 보편화되었습니다. 그러나 2023년 3월 현재, 아마존과 애플과 같은 거대 IT 기업들은 직원들에게 주 3회 출근을 의무화하는 방침을 발표했습니다. 이는 사무실로의 대규모 복귀를 촉진할 것으로 예상되었습니다. 이러한 역동적인 변화로 인해 사무실 가동률은 매주 변동하고, 핫 데스크 시스템을 도입한 직장의 경우 책상 가동률이 매일 변동하는 경우도 있습니다. 이러한 사례는 사무실 공간의 점유 추적에 대한 수요를 더욱 증가시킬 수 있습니다.
아시아태평양이 큰 폭의 시장 성장세를 기록할 것
- IBEF에 따르면, 아시아태평양의 건설 활동이 활발해짐에 따라 점유 추적 솔루션은 예측 기간 동안 크게 성장할 것으로 예상되며, 두바이 정부와 인도는 최근 잠무 카슈미르 주에 산업단지, IT 타워, 다목적 타워, 물류센터, 의과대학, 전문병원 등의 인프라 건설 계약을 체결한 바 있습니다. 대학, 전문병원 등의 인프라 건설 계약을 체결했습니다.
- 또 중국 국가통계국에 따르면 최근 중국의 호텔 기업 수는 2만 7,700여 개로 전년 대비 2,500여 개가 증가했습니다. 중국의 대형 호텔 그룹의 수는 지난 3 년 동안 매우 증가했습니다. 이러한 호텔과 레스토랑의 개척은 조사 대상 시장의 수요를 더 많이 창출할 수 있습니다.
- 이 지역에는 세계 에너지 소비국의 대부분을 차지하는 인도와 중국 등 중요한 국가들이 포함되어 있으며, BP plc에 따르면 중국은 세계 최대의 1차 에너지 소비국입니다. 중국의 1차 에너지 소비량은 최근 약 157.7 엑사줄에 달해 전년 대비 7% 가까이 증가했습니다.
- 또한, 한국 정부의 국토교통부는 2,500만 달러 규모의 국가 프로젝트를 통해 2022년까지 64개 중소 도시에 스마트 시티 플랫폼을 개발하겠다는 구상을 발표했습니다. 세계 다른 지역에서도 비슷한 성과가 나타나고 있으며, 점유 추적 센서에 대한 수요가 증가하고 있습니다.
- 스마트 시티 미션 규정에 따르면, 중앙정부는 이 미션의 실행을 지원하기 위해 5년간 4,800억 루피(각 도시당 연간 평균 10억 루피)의 자금을 지원하기로 했습니다.
- 또한 일본 국토교통성의 발표에 따르면 2022년 일본 숙박시설의 객실 점유율은 46.5%를 기록했습니다. 이 수치는 전년보다 회복되었지만 COVID-19의 영향을 크게 받아 34.3%를 기록했습니다. 또한, 남서부 도시 뭄바이의 점유율은 인도에서 가장 높은 60%로, 2022년에는 수도 뉴델리가 그 뒤를 이을 것으로 예상됩니다. 이러한 움직임은 호텔 공간과 고객을 적절히 모니터링하기 위한 점유 추적 시스템에 대한 수요를 더욱 촉진할 수 있습니다.
점유 추적 산업 개요
점유 추적 시장은 경쟁이 치열하며, 여러 대기업들이 시장에서의 성과를 높이고 제품 다각화에 집중하여 시장 점유율을 확대하기 위해 노력하고 있습니다. 기업들은 신제품 개발, 파트너십, 합병, 추가 등 여러 전략을 통해 제품 포트폴리오를 강화하고 다른 기업보다 경쟁력을 확보하기 위해 노력하고 있습니다.
2023년 1월, 오토테크 솔루션 혁신 기업인 인디세미컨덕터는 컴퓨터 비전 기술 선도 기업 중 하나인 Seeing Machines와의 제휴를 통해 운전자 및 탑승자 모니터링을 위한 첨단 비전 프로세서 개발을 보완하기 위해 제휴를 발표했습니다.
2022년 11월, 가동률 기술 기업 Occuspace는 미국과 캐나다의 여러 대학에 진출하여 Waitz 모바일 앱을 사용하는 사람들에게 캠퍼스 내 건물의 실시간 및 과거 공간 사용 데이터를 보고하고 있다고 발표했습니다.
2022년 8월, 시카고에 본사를 두고 시카고, 디트로이트, 오스틴에 지사를 두고 있는 마케팅 혁신 기업 Fusion92는 가동률 모니터링 기술 기업 Occuspace와 파트너십을 맺고 혁신적인 분석 솔루션을 제공하기로 했습니다.
기타 혜택
- 엑셀 형식의 시장 예측(ME) 시트
- 3개월간의 애널리스트 지원
목차
제1장 서론
- 조사 가정과 시장 정의
- 조사 범위
제2장 조사 방법
제3장 주요 요약
제4장 시장 인사이트
- 시장 개요
- 업계의 매력 - Porter's Five Forces 분석
- 공급 기업의 교섭력
- 구매자의 교섭력
- 신규 참여업체의 위협
- 대체품의 위협
- 경쟁 기업 간의 경쟁 관계
- 업계 밸류체인 분석
- COVID-19의 시장에 대한 영향 평가
제5장 시장 역학
- 시장 성장 촉진요인
- 건물의 공간 이용과 최적화 요구 상승
- 에너지 효율적 디바이스에 대한 수요 증가
- 시장 과제
- 점유 추적의 이점에 관한 인식 부족
제6장 시장 세분화
- 제공 유형별
- 하드웨어
- 소프트웨어
- 서비스
- 빌딩 유형별
- 오피스
- 점포
- 교육기관
- 헬스케어
- 호텔·레스토랑
- 공적 기관/회의장
- 창고
- 수송기관
- 지역별
- 북미
- 유럽
- 아시아태평양
- 라틴아메리카
- 중동 및 아프리카
제7장 경쟁 상황
- 기업 개요
- Honeywell International
- Eaton Corporation
- Schneider Electric
- Legrand Inc.
- Leviton Manufacturing Company
- Philips Ltd
- Hubbell Building Automation Inc.
- Johnson Controls GmbH
- Lutron Electronics, Inc.
- General Electric
- Acuity Brands
제8장 투자 분석
제9장 시장 전망
KSM 24.03.07The Occupancy Tracking Market size is estimated at USD 1.21 billion in 2024, and is expected to reach USD 4.43 billion by 2029, growing at a CAGR of 29.80% during the forecast period (2024-2029).

The increasing need to monitor actual space usage and target reduction efforts to lower energy consumption as well as meet decarbonization and sustainability goals by various building owners drove market growth in the forecast period.
Key Highlights
- The occupancy tracking technologies help businesses meet their ongoing goals of using only suitable building space to keep costs low and operate efficiently. Occupancy monitoring sensors are essential for anyone wanting to manage their buildings smartly and more efficiently.
- Many associations waste as much as half their space. In other words, their preservation potential is vast. According to a World Green Building Study, European businesses could save USD 243 billion by reducing wasted space in office buildings. In addition, businesses globally could realize savings of up to USD 1.5 trillion if workspaces were optimized. Other sources suggest that, on average, desks and offices sit unused about two-thirds of the time in North America. And a Herman Miller space utilization study found that, on average, assigned private offices are unoccupied 77% of the workday.
- The rising demand for energy-efficient devices will drive the studied market's growth. Occupancy tracking plays a vital role in reducing energy consumption. This is achieved through the occupancy sensors, which shut down devices and other equipment based on occupancy. These help reduce light pollution and can be used in indoor and outdoor spaces. For instance, in the US, lighting accounts for 11% of a building's overall energy use, with HVAC systems consuming 35%. US commercial buildings account for around 36% of all electricity use. This energy use is often considered an unavoidable expense. However, much of this energy is wasted every day. Countless businesses pay to heat, cool, and illuminate unoccupied rooms.
- The growing investment in developing smart houses, enterprise buildings, factories, and cities will drive the market forward in the forecasted period. As part of the Digital India initiative, the Indian government has planned to push IoT in the country. The government allocated an INR 7,000 crore fund to develop 100 smart cities powered by IoT appliances to control traffic, efficiently use power and water, and collect data using IoT sensors for healthcare and other services.
- Furthermore, the primary task of building management systems is to control active and passive strategies in buildings to optimize energy efficiency and maintain occupant comfort. However, most of these systems use a predefined configuration, which usually does not match the occupants preferences. Thus, occupancy tracking is imperative for energy use management, mainly in residential and industrial buildings.
- In a survey done in October 2022, 85% of customers of an occupancy technology company, Occuspace, reported using the data to gauge the use of their physical spaces. Further, Vanderbilt University reported an overwhelmingly positive response from students using the Waitz app to navigate busy times in the dining halls and libraries. In addition to Vanderbilt, Occuspace technology has recently been installed at Purdue, Columbia, UCLA, and several others.
- Although the pandemic drove a flurry of interest and investments in occupancy tracking in the near term, there were indications that the need for the technology would remain. Some of the regulations and guidelines are likely to endure in some form, as they have raised awareness about healthy spaces and safeguarded against future pandemics. Moreover, the shift to working from home and pandemic-driven financial headwinds have companies questioning the need for physical office space. Even before the pandemic, U.S. Commercial Real Estate Services estimated unused commercial property in the U.S. to be worth about USD 1 trillion.
Occupancy Tracking Market Trends
Increase in Office Building Space to Drive the Building Type Segment
- Occupancy tracking sensors are deployed in reception areas, meeting rooms, shop floors, or an entire office complex. Occupancy tracking systems provide valuable insight into how spaces are used. This insight enables better decision-making regarding the distribution of space, staff, and resources, helping companies run more efficiently and safely.
- In addition, these sensors are used in offices to efficiently manage space utilization, meeting room efficiency, and desk hoteling, among many others, by installing them in multiple strategic locations to detect motion in high-traffic areas.
- Many occupancy sensor manufacturers are actively pursuing strategic alliances to improve the user experience. In January 2022, Sensative, a Sweden-based global IoT solutions provider, and Actility, a significantly low-power wide area network connectivity solutions provider for IoTs, entered into a collaborative relationship. Along with joint work with WMW. The former has launched an integrated LoRaWAN-enabled IoT desk occupancy monitoring solution through this collaboration. To monitor desks, this solution employs an active infrared sensor.
- Increasing office space across regions may further propel the demand for occupancy tracking solutions in the market. According to the Office for National Statistics (UK), the value of new office building construction orders in the first quarter of 2023 was over USD 2.6 billion for both public and private offices combined.
- In addition, according to Colliers International, in the second quarter of 2022, the Northeast region held the most office space under construction in the United States. There were around 30 million square feet of office space under construction in the Northeast region.
- In the post-COVID-19 era, many Fortune 100 companies adopted the hybrid work model, which became commonplace across different industries. But as of March 2023, tech giants like Amazon and Apple have announced policies that require their employees to come into the office three times a week. This was an expected push for a great return to the office. Due to such dynamic changes, office occupancy rates fluctuated every week, while in those workplaces with a hot desk system, desk occupancy rates may even change daily. Such cases may further create demand for occupancy tracking in office areas.
Asia-Pacific to Experience Significant Market Growth
- Asia-Pacific is expected to have significant growth in occupancy tracking solutions during the forecast period due to the increased construction activity in the region. According to IBEF, the Dubai government and India recently signed a contract to construct infrastructure in Jammu and Kashmir, including industrial parks, IT towers, multipurpose towers, logistics centers, medical colleges, and specialized hospitals.
- Additionally, according to the National Bureau of Statistics of China, recently there were over 27,700 hotel enterprises in China, which was a boost of nearly 2,500 enterprises compared to the previous year. The number of large hotel groups in China has grown immensely in the past three years. Such developments in hotels and restaurants may further create demand in the studied market.
- The region includes significant countries such as India and China, which have the majority of energy-consuming countries worldwide. According to BP plc, China is the world's largest consumer of primary energy. The primary energy consumption of China amounted to some 157.7 exajoules recently, an increase of nearly 7% compared to the previous year.
- Furthermore, the Ministry of Land, Infrastructure, and Transport of the South Korean government announced its initiative to develop smart city platforms across 64 selected medium- and small-sized cities by 2022 through a state project worth USD 25 million. Similar outcomes being deployed in other parts of the world are increasing the demand for the occupancy tracking sensor.
- According to the smart city mission rules, the Central Government is expected to contribute INR 48,000 crore in funding over five years to assist the mission's implementation, or an average of INR 100 crore per year for each city.
- Moreover, in 2022, the room occupancy rate of accommodation facilities in Japan amounted to 46.5%, as per MLIT (Japan). The figure recovered compared to the previous years but was strongly impacted by the COVID-19 pandemic, which was recorded at 34.3%. Further, the southwestern city of Mumbai had the highest occupancy rate of about 60% in India, followed by the capital city of New Delhi in 2022. Such developments may further drive the demand for occupancy tracking systems to properly monitor hotel space and customers.
Occupancy Tracking Industry Overview
The occupancy tracking market is significantly competitive, with several major players performing in the market and taking steps to expand their market footprint by focusing on product diversification. The players strengthen their product portfolio by adopting several strategies, including new product developments, partnerships, mergers, additions, etc., to gain a competitive edge over other players.
In January 2023, indie Semiconductor, an Autotech solutions innovator, announced a partnership with Seeing Machines, one of the leading computer vision technology companies, to complement the development of advanced vision processors for driver and vehicle occupant monitoring.
In November 2022, Occupancy technology company Occuspace announced its expansion into several colleges and universities in the U.S. and Canada to report real-time and historical space usage data for campus buildings to anyone using their Waitz mobile app, which was especially useful to students seeking places to study.
In August 2022, Fusion92, a Chicago-based marketing innovation firm with offices in Chicago, Detroit, and Austin, partnered with Occuspace, a significant occupancy monitoring technology firm, to provide innovative analytics solutions that assist retailers in better understanding foot traffic data, closing the media attribution loop, uncovering new brick-and-mortar insights, and improving the customer experience.
Additional Benefits:
- The market estimate (ME) sheet in Excel format
- 3 months of analyst support
TABLE OF CONTENTS
1 INTRODUCTION
- 1.1 Study Assumptions and Market Definition
- 1.2 Scope of the Study
2 RESEARCH METHODOLOGY
3 EXECUTIVE SUMMARY
4 MARKET INSIGHTS
- 4.1 Market Overview
- 4.2 Industry Attractiveness - Porter's Five Forces Analysis
- 4.2.1 Bargaining Power of Suppliers
- 4.2.2 Bargaining Power of Buyers
- 4.2.3 Threat of New Entrants
- 4.2.4 Threat of Substitutes
- 4.2.5 Intensity of Competitive Rivalry
- 4.3 Industry Value Chain Analysis
- 4.4 Assessment of Impact of COVID-19 on the Market
5 MARKET DYNAMICS
- 5.1 Market Drivers
- 5.1.1 Increasing Need for Space Utilization and Optimization in Buildings
- 5.1.2 Rising Demand for Energy-efficient Devices
- 5.2 Market Challenges
- 5.2.1 Lack of Awareness Regarding the Benefits of Occupancy Tracking
6 MARKET SEGMENTATION
- 6.1 By Offering Type
- 6.1.1 Hardware
- 6.1.2 Software
- 6.1.3 Services
- 6.2 By Building Types
- 6.2.1 Office
- 6.2.2 Retail
- 6.2.3 Education
- 6.2.4 Healthcare
- 6.2.5 Hotels& Restaurants
- 6.2.6 Institutional/Assembly
- 6.2.7 Warehouse
- 6.2.8 Transport
- 6.3 By Geography
- 6.3.1 North America
- 6.3.2 Europe
- 6.3.3 Asia-Pacific
- 6.3.4 Latin America
- 6.3.5 Middle East and Africa
7 COMPETITIVE LANDSCAPE
- 7.1 Company Profiles
- 7.1.1 Honeywell International
- 7.1.2 Eaton Corporation
- 7.1.3 Schneider Electric
- 7.1.4 Legrand Inc.
- 7.1.5 Leviton Manufacturing Company
- 7.1.6 Philips Ltd
- 7.1.7 Hubbell Building Automation Inc.
- 7.1.8 Johnson Controls GmbH
- 7.1.9 Lutron Electronics, Inc.
- 7.1.10 General Electric
- 7.1.11 Acuity Brands