|
시장보고서
상품코드
1433807
세계 플렉시블 유리 시장 : 점유율 분석, 산업 동향, 성장 예측(2024년-2029년)Flexible Glass - Market Share Analysis, Industry Trends & Statistics, Growth Forecasts (2024 - 2029) |
||||||
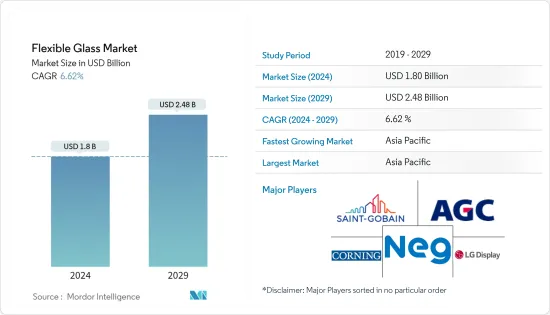
플렉시블 유리 시장 규모는 2024년에 18억 달러로 추정되고, 2029년에는 24억 8,000만 달러에 이를 것으로 예측되며, 예측 기간 중(2024-2029년) 복합 연간 성장률(CAGR) 6.62%로 성장할 전망입니다.
COVID-19 팬데믹은 플렉시블 유리 시장에 부정적인 영향을 미쳤습니다. 그러나 경량, 박형, 견고, 휴대용 전자제품 등 다양한 용도에서의 소비 증가로 2021년에는 시장이 크게 회복되었습니다.
주요 하이라이트
- 전기 및 전자산업과 소비재산업에서 플렉시블 유리 수요 증가와 원재료 비용의 저하가 예측기간 중 시장을 견인할 것으로 예상됩니다.
- 생산의 복잡성, 환경 문제, 실리카 가스로 인한 건강 문제는 중기 시장 성장을 방해할 것으로 보입니다.
- 태양전지판, 자동차 및 방위 분야에서 플렉시블 유리의 사용 증가는 제조업체에 광범위한 기회를 제공할 것으로 예상됩니다.
- 아시아태평양은 가장 큰 시장으로, 중국, 인도, 일본 등 국가에서의 소비 증가로 예측 기간 동안 가장 빠르게 성장하는 시장이 될 것으로 예상됩니다.
플렉시블 유리 시장 동향
태양전지판 수요 증가
- 유리는 저비용, 경량, 내열성, 내수성, 내상성 등의 장점에 의해 사용되고 있습니다. 주요 최종 사용자 산업에는 전기, 전자, 자동차, 광전자 등이 있습니다.
- 태양전지판의 제조는 플렉시블 유리를 위한 두 번째로 큰 적용 분야입니다. 일본과 중국과 같은 신흥 경제국가 수요는 미국과 프랑스와 같은 선진국 수요보다 훨씬 높습니다.
- 태양에너지 산업에서는 설계의 유연성을 높이고 초박형 유리를 제공하기 위해 경량이고 흠집이없는 재료에 대한 수요가 높아지고 있으며, 이것이 플렉시블 유리 시장의 성장의 주요 요인이되었습니다.
- 또한 태양전지판의 성장을 뒷받침하는 요인 중 하나는 이산화탄소 배출량을 줄이기 위해 재생 가능 에너지에 대한 투자가 세계적으로 증가하고 있다는 것입니다.
- 미국 농무부(USDA)의 2023년도 예산에서는 지방 전력 대출 65억 달러에 더하여 지방 전력 사업자의 재생 가능 에너지로의 전환을 지원하기 위해 3억 달러가 할당되었습니다.
- 2022년 12월, 캘리포니아주 유틸리티위원회는 2023년 4월에 시행되고 최종적으로 수출된 태양광 에너지를 소매가격보다 약 75% 저렴한 가격으로 상환하는 새로운 넷미터링 규정을 승인 했습니다. 기존의 생각과는 대조적으로, 정해진 요금은 없고, 경과 조치 기간도 마련되고 있습니다.
- 미국 국립재생가능에너지연구소(NREL)에 따르면 16개 주에서 태양광발전으로 인한 발전량이 5%를 넘었고 캘리포니아 주가 27.3%로 1위를 차지했습니다. 미국도 2022년 17.0기가와트(GWac)(20.2GWdc)의 PV(태양광 발전)를 설치했으며, 누적 PV 설치량은 110.1GWac(140.6GWdc)로 올해를 마쳤습니다.
- 프랑스 정부는 "프랑스 2030 국가 투자 계획"의 일환으로 재생 가능 에너지를 추진하기 위해 10 억 유로(- 11 억 3,000만 달러)를 투자합니다. 최종 목표는 2050년까지 재생 가능 에너지를 10배, 최대 100GW 도입하는 것입니다. 총 설비 용량 중 40GW는 해상 풍력 발전 프로젝트에 의한 것입니다.
- 위와 같은 요인으로 인해 플렉시블 유리에 대한 수요가 예측 기간 동안 증가할 것으로 예상됩니다.
아시아태평양이 시장을 독점
- 중국, 한국, 일본 등 국가에서 태양 전지판과 태양전지 제조에 대한 수요가 증가하고 있기 때문에 예측 기간 동안 아시아태평양이 플렉시블 유리 시장을 독점할 것으로 예상됩니다.
- 세계는 2025년까지 태양전지판 생산의 주요 구성 요소공급을 거의 완전히 중국에 의존하게 될 것입니다.
- 중국 국가 에너지국이 1월 하순에 발표한 정보에 따르면 중국의 2022년 설치량은 87기가와트(GW)로 전년대비 59% 증가했습니다.
- 국립재생가능에너지연구소(NREL)에 따르면 중국은 2022년 87GW의 태양광 발전을 설치해 전년 대비 59% 증가했습니다. 또한 인도에서는 2022년 첫 9개월 동안 PV 설치량이 51% 증가했습니다.
- 인도에서는 대규모 계통 연계 태양광 발전 프로젝트를 지원하기 위해 2024년 3월까지 40GW를 목표 용량으로 하는 '솔러 파크와 초거대 태양광 발전 프로젝트 개발' 계획이 실시되고 있습니다. 2022년 1월부터 10월까지 다양한 태양광 공원에서 832MW 태양광 발전 프로젝트가 시작될 예정입니다.
- 일본은 최근, 재생 가능 에너지에 의한 전력 생산을 대폭 증가시켜, 재생 가능 에너지 설비 용량으로 톱 클래스의 나라가 되고 있습니다. 일본 정부는 새로운 전략적 에너지 계획 하에서 재생 가능 에너지의 비율을 2030년까지 38%로 끌어올리겠다는 목표를 내걸었습니다. 또한 2050년까지 완전한 탄소 중립을 목표로 하고 있습니다.
- 따라서 위의 요인과 정부의 지원은 예측 기간 동안 아시아태평양에서 플렉시블 유리 시장 수요 증가에 기여합니다.
기타 혜택:
- 엑셀 형식 시장 예측(ME) 시트
- 3개월간의 애널리스트 서포트
목차
제1장 서론
- 조사의 성과
- 조사의 전제
- 조사 범위
제2장 조사 방법
제3장 주요 요약
제4장 시장 역학
- 성장 촉진요인
- 전기 및 전자 산업 및 소비재 산업에서의 수요 증가
- 원재료 비용 저하
- 기타 촉진요인
- 억제요인
- 제조의 복잡성
- 실리카 흄에 의한 환경에 대한 우려와 건강 문제
- 기타 억제요인
- 밸류체인/서플라이체인 분석
- Porter's Five Forces 분석
- 공급기업의 협상력
- 소비자의 협상력
- 신규 참가업체의 위협
- 대체품의 위협
- 경쟁도
제5장 시장 세분화(금액 베이스 시장 규모)
- 신청
- 디스플레이
- 태양전지판
- PV전지
- 기타
- 최종 사용자 산업
- 전기 및 전자
- 자동차
- 의료
- 웨어러블 디바이스
- 기타
- 지역
- 아시아태평양
- 중국
- 인도
- 일본
- 한국
- 기타 아시아태평양
- 북미
- 미국
- 캐나다
- 멕시코
- 유럽
- 독일
- 영국
- 프랑스
- 이탈리아
- 기타 유럽
- 남미
- 브라질
- 아르헨티나
- 기타 남미
- 중동 및 아프리카
- 사우디아라비아
- 남아프리카
- 기타 중동 및 아프리카
- 아시아태평양
제6장 경쟁 구도
- M&A, 합작사업, 제휴, 협정
- 시장 점유율 분석(%)**/랭킹 분석
- 주요 기업의 전략
- 기업 프로파일
- Abrisa Technologies
- AGC Inc.
- Corning Incorporated
- DuPont
- Kent Displays, Inc.
- KYOCERA Corporation
- LGDISPLAY CO., LTD
- Murata Manufacturing Co., Ltd
- Nippon Electric Glass Co. Ltd
- Saint-Gobain
- SCHOTT AG
- UNIVERSAL DISPLAY
제7장 시장 기회와 앞으로의 동향
BJH 24.03.05The Flexible Glass Market size is estimated at USD 1.8 billion in 2024, and is expected to reach USD 2.48 billion by 2029, growing at a CAGR of 6.62% during the forecast period (2024-2029).

The COVID-19 pandemic negatively impacted the flexible glass market. However, the market recovered significantly in 2021, owing to rising consumption from various applications such as producing lightweight, thin, robust, and portable electronics.
Key Highlights
- Increasing demand for flexible glass from electrical and electronics and consumer goods industries and lower cost of raw materials is expected to drive the market during the forecast period.
- High production complexity, environmental concerns, and health issues due to silica fumes will likely hinder market growth over the medium term.
- Increasing usage of flexible glass in solar panels, automotive, and defense sectors is expected to provide wide opportunities for manufacturers.
- Asia-Pacific represents the largest market and is expected to be the fastest-growing market over the forecast period, owing to the increasing consumption from countries such as China, India, and Japan.
Flexible Glass Market Trends
Increasing Demand for Solar Panels
- Glass is used owing to its advantages, such as low cost, less weight, heat, water resistance, scratch-resistant, etc. Some major end-user industries include electrical and electronics, automotive, Opto-electronics, etc.
- Manufacturing of solar panels is the second-largest application segment for flexible glass. The demand from thriving economies like Japan and China is much higher than that from developed countries like the United States and France.
- Growing demand for lightweight and scratch-free materials in the solar energy industry to provide increased design flexibility and ultra-slim glass is primarily responsible for the growth of the flexible glass market.
- In addition, one of the boosting factors for these solar panels is the increasing investment in a renewable energy source to reduce carbon emissions worldwide.
- In addition to USD 6.5 billion for loans for rural power, the 2023 budget of the US Department of Agriculture (USDA) allocated USD 300 million to help rural electricity providers switch to renewable energy sources.
- In December 2022, the California Public Utilities Commission approved new net metering regulations that will go into effect in April 2023 and eventually reimburse exported solar energy at prices approximately 75% less than retail. In contrast to the prior idea, there are no set fees and a transitional period.
- According to National Renewable Energy Laboratory (NREL), 16 states generated more than 5% of their electricity from solar, with California leading the way at 27.3%. The United States also installed 17.0 gigawatts of alternating current (GWac) (20.2 GWdc) of PV (photovoltaic) in 2022, ending the year with 110.1 GWac (140.6 GWdc) of cumulative PV installations.
- The French government will invest EUR 1 billion (~USD 1.13 billion) in initiatives to advance renewable energy as part of the France 2030 National Investment Plan. The ultimate goal is to install ten times as much renewable energy by 2050, or up to 100 GW. 40 GW of total installed capacity will come from offshore wind projects.
- All the factors above are anticipated to increase the demand for flexible glass through the forecast period.
Asia-Pacific to Dominate the Market
- Asia-Pacific is expected to dominate the flexible glass market during the forecast period due to the increasing demand for solar panels and voltaic cell manufacturing in countries such as China, South Korea, and Japan.
- The world will almost completely rely on China to supply key building blocks for solar panel production through 2025.
- According to information released by the National Energy Administration of China in late January, China installed 87 gigawatts (GW) in 2022, up 59% year over year (y/y).
- According to National Renewable Energy Laboratory (NREL), China installed 87 GW of solar in 2022, a 59% increase from the previous year. Furthermore, PV installations in India increased by 51% during the first nine months of 2022
- In India, a "Development of Solar Parks and Ultra Mega Solar Power Projects" plan is being implemented with a goal capacity of 40 GW by March 2024 to support big-scale grid-connected solar power projects. Solar projects capacity of 832 MW will be commissioned in various Solar Parks from January to October 2022.
- Japan substantially increased its electricity production from renewable energy sources in recent years, making it one of the top nations in installed renewable energy capacity. The Japanese government raised its objective for the proportion of renewable energy to 38% by 2030 under the new Strategic Energy Plan. Additionally, by 2050, the nation wants to be completely carbon neutral.
- Therefore, the abovementioned factors and government support contribute to the increasing demand for the flexible glass market in Asia-Pacific during the forecast period.
Flexible Glass Industry Overview
The flexible glass market is consolidated in nature. The major players (not in any particular order) include Saint-Gobain, AGC Inc., Corning Incorporated, LG DISPLAY CO., LTD., and Nippon Electric Glass Co. Ltd, among others.
Additional Benefits:
- The market estimate (ME) sheet in Excel format
- 3 months of analyst support
TABLE OF CONTENTS
1 INTRODUCTION
- 1.1 Study Deliverables
- 1.2 Study Assumptions
- 1.3 Scope of the Study
2 RESEARCH METHODOLOGY
3 EXECUTIVE SUMMARY
4 MARKET DYNAMICS
- 4.1 Drivers
- 4.1.1 Increasing Demand From Electrical and Electronics and Consumer Goods Industries
- 4.1.2 Lower Cost of Raw Material
- 4.1.3 Other Drivers
- 4.2 Restraints
- 4.2.1 High Production Complexity
- 4.2.2 Environmental Concerns and Health Issues due to Silica Fumes
- 4.2.3 Other Restraints
- 4.3 Value Chain / Supply Chain Analysis
- 4.4 Porter's Five Forces Analysis
- 4.4.1 Bargaining Power of Suppliers
- 4.4.2 Bargaining Power of Consumers
- 4.4.3 Threat of New Entrants
- 4.4.4 Threat of Substitute Products and Services
- 4.4.5 Degree of Competition
5 MARKET SEGMENTATION (Market Size in Value)
- 5.1 Application
- 5.1.1 Display
- 5.1.2 Solar Panel
- 5.1.3 Photovoltaic Cell
- 5.1.4 Other Applications
- 5.2 End-user Industry
- 5.2.1 Electrical and Electronics
- 5.2.2 Automotive
- 5.2.3 Medical
- 5.2.4 Wearable Devices
- 5.2.5 Other End-user Industries
- 5.3 Geography
- 5.3.1 Asia-Pacific
- 5.3.1.1 China
- 5.3.1.2 India
- 5.3.1.3 Japan
- 5.3.1.4 South Korea
- 5.3.1.5 Rest of Asia-Pacific
- 5.3.2 North America
- 5.3.2.1 United States
- 5.3.2.2 Canada
- 5.3.2.3 Mexico
- 5.3.3 Europe
- 5.3.3.1 Germany
- 5.3.3.2 United Kingdom
- 5.3.3.3 France
- 5.3.3.4 Italy
- 5.3.3.5 Rest of Europe
- 5.3.4 South America
- 5.3.4.1 Brazil
- 5.3.4.2 Argentina
- 5.3.4.3 Rest of South America
- 5.3.5 Middle East & Africa
- 5.3.5.1 Saudi Arabia
- 5.3.5.2 South Africa
- 5.3.5.3 Rest of Middle East & Africa
- 5.3.1 Asia-Pacific
6 COMPETITIVE LANDSCAPE
- 6.1 Mergers and Acquisitions, Joint Ventures, Colaborations and Agreements
- 6.2 Market Share Analysis (%)**/Ranking Analysis
- 6.3 Strategies Adopted by Leading Players
- 6.4 Company Profiles
- 6.4.1 Abrisa Technologies
- 6.4.2 AGC Inc.
- 6.4.3 Corning Incorporated
- 6.4.4 DuPont
- 6.4.5 Kent Displays, Inc.
- 6.4.6 KYOCERA Corporation
- 6.4.7 LG DISPLAY CO., LTD
- 6.4.8 Murata Manufacturing Co., Ltd
- 6.4.9 Nippon Electric Glass Co. Ltd
- 6.4.10 Saint-Gobain
- 6.4.11 SCHOTT AG
- 6.4.12 UNIVERSAL DISPLAY
7 MARKET OPPORTUNITIES AND FUTURE TRENDS
- 7.1 Increasing Usage in Solar panels, Automotive, and Defense Sector
- 7.2 Other Opportunities