|
시장보고서
상품코드
1851873
레불린산 시장 : 시장 점유율 분석, 산업 동향, 통계, 성장 예측(2025-2030년)Levulinic Acid - Market Share Analysis, Industry Trends & Statistics, Growth Forecasts (2025 - 2030) |
||||||
레불린산 시장 규모는 2025년에 22.29킬로 톤으로 추계되고, 2030년에는 30.01킬로톤에 이를 것으로 예측되며, 예측 기간(2025-2030년) CAGR 6.13%로 성장할 전망입니다.

EU의 '지속가능성을 위한 화학물질 전략'과 미국 연방의 '지속가능한 화학물질 계획' 등 규제 프로그램이 밸류체인의 탈탄소화에 도움이 되는 바이오 베이스 중간체의 채용을 제조업체에 육박하는 가운데 수요가 확대되고 있습니다. 레불린산은 깨끗한 라벨의 선호도를 충족시키는 천연 유래 방부제 역할을 하기 때문에 화장품 및 퍼스널케어는 여전히 가장 큰 판매처입니다. 지속가능한 항공 연료를 위한 감마 발레로락톤 경로를 지원하는 화합물이기 때문에 연료 및 연료 첨가제 제조업체가 가장 빠르게 구매를 확대하고 있습니다. 산 가수분해 기술이 계속 설비 용량의 대부분을 차지하고 있지만, 단가의 삭감과 촉매의 불활성화의 문제를 완화하기 위해, 효소와 미생물에 의한 루트가 새로운 투자를 끌어들이고 있습니다. 아시아태평양은 풍부한 바이오매스, 지지 정책, 밀집된 화학 제조거점으로 생산량과 성장률 양면에서 리드를 유지하고 있지만, 이탈리아와 북미의 신규 프로젝트는 레불린산 시장 전체에서 생산 능력이 점차 강화되고 있음을 보여줍니다.
세계의 레불린산 시장 동향 및 인사이트
바이오 용매 및 가소제에 대한 수요 증가
프탈산계 가소제의 대체를 요구하는 규제의 압력이, 레불린산 에스테르를 폴리머 필름이나 경질 패키징에 밀어 올리고 있습니다. 최근의 시험에서는 종래의 시트르산계 가소제 대신에 레불린산 에스테르를 20wt% 사용했을 경우, 폴리유산의 파단 신도가 546%가 되어, 바이오 함유율을 높이면서 성능도 동등하게 되었습니다. EU의 화학 물질 전략은 바이오 가소제를 필수 용도 기준으로 우선적으로 사용하도록 규정하고 있으며 브랜드 소유자에게 레불린산 유도체를 지정하도록 촉구하고 있습니다. 확립된 촉매 공급업체는 에스테르화 에너지 수요를 20% 가까이 낮추고 석유 루트와의 가격 차이를 줄이고 있습니다. 소비재 제조업체는 2030년까지 바이오 원료의 투입량을 적어도 25%로 끌어올리는 것을 목표로 하고 있으며, 레불린산 시장 전체의 새로운 생산 능력 계약을 지원하는 전방 구매 헌신을 만들어 내고 있습니다.
저탄소 연료 첨가제로서의 레불린산 유도체 사용 확대
레불린산을 감마 발레로락톤으로 전환하면 지속가능한 항공연료(SAF)의 중간체가 제공되며, 통합 바이오리파이너리는 가솔린 환산 갤런당 3.15달러 부근의 손익분기 생산 비용에 도달할 가능성이 있습니다. 2024년에 개발된 촉매는 2-메틸테트라하이드로푸란의 수율 87.6%를 달성하여 옥탄가를 향상시키고, 라이프사이클의 탄소 강도를 저하시키는 혼합 성분입니다. 세계 바이오연료 소비량은 2023년 1억 700만 톤으로 증가했으며 투자액은 130억 달러를 넘어섰습니다. 한편 항공 이해관계자는 2070년까지 SAF의 35% 보급을 약속하여 레불린산 유도체의 장기 인수계약을 첨예화시켰습니다. 현재, 시험적인 효소 루트는 동일한 바이오매스 투입으로부터 전구체 수율이 10배 증가하는 것으로, 추가 비용 절감 가능성을 시사하고 있습니다.
높은 생산 비용 및 석유 대체물
레불린산은 바이오매스 수율이 겸손하고 하류 정화에 자본 집약적이기 때문에 기존의 석유화학 중간체보다 가격이 높습니다. 화학 부문의 회복이 약했고, 미국 생산량은 2024년에 불과 1.5%밖에 성장하지 않았기 때문에 바이오 프리미엄을 지불하는 구매자의 능력은 제한되어 있습니다. 고분자 및 솔벤트에서 레불린산 시장은 자산 감가상각을 마무리한 메가 스케일 크래커로 생산되는 원료와 경쟁하여 비용 격차를 확대합니다. 산 가수분해 플랜트의 촉매 얼룩은 유지 보수 비용과 다운타임을 증가시키고 마진을 침식합니다. 그 결과 일부 벌크 사용자는 2세대 프로세스가 더 낮은 변동 비용을 달성할 때까지 대체 계획을 연기하고 있습니다.
부문 분석
산 가수분해는 수십년에 걸친 상업적 경험과 70-80%의 이론 수율을 달성하는 Biofine 프로세스를 활용함으로써 2024년 레불린산 시장에서 54.65%의 점유율을 유지했습니다. 현재 공장의 대부분은 묽은 황산을 사용하여 셀룰로오스를 중간 설탕으로 전환시켜 레불린산을 생산합니다. 그러나 촉매의 부패와 후민의 폐기는 특히 원료의 수분이 변동하는 경우에는 이폭을 압박하는 경상적인 비용이 됩니다. 신흥 효소 및 미생물법은 바이오매스당 전구체 수율이 10배 높고 유틸리티 수요도 감소하기 때문에 CAGR은 6.81%로 성장할 전망입니다. 네덜란드와 캐나다의 신흥기업이 2025년 시리즈 B의 자금을 획득해 펄프 공장의 사이드 스트림에 접속하는 데모 장치의 규모를 확대하고 있습니다.
산 가수분해 기업은 체류 시간을 단축하고 후민의 축적을 억제하기 위해 인라인 분리를 갖춘 연속 흐름 반응기에 투자합니다. 한편, 옆의 촉매수소화장치는 사내 레불린산을 감마발레로락톤이나 2-메틸테트라히드로푸란으로 업그레이드하여 드롭인 연료첨가제 마진을 획득하고 있습니다. 효소 루트는 여전히 효소 비용과 안정성 장애물에 직면하고 있지만, 플랫폼 공급업체는 단백질 엔지니어링이 돌파된 후 효소 부하가 2자리 감소했다고 보고했습니다. 기술 믹스는 확립된 프로세스가 현재 생산량을 확보하는 반면, 생명공학의 혁신이 레불린산 시장의 다음 생산성을 도약하는 전환기를 반영합니다.
레불린산 시장 보고서는 생산 기술별(산 가수분해, 바이오파인 프로세스 등), 등급별(공업 등급, 의약품 등급, 식품 등급), 최종 사용자 산업별(화장품, 개인 관리, 의약품 등), 지역별(아시아태평양, 북미, 유럽, 남미, 중동, 아프리카)로 구분됩니다. 시장 예측은 수량(톤)으로 제공됩니다.
지역별 분석
아시아태평양은 2024년의 수량 점유율로 41.29%를 차지하였고, 2030년까지 CAGR 6.58%로 성장이 예측되며, 중국의 바이오매스 잉여와 국가의 탄소 중립 목표에 의해 지원되고 있습니다. 지방 보조금은 바이오케미컬 프로젝트 자본 지출의 최대 30%를 커버하고, 산동성과 광서 치완족 자치구에서의 신설 플랜트에 박차를 가하고 있습니다. 일본 목질 에탄올의 상업 생산 계획은 레불린산의 공동 생산을 지원하고, 구자라트 주를 중심으로 한 인도의 특수 화학제품 생산 능력의 확대는 강하에 새로운 견인력을 창출하고 있습니다. 지역 공급 압박은 가격 설정을 견조하게 유지하고 현지 투자자에게 수입 경로 단축을 촉구합니다.
북미는 연방 정부의 세액 공제와 대출 보증이 바이오리파이너리의 개수에 박차를 가하고 있어 성숙하면서도 기회가 풍부한 기반을 가지고 있습니다. 캐나다의 청정 연료 기준은 정유업자에게 저탄소 원료의 채용을 촉구하고, 레불린산 유래의 감마 발레로락톤의 계약을 뒷받침하고 있습니다. 멕시코 베라크루즈의 화학 산업 클러스터는 옥수수의 줄기를 적당한 원료로 주목하고 있지만 물류와 농지 잔류물 관리는 여전히 규모를 제한하고 있습니다. 생산자가 공정의 효율성을 높이고, 장기적인 바이오매스 인수를 확보함에 따라 시장은 한 자리수 중반의 성장을 보입니다.
유럽은 지속 가능한 화학물질에 대한 엄격한 법규제로 강력한 발판을 유지하고 있습니다. 이탈리아에서는 연산 1만 톤의 세계 최대 단일 레불린산 장치가 가동되어 공업적 실현 가능성을 실증하고 있습니다. EU의 Fit-for-55 패키지는 수송 연료와 플라스틱에 대한 수요를 가속화하고 Horizon Europe의 보조금은 비용면에서 아시아를 능가하는 것을 목표로 하는 촉매 연구에 자금을 제공합니다. 브라질 사탕수수 비가스와 남아프리카의 숲 잔여물은 충분한 원료를 공급하고 있지만, 투자 결정은 정치적 안정과 레불린산 시장을 위해 이러한 매장 자원을 이용하기 위한 인프라에 달려 있습니다.
기타 혜택 :
- 엑셀 형식 시장 예측(ME) 시트
- 3개월간의 애널리스트 서포트
목차
제1장 서론
- 조사의 전제조건 및 시장 정의
- 조사 범위
제2장 조사 방법
제3장 주요 요약
제4장 시장 상황
- 시장 개요
- 시장 성장 촉진요인
- 바이오 베이스 용제 및 가소제 수요 증가
- 파생 상품 이용 확대
- 화장품 및 퍼스널케어에서 천연 보존료로서의 채용 증가
- 기존 비료의 대체품으로서 이용 확대
- 펄프 및 제지 공장과의 순환 경제 파트너십
- 시장 성장 억제요인
- 높은 생산 비용 대 석유 대체품
- 한정된 상업 규모의 제조 능력
- 상용 반응기에서의 후민 빌드 업으로부터의 촉매 실활
- 밸류체인 분석
- Porter's Five Forces
- 공급기업의 협상력
- 구매자의 협상력
- 신규 참가업체의 위협
- 대체품의 위협
- 경쟁 정도
제5장 시장 규모 및 성장 예측
- 생산 기술별
- 산 가수분해
- 바이오파인 프로세스
- 촉매 수소화 루트
- 새로운 생명 공학 루트
- 등급별
- 공업용 등급
- 의약품 등급
- 식품 등급
- 최종 사용자 업계별
- 화장품 및 퍼스널케어
- 의약품
- 폴리머 및 가소제
- 연료 및 연료 첨가제
- 향료
- 기타 최종 사용자 업계(농업, 비료 등)
- 지역별
- 아시아태평양
- 중국
- 일본
- 인도
- 한국
- ASEAN 국가
- 기타 아시아태평양
- 북미
- 미국
- 캐나다
- 멕시코
- 유럽
- 독일
- 영국
- 프랑스
- 이탈리아
- 스페인
- 러시아
- 북유럽 국가
- 기타 유럽
- 남미
- 브라질
- 아르헨티나
- 기타 남미
- 중동 및 아프리카
- 사우디아라비아
- 남아프리카
- 기타 중동 및 아프리카
- 아시아태평양
제6장 경쟁 구도
- 시장 집중도
- 전략적 동향
- 시장 점유율(%) 및 랭킹 분석
- 기업 프로파일
- AK Scientific Inc.
- Avantium
- Biofine Technology, llc.
- GFBiochemicals
- GODAVARI BIOREFINERIES LTD.
- Hangzhou Aromalake Tech Co., Ltd.
- Hebei Yanuo Bioscience Group Co., Ltd
- LangFang Hawk Technology and Development Co,Ltd.
- Merck KGaA(Sigma-Aldrich)
- NXTLEVVEL Biochem
- Shandong Xinhua Pharma
- Thermo Fisher Scientific Inc.
- Tokyo Chemical Industry Co,. Ltd.
- Zibo Changlin Chemical Industry Co., Ltd.
제7장 시장 기회 및 향후 전망
AJY 25.11.26The Levulinic Acid Market size is estimated at 22.29 kilotons in 2025, and is expected to reach 30.01 kilotons by 2030, at a CAGR of 6.13% during the forecast period (2025-2030).
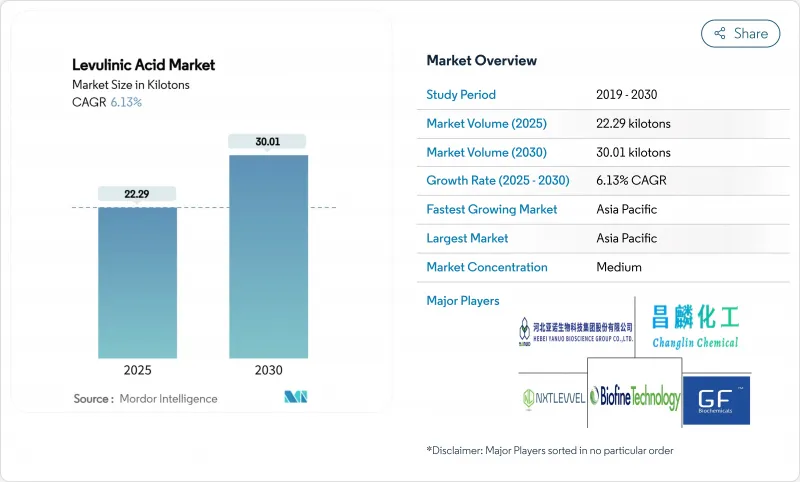
Demand grows as regulatory programs such as the EU Chemicals Strategy for Sustainability and the US Federal Sustainable Chemistry Plan press manufacturers to adopt bio-based intermediates that help decarbonize value chains. Cosmetics and personal care remain the largest outlet because levulinic acid serves as a naturally sourced preservative that satisfies clean-label preferences. Fuel and fuel-additive manufacturers are scaling purchases fastest as the compound underpins gamma-valerolactone pathways for sustainable aviation fuel. Acid hydrolysis technology continues to dominate installed capacity, yet enzymatic and microbial routes are attracting new investment to cut unit costs and ease catalyst deactivation issues. Asia-Pacific keeps its lead on both volume and growth thanks to abundant biomass, supportive policy, and a dense chemical manufacturing base, while new projects in Italy and North America signal gradual capacity consolidation across the levulinic acid market.
Global Levulinic Acid Market Trends and Insights
Rising Demand for Bio-Based Solvents and Plasticizers
Regulatory pressure to replace phthalate plasticizers is propelling levulinic acid esters into polymer films and rigid packaging. Recent trials achieved 546% elongation at break in polylactic acid when 20 wt% levulinic acid ester replaced traditional citrate plasticizers, matching performance while raising bio-conetent. The EU Chemicals Strategy frames bio-based plasticizers as preferred under essential-use criteria, encouraging brand owners to specify levulinic acid derivatives. Established catalyst suppliers have lowered esterification energy demand by almost 20%, narrowing the price gap with petro-routes. Consumer packaged goods firms aim to lift bio-sourced inputs to at least 25% by 2030, creating forward purchasing commitments that anchor new capacity agreements across the levulinic acid market.
Growing Use of Levulinic Acid Derivatives as Low-Carbon Fuel Additives
Conversion of levulinic acid into gamma-valerolactone provides an intermediate for sustainable aviation fuel (SAF) that can reach breakeven production costs near USD 3.15 per gasoline-equivalent gallon in integrated biorefineries. Catalysts developed in 2024 delivered 87.6% yield of 2-methyltetrahydrofuran, a blending component that upgrades octane and lowers lifecycle carbon intensity. Global biofuel consumption rose to 107 Mtoe in 2023 and investments topped USD 13 billion, while aviation stakeholders pledge 35% SAF penetration by 2070, sharpening long-term offtake agreements for levulinic acid derivatives. Pilot enzymatic routes now claim a tenfold increase in precursor yield from identical biomass inputs, signalling further cost reduction potential.
High Production Cost versus Petro-Substitutes
Levulinic acid remains pricier than incumbent petrochemical intermediates because biomass yields are modest and downstream purification is capital intensive. Weak chemical sector recovery-US output grew only 1.5% in 2024-limits the capacity of buyers to pay bio-premiums. In polymers and solvents the levulinic acid market competes with raw materials produced at megascale crackers that long ago depreciated assets, widening the cost gap. Catalyst fouling in acid hydrolysis plants adds maintenance expense and downtime that erode margins. As a result, some bulk users defer substitution plans until second-generation processes deliver lower variable costs.
Other drivers and restraints analyzed in the detailed report include:
- Increasing Adoption in Cosmetics and Personal Care as Natural Preservative
- Increasing Usage as a Substitute in Traditional Fertilizers
- Limited Commercial-Scale Manufacturing Capacity
For complete list of drivers and restraints, kindly check the Table Of Contents.
Segment Analysis
Acid hydrolysis retained 54.65% share of the levulinic acid market in 2024 by leveraging decades of commercial experience and the Biofine process that attains 70-80% theoretical yield. Most current plants use dilute sulfuric acid to convert cellulose into intermediate sugars and then levulinic acid, a route viewed as low risk by investors. However, catalyst decay and humin disposal impose recurring costs that pressure margins, especially when feedstock moisture fluctuates. Emerging enzymatic and microbial methods post a 6.81% CAGR as developers showcase tenfold higher precursor yields per unit biomass and reduced utility demand. Start-ups in the Netherlands and Canada secured Series B funding in 2025 to scale demo units that bolt onto pulp-mill side streams, signaling confidence in biotechnological cost-down potential for the levulinic acid market.
Acid hydrolysis players are investing in continuous-flow reactors equipped with inline separation to cut residence time and limit humin buildup. Meanwhile, catalytic hydrogenation units next door upgrade in-house levulinic acid to gamma-valerolactone or 2-methyltetrahydrofuran, capturing margin in drop-in fuel additives. Enzymatic routes still face enzyme cost and stability hurdles, yet platform suppliers report double-digit reductions in enzyme loading after protein-engineering breakthroughs. The technology mix reflects a transition era where established processes secure present volumes while biotech innovation charts the next productivity leap for the levulinic acid market.
The Levulinic Acid Market Report is Segmented by Production Technology (Acid Hydrolysis, Biofine Process, and More), Grade (Industrial Grade, Pharma Grade, and Food Grade), End-User Industry (Cosmetics and Personal Care, Pharmaceuticals, and More), and Geography (Asia-Pacific, North America, Europe, South America, Middle East and Africa). The Market Forecasts are Provided in Terms of Volume (tons).
Geography Analysis
Asia-Pacific constitutes the demand epicenter at 41.29% volume share in 2024 and a projected 6.58% CAGR to 2030, supported by China's biomass surpluses and national carbon-neutrality targets. Provincial grants cover up to 30% of capital expenditure for bio-chemical projects, spurring new plants in Shandong and Guangxi. Japan's commercial woody-ethanol scheme underpins co-production of levulinic acid, while India's specialty-chemicals capacity expansion-notably in Gujarat-creates fresh downstream pull. Regional supply tightness keeps pricing firm, encouraging local investors to shorten import routes.
North America holds a mature yet opportunity-rich base where federal tax credits and loan guarantees spur biorefinery retrofits. Canada's Clean Fuel Standard compels refiners to adopt low-carbon feedstock, boosting contracts for gamma-valerolactone derived from levulinic acid. Mexican chemical clusters in Veracruz eye corn stover as an affordable feedstock, though logistics and agronomic residue management still limit scale. The market exhibits mid-single-digit growth as producers enhance process efficiency and secure long-term biomass offtake.
Europe preserves a strong foothold owing to rigorous sustainable-chemistry legislation. Italy hosts the world's largest single levulinic acid unit at 10,000 t/a, demonstrating industrial feasibility, while German and French firms pilot enzyme-enabled variants. The EU Fit-for-55 package accelerates demand in transport fuels and plastics, and Horizon Europe grants finance catalyst research that aims to outpace Asia on cost. South America and the Middle-East and Africa remain emerging pockets; Brazil's sugarcane bagasse and South Africa's forest residues present ample feedstock, yet investment decisions hinge on political stability and infrastructure to tap these reserves for the levulinic acid market.
- AK Scientific Inc.
- Avantium
- Biofine Technology, llc.
- GFBiochemicals
- GODAVARI BIOREFINERIES LTD.
- Hangzhou Aromalake Tech Co., Ltd.
- Hebei Yanuo Bioscience Group Co., Ltd
- LangFang Hawk Technology and Development Co,Ltd.
- Merck KGaA (Sigma-Aldrich)
- NXTLEVVEL Biochem
- Shandong Xinhua Pharma
- Thermo Fisher Scientific Inc.
- Tokyo Chemical Industry Co,. Ltd.
- Zibo Changlin Chemical Industry Co., Ltd.
Additional Benefits:
- The market estimate (ME) sheet in Excel format
- 3 months of analyst support
TABLE OF CONTENTS
1 Introduction
- 1.1 Study Assumptions and Market Definition
- 1.2 Scope of the Study
2 Research Methodology
3 Executive Summary
4 Market Landscape
- 4.1 Market Overview
- 4.2 Market Drivers
- 4.2.1 Rising Demand for Bio-Based Solvents and Plasticizers
- 4.2.2 Growing Use of Derivatives
- 4.2.3 Increasing Adoption in Cosmetics and Personal Care as Natural Preservative
- 4.2.4 Increasing Usage as a Substitute in Traditional Fertilizers
- 4.2.5 Circular-Economy Partnerships with Pulp and Paper Mills
- 4.3 Market Restraints
- 4.3.1 High Production Cost Vs Petro- Substitutes
- 4.3.2 Limited Commercial-Scale Manufacturing Capacity
- 4.3.3 Catalyst Deactivation from Humin Build-Up in Continuous Reactors
- 4.4 Value Chain Analysis
- 4.5 Porter's Five Forces
- 4.5.1 Bargaining Power of Suppliers
- 4.5.2 Bargaining Power of Buyers
- 4.5.3 Threat of New Entrants
- 4.5.4 Threat of Substitutes
- 4.5.5 Degree of Competition
5 Market Size and Growth Forecasts (Volume)
- 5.1 By Production Technology
- 5.1.1 Acid Hydrolysis
- 5.1.2 Biofine Process
- 5.1.3 Catalytic Hydrogenation Route
- 5.1.4 Emerging Biotechnological Routes
- 5.2 By Grade
- 5.2.1 Industrial Grade
- 5.2.2 Pharma Grade
- 5.2.3 Food Grade
- 5.3 By End-user Industry
- 5.3.1 Cosmetics and Personal Care
- 5.3.2 Pharmaceuticals
- 5.3.3 Polymers and Plasticizers
- 5.3.4 Fuel and Fuel Additives
- 5.3.5 Flavors and Fragrances
- 5.3.6 Other End-users Industries (Agriculture and Fertilizers, etc.)
- 5.4 By Geography
- 5.4.1 Asia-Pacific
- 5.4.1.1 China
- 5.4.1.2 Japan
- 5.4.1.3 India
- 5.4.1.4 South Korea
- 5.4.1.5 ASEAN Countries
- 5.4.1.6 Rest of Asia-Pacific
- 5.4.2 North America
- 5.4.2.1 United States
- 5.4.2.2 Canada
- 5.4.2.3 Mexico
- 5.4.3 Europe
- 5.4.3.1 Germany
- 5.4.3.2 United Kingdom
- 5.4.3.3 France
- 5.4.3.4 Italy
- 5.4.3.5 Spain
- 5.4.3.6 Russia
- 5.4.3.7 NORDIC Countries
- 5.4.3.8 Rest of Europe
- 5.4.4 South America
- 5.4.4.1 Brazil
- 5.4.4.2 Argentina
- 5.4.4.3 Rest of South America
- 5.4.5 Middle-East and Africa
- 5.4.5.1 Saudi Arabia
- 5.4.5.2 South Africa
- 5.4.5.3 Rest of Middle-East and Africa
- 5.4.1 Asia-Pacific
6 Competitive Landscape
- 6.1 Market Concentration
- 6.2 Strategic Moves
- 6.3 Market Share(%)/Ranking Analysis
- 6.4 Company Profiles (includes Global level Overview, Market level overview, Core Segments, Financials as available, Strategic Information, Market Rank/Share for key companies, Products and Services, and Recent Developments)
- 6.4.1 AK Scientific Inc.
- 6.4.2 Avantium
- 6.4.3 Biofine Technology, llc.
- 6.4.4 GFBiochemicals
- 6.4.5 GODAVARI BIOREFINERIES LTD.
- 6.4.6 Hangzhou Aromalake Tech Co., Ltd.
- 6.4.7 Hebei Yanuo Bioscience Group Co., Ltd
- 6.4.8 LangFang Hawk Technology and Development Co,Ltd.
- 6.4.9 Merck KGaA (Sigma-Aldrich)
- 6.4.10 NXTLEVVEL Biochem
- 6.4.11 Shandong Xinhua Pharma
- 6.4.12 Thermo Fisher Scientific Inc.
- 6.4.13 Tokyo Chemical Industry Co,. Ltd.
- 6.4.14 Zibo Changlin Chemical Industry Co., Ltd.
7 Market Opportunities and Future Outlook
- 7.1 White-space and Unmet-need Assessment
- 7.2 Growing Prevalence of Bio-based Levulinic Acid