|
시장보고서
상품코드
1851174
가변 레이트 기술 시장 : 점유율 분석, 산업 동향, 통계, 성장 예측(2025-2030년)Variable Rate Technology - Market Share Analysis, Industry Trends & Statistics, Growth Forecasts (2025 - 2030) |
||||||
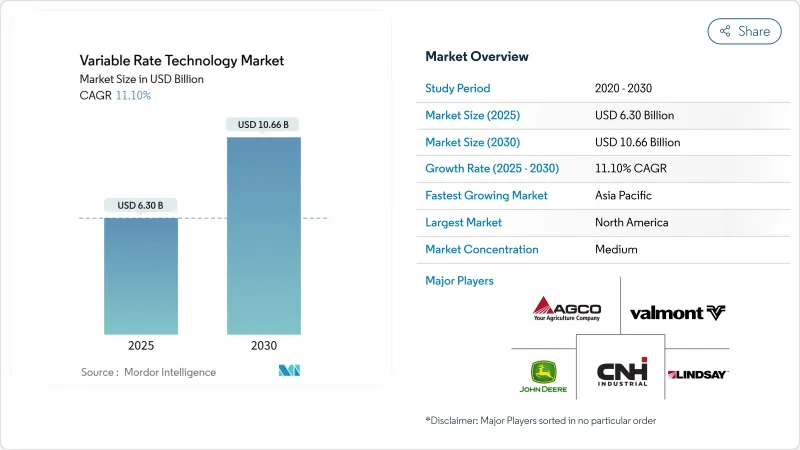
세계의 가변 레이트 기술 시장 규모는 2025년 63억 달러로 추정, 예측되며, 예측 기간 중 CAGR은 11.10%를 나타낼 전망이며, 2030년에는 106억 6,000만 달러에 달할 것으로 예측됩니다.
보다 적은 자원으로 더 많은 식량을 생산하는 압력 증가와 비료나 농약의 사용에 관한 규제의 감시가 함께 가변 레이트 기술 시장은 정밀 투입물 관리의 매우 중요한 실현 요인으로 자리매김하고 있습니다. 농업의 디지털화, 장비에 내장된 AI, 유리한 보조금 제도가 기술의 매력을 높이고, 장비 제조업체의 통합이 플랫폼 혁신을 가속화합니다. 북미가 수익의 기둥임에 변화는 없지만, 현대화 계획이 확대됨에 따라 아시아태평양이 가장 성장률에 기여하고 있습니다. 가치 창출은 여전히 하드웨어 판매가 지배적이지만, 서비스 중심 비즈니스 모델이 급속히 확대되고 성과 기반 제공으로 업계가 이동하고 있음을 보여줍니다.
세계 가변 레이트 기술 시장 동향과 통찰
농장의 급속한 디지털화
미국 농장의 61%는 실시간 농학 데이터를 클라우드 플랫폼에 공급하는 정밀 하드웨어에 이미 의존하고 있습니다. 장비 제조업체는 노동력을 줄이고 용도의 정확성을 향상시키는 자율 솔루션에 수십억 달러의 예산을 할당하고 있으며, 이는 John Deere의 10년에 걸친 200억 달러의 국내 제조 계획에 나와 있습니다. 유럽 정책은 마찬가지로 농업을 위한 향후 디지털 전략을 우선시하고 연결 장치에 대한 지속적인 자금을 확보하고 있습니다. AI 주도 알고리즘이 만들어내는 클로즈드 피드백 루프는 처방전을 지속적으로 조정하여 가변 레이트 기술 시장을 정적 지도에서 자기 학습 시스템으로 이행시킵니다. 그러나 대규모 농가와 소규모 농가 사이에 퍼져 있는 디지털 데바이드는 공정한 기술 도입을 위협하고 있습니다.
정부 보조금 및 장려금 제도
정책 입안자는 보조금, 리베이트, 에코 체계 등을 이용하여 도입 비용을 인수하고 있습니다. 미국 농무부의 기후 스마트 상품 이니셔티브는 섬세한 생산 데이터와 정밀 입력 도구가 필요한 프로젝트에 31억 달러를 투입하고 있습니다. 호주의 On-Farm Connectivity Program은 스마트 관개 장비 비용의 절반을 커버하고, 인도의 Digital Agriculture Mission은 연결된 인프라에 6,000캐롤 루피(7억 2,289만 달러)를 기록하고 있습니다. 유럽의 공통 농업 정책은 직접 지불 금액의 25% 이상을 가변 비율 시비에 보상하는 에코 방식으로 돌려 보냅니다. 이러한 보조금은 특히 과거 하이테크 지출로 인해 현금 흐름이 제한되었던 중규모 농장의 경우 진입 장벽을 낮출 것입니다.
VRT 대응 기계의 높은 자본 지출
수익성의 손익 분기점은 경제적인 농장 규모가 10만 유로(114,923.51달러)를 넘은 시점에서 시작되는 경우가 많으며, 소규모 경영에서는 기기 구입에서 놓쳐버립니다. AgDirect와 같은 금융기관은 분야별 대출을 제공하지만, 재무상태표가 얇은 가족이 운영하는 농장에는 담보 장애물이 높습니다. 이러한 상황을 피하기 위해 소유 단위가 아닌 서비스 제공 에이커에게 비용을 분산시키는 서비스로서 장비 계약이 있습니다.
부문 분석
2024년, 곡물 및 곡류는 매출의 37.60%를 차지해, 가변 레이트 기술 시장의 기반으로서의 역할을 확고히 했습니다. 이 넓은 면적 작물은 광범위한 토지에서 질소, 인, 파종 밀도를 미세 조정하는 수십년동안 처방 맵핑의 혜택을 받았습니다. 면화, 담배, 특수 섬유와 같은 상업용 작물은 14.80%의 연평균 복합 성장률(CAGR) 전망으로 가장 빠른 성장을 보여주며, 높은 이득이 프리미엄 센서와 장비 탑재 AI를 정당화합니다. 상업 작물의 가변 레이트 기술 시장 규모는 정확한 미크로네어 또는 잎 등급에 보상하는 품질 연동 가격 체계와 연동하여 상승할 것으로 예측됩니다. 멀티스펙트럼 카메라에 의한 식물 스트레스의 지속적인 모니터링은 몇 분 이내에 칼륨과 엽면 시비의 개입을 시작하는 실시간 모델에 공급됩니다. 이 응답성을 통해 생산자는 계약 보너스를 획득하고 등급과 관련된 하락을 줄일 수 있습니다. 곡류는 앞으로도 설치 기반의 대수를 유지할 것으로 보이지만, 선진적인 기능의 흡수는 특수 분야가 선두를 달릴 것입니다.
2세대 토양 분광학은 지방종자와 펄스의 윤작에서 비료의 미량 시비를 지원하는 양분 방출 곡선을 측정할 수 있게 되었습니다. 특히 단백질과 유분 함량이 농산물 가격에 직접 영향을 미치는 브라질과 인도의 도입이 진행되고 있습니다. 가변 레이트 기술 시장은 과일 수출업체가 브릭스와 색상의 허용 범위를 엄격하게 요구하기 때문에 과수원과 포도원의 운영에 더욱 침투하고 있습니다. 공급자는 수액 분석 및 관개량 제어를 구독 서비스에 번들로 제공하므로 소규모 면적의 과수원에서도 장비를 구입하지 않고도 고급 분석에 액세스할 수 있습니다.
2024년 비료 시장 점유율은 31.70%였습니다. 이는 질소 효율 개선이 대부분의 기후대에서 신속한 투자 회수를 실현하기 때문입니다. 가변 레이트 관개는 심각한 물 부족과 계절적 취수량에 대한 규제 상한을 반영하여 2030년까지 연평균 복합 성장률(CAGR) 17.20%로 나타날 것으로 보입니다. 캘리포니아 주 시험에서 정밀 피벗 관개는 수량 감소 없이 물 사용량을 25% 줄여 아몬드와 피스타치오 밭의 경제성을 입증했습니다. 관개 장비의 가변 레이트 기술 시장 규모는 저압 노즐 개수를 상환하는 보조금 프로그램에 견인되어 2030년까지 10억 달러의 매출 증가가 전망됩니다. 작물 보호 살포는 컴퓨터 비전에 의한 잡초 식별으로 제초제의 양이 최대 80% 줄어들기 때문에 바로 뒤따라 계속됩니다. 이러한 이점 외에도 수율 모니터링 용도는 미래의 처방을 개선하고 분석 소프트웨어의 구독 업데이트를 지원하는 데이터 피드백 루프를 완성합니다.
무선 토양 프로브와 클라우드 대시보드의 통합은 증발산 예측과 미래 강우 확률을 고려한 관개 결정을 가능하게 합니다. 이 예측 기능은 펌프의 수명을 연장하고 에너지 수요를 줄이고 자원 효율의 가치 제안을 강화합니다. 비료 용도는 속도 컨트롤러와 동기화되는 휴대용 실험실 키트를 통한 실시간 조직 검사를 활용하여 정적 지도를 계절 중 동적 일정으로 변환합니다. 생물학적 작물 보호 투입물의 제품 혁신은 센서 구동의 가변 레이트 알고리즘에 의존하는 정확한 미량 투여의 필요성을 더욱 증폭시키고 있습니다.
지역 분석
북미는 가변 레이트 기술 시장의 2024년 매출의 39%를 차지했습니다. 왕성한 기계 보급률, 지원 대출, USDA의 기후 변화를 고려한 조달 규칙이 수요를 지원합니다. 보조금의 틀은 문서화된 영양분의 감소에 보답하는 것으로, 노즐 레벨의 로그를 취득하는 스마트 기구의 채용에 박차를 가하고 있습니다. 농촌의 광대역은 중서부와 프레리 지방의 일부에서 늦었지만 위성 링크의 전개에 의해 2026년까지 커버 범위가 확대될 전망입니다. 오하이오에서의 시험은 VR 질소와 드론의 스탠드 카운트가 교차할 때 수율이 6% 증가하는 것으로 나타났습니다. 딜러 생태계는 플릿을 유지하고 데이터를 해석하는 공인 엔지니어를 제공하고 서비스 성장 이야기를 강조합니다.
아시아태평양은 가장 빠르게 성장하고 있으며 2030년까지 연평균 복합 성장률(CAGR)은 14.1%로 예상됩니다. 중국의 최근 5개년 계획에서는 저탄소에서 고효율의 농업이 추진되고 있으며, 이는 적목적 투입자재공급과 연동하고 있습니다. 인도의 Aadhaar 연동 농가 등록은 센서 키트의 보조금 지불을 간소화하고, 일본의 식량 농업성은 논에 특화한 가변율 파종 시험에 공동 출자합니다. 이 지역의 소구 획장 구조가 마을 기업이 운용하는 공유 서비스의 드론 등 독창적인 해결책에 불을 붙입니다. 호주와 중국 북부의 물 부족은 가변 레이트 관개의 도입을 가속화하고 국경을 넘어 지식의 이전과 하드웨어의 수입을 촉진합니다.
유럽에서는 철저한 기후 변화 정책에 가변 레이트 기술의 채용이 포함됩니다. 2023년부터 27년까지의 공통 농업 정책에서는 2,695억 유로(3,124억 달러)가 할당되고, 그 절반 가까이 비료 유출과 농약 드리프트를 줄이는 등 기후 변화 대책에 충당됩니다. 각 회원국은 직접 결제의 최소 25%를 에코 체계에 충당해야 합니다. 네덜란드와 같은 국가는 센서 설치의 최대 40%를 상환하는 디지털화 보조금에 자금을 제공하고 도입을 서두르고 있습니다. 데이터 주권에 관한 규칙은 플랫폼이 일반 데이터 보호 규칙(General Data Protection Regulation)의 의무에 적응하기 위한 컴플라이언스 비용을 높입니다. 그럼에도 불구하고 독일의 5G 테스트 베드 농업과 같은 컨소시엄 프로젝트는 안전한 연결성의 신뢰성을 높이고 유럽 전역의 탄소 이니셔티브는 요금 관리자가 생성한 추적 가능한 입력 데이터에 의존합니다.
기타 혜택:
- 엑셀 형식 시장 예측(ME) 시트
- 3개월의 애널리스트 서포트
목차
제1장 서론
- 조사의 전제조건과 시장의 정의
- 조사 범위
제2장 조사 방법
제3장 주요 요약
제4장 시장 상황
- 시장 개요
- 시장 성장 촉진요인
- 농장의 급속한 디지털화
- 정부 보조금과 인센티브 제도
- 농업 노동자 부족 심각화
- 위성 NB-IoT에 의한 서브에이커 시비
- 인풋 추적 가능성를 요구하는 탄소 크레딧의 수익화
- 오프라인 VRT 분석용 온장치 AI칩
- 시장 성장 억제요인
- VRT 대응 기계의 높은 설비 투자
- 취약한 지방 접속 인프라
- 데이터의 소유권과 공유의 모호함
- VRT 숙련 농학 서비스 제공업체의 부족
- 규제 상황
- 기술의 전망
- Porter's Five Forces 분석
- 신규 참가업체의 위협
- 구매자의 협상력
- 공급기업의 협상력
- 대체품의 위협
- 경쟁 기업간 경쟁 관계
제5장 시장 규모와 성장 예측
- 작물 유형별
- 곡물 및 곡류
- 과일 및 야채
- 지방종자 및 콩류
- 상업 작물
- 용도별
- 비료
- 농작물 보호 화학제품
- 토양 센싱
- 수율 모니터링
- 관개
- 기타(가변 레이트 파종 및 식기, 가변 레이트 석회 및 토양 개량제 살포)
- 제공별
- 하드웨어
- 소프트웨어
- 서비스
- 실시 방법별
- 지도 기반 VRT
- 센서 기반 VRT
- 농장 규모별
- 대규모 농장(1,000헥타르 이상)
- 중규모 농장(200-1,000헥타르)
- 소규모 농장(200헥타르 미만)
- 지역별
- 북미
- 미국
- 캐나다
- 멕시코
- 기타 북미
- 유럽
- 독일
- 프랑스
- 영국
- 이탈리아
- 스페인
- 러시아
- 기타 유럽
- 아시아태평양
- 중국
- 일본
- 인도
- 한국
- 호주
- 기타 아시아태평양
- 중동
- 튀르키예
- 사우디아라비아
- 아랍에미리트(UAE)
- 기타 중동
- 아프리카
- 남아프리카
- 이집트
- 나이지리아
- 기타 아프리카
- 북미
제6장 경쟁 구도
- 시장 집중도
- 전략적 동향
- 시장 점유율 분석
- 기업 프로파일
- Deere & Company
- AGCO Corporation
- CNH Industrial NV
- Valmont Industries, Inc.
- Lindsay Corporation
- EarthOptics
- Hexagon AB
- CropX Technologies
- TeeJet Technologies(Spraying Systems)
- DJI
- DroneDeploy
- The Climate Corporation(Bayer AG)
- EOS Data Analytics,Inc
- SoilOptix
- Frontier Agriculture Ltd
제7장 시장 기회와 장래의 전망
JHS 25.11.21The Variable Rate Technology Market size is estimated at USD 6.30 billion in 2025 and is projected to reach USD 10.66 billion by 2030, at a CAGR of 11.10% during the forecast period.

Rising pressure to produce more food with fewer resources, combined with regulatory scrutiny over fertilizer and pesticide use, positions the variable rate technology market as a pivotal enabler of precision input management. Wider farm digitalization, embedded on-equipment AI, and favorable subsidy programs strengthen technology appeal, while consolidation among equipment makers accelerates platform innovation. North America remains the revenue anchor, yet Asia-Pacific contributes the most incremental growth as modernization schemes expand. Hardware sales still dominate value creation, but service-centric business models scale quickly, signaling an industry shift toward outcome-based offerings.
Global Variable Rate Technology Market Trends and Insights
Rapid Digitalization of Farms
Sixty-one percent of United States farms already rely on precision hardware that feeds real-time agronomic data into cloud platforms. Equipment makers allocate multibillion-dollar budgets to autonomous solutions that lower labor needs and refine application accuracy, illustrated by John Deere's decade-long USD 20 billion domestic manufacturing plan. European policy likewise prioritizes an upcoming digital strategy for agriculture, ensuring sustained funding for connected devices. Closed feedback loops created by AI-driven algorithms continuously adjust prescriptions, moving the variable rate technology market beyond static maps toward self-learning systems. Yet a widening digital divide between large and small farms threatens equitable technology uptake.
Government Subsidies and Incentive Schemes
Policymakers use grants, rebates, and eco-schemes to underwrite adoption costs. The USDA Climate-Smart Commodities initiative channels USD 3.1 billion into projects that necessitate granular production data and, by extension, precision input tools. Australia's On-Farm Connectivity Program covers half the cost of smart irrigation devices, while India's Digital Agriculture Mission earmarks INR 6,000 crore (USD 722.89 million) for connected infrastructure. Europe's Common Agricultural Policy directs at least 25% of direct payments toward eco-schemes that reward variable-rate fertilization. These subsidies lower entry barriers, especially for mid-size farms whose cash flows were once restricted by high-tech spending.
High Capital Expenditure of VRT-Ready Machinery
Profitability breakeven often starts at economic farm sizes above EUR 100,000 (USD 114,923.51), leaving smaller operations priced out of equipment purchases. Lenders such as AgDirect offer sector-specific loans, yet collateral hurdles persist for family farms with thin balance sheets. As a workaround, equipment-as-a-service contracts spread costs across acres serviced rather than units owned.
Other drivers and restraints analyzed in the detailed report include:
- Rising Agricultural Labor Shortage
- Satellite NB-IoT-Enabled Sub-Acre Prescriptions
- Patchy Rural Connectivity Infrastructure
For complete list of drivers and restraints, kindly check the Table Of Contents.
Segment Analysis
In 2024, cereals and grains represented 37.60% of revenues, cementing their role as the foundation of the variable rate technology market. These broad-acre crops benefit from decades of prescription mapping that fine-tunes nitrogen, phosphorus, and seeding density across large tracts. Commercial crops such as cotton, tobacco, and specialty fibers deliver the fastest gains with a 14.80% CAGR outlook, as higher margins justify premium sensors and on-equipment AI. Variable rate technology market size for commercial crops is anticipated to climb in tandem with quality-linked pricing schemes that reward precise micronaire or leaf grade. Continuous monitoring of plant stress via multispectral cameras feeds real-time models that initiate potassium or foliar-feed interventions within minutes. This responsiveness helps producers capture contract bonuses and reduce grade-related downgrades. Cereals will keep anchoring installed base volumes, yet specialty segments set the pace for advanced feature uptake.
Second-generation soil spectroscopy now measures nutrient release curves that underpin fertilizer micro-dosing in oilseed and pulse rotations. Adoption is especially strong in Brazil and India, where protein and oil content directly influence farm-gate prices. The variable rate technology market further penetrates orchard and vineyard operations as fruit exporters demand tighter Brix and color tolerances. Providers bundle sap analysis and irrigation rate control into subscription services so smaller acreage fruit farms can access high-end analytics without outright equipment purchases.
Fertilizers held a 31.70% market share in 2024 because nitrogen efficiency improvements deliver quick paybacks in most climatic zones. Variable-rate irrigation is poised for a 17.20% CAGR by 2030, reflecting escalating water scarcity and regulatory caps on seasonal withdrawals. In California trials, precision pivots cut water use by 25% with no yield penalty, validating the economics for almond and pistachio groves. The variable rate technology market size for irrigation equipment is forecast to add USD 1 billion in incremental sales by 2030, buoyed by subsidy programs that reimburse low-pressure nozzle retrofits. Crop-protection spraying follows close behind as computer-vision weed identification slashes herbicide volumes by up to 80%. Added to these gains, yield monitoring applications complete the data feedback loop that refines future prescriptions and anchors subscription renewals for analytics software.
Integration of wireless soil probes with cloud dashboards enables irrigation decisions that account for evapotranspiration forecasts and future rainfall probability. This predictive capability extends pump life and trims energy demand, reinforcing the resource-efficiency value proposition. Fertilizer applications now leverage real-time tissue testing via portable lab kits that sync to rate controllers, converting static maps into season-long dynamic schedules. Product innovation in biological crop-protection inputs further amplifies the need for precise micro-dosing that hinges on sensor-driven variable rate algorithms.
The Variable Rate Technology Market Report is Segmented by Crop Type (Cereals and Grains and More), by Application (Fertilizers, Crop-Protection Chemicals, and More), by Offering (Hardware and More), by Implementation Method (Map-Based VRT and More), by Farm Size (Large Farms and More) and by Geography (North America, Europe, and More). The Market Forecasts are Provided in Terms of Value (USD).
Geography Analysis
North America generated 39% of 2024 revenue for the variable rate technology market. Strong machinery penetration, supportive financing, and USDA climate-smart procurement rules anchor demand. Subsidy frameworks reward documented nutrient reductions, spurring the adoption of smart implements that capture nozzle-level logs. Rural broadband lags in parts of the Midwest and Prairie provinces, yet satellite link rollouts promise coverage boosts by 2026. Ohio State trials show a 6% yield lift when VR nitrogen intersects with drone stand counts, proof points that validate ongoing investment. Dealer ecosystems supply certified technicians who maintain fleets and interpret data, underscoring the service growth narrative.
Asia-Pacific is the fastest climber, tracking a 14.1% CAGR to 2030 as governments attach digital farming clauses to modernization spending. China's latest Five-Year Plan promotes low-carbon, high-efficiency agriculture that dovetails with targeted input delivery. India's Aadhaar-linked Farmer Registry simplifies subsidy disbursement for sensor kits, while Japan's Food and Agriculture Ministry co-funds paddy-specific variable rate seeding trials. The region's small-plot structure sparks creative solutions, including shared-service drones operated by village entrepreneurs. Water scarcity across Australia and Northern China accelerates variable-rate irrigation uptake, driving cross-border knowledge transfer and hardware imports.
Europe embeds variable rate technology adoption within sweeping climate policy. The Common Agricultural Policy for 2023-27 allocates EUR 269.5 billion (USD 312.4 billion), nearly half aimed at climate objectives that include reduced fertilizer leaching and pesticide drift. Each member state must earmark at least 25% of direct payments for eco-schemes, many of which list precision application as a qualifying practice. Countries such as the Netherlands fund digitization grants that reimburse up to 40% of sensor installations, hastening implementation. Data sovereignty rules raise compliance costs as platforms adapt to General Data Protection Regulation obligations. Nonetheless, consortium projects like Germany's 5G Testbed Agriculture expedite confidence in secure connectivity, and Pan-European carbon initiatives depend on traceable input data generated by rate controllers.
- Deere & Company
- AGCO Corporation
- CNH Industrial N.V.
- Valmont Industries, Inc.
- Lindsay Corporation
- EarthOptics
- Hexagon AB
- CropX Technologies
- TeeJet Technologies (Spraying Systems)
- DJI
- DroneDeploy
- The Climate Corporation (Bayer AG)
- EOS Data Analytics,Inc
- SoilOptix
- Frontier Agriculture Ltd
Additional Benefits:
- The market estimate (ME) sheet in Excel format
- 3 months of analyst support
TABLE OF CONTENTS
1 Introduction
- 1.1 Study Assumptions and Market Definition
- 1.2 Scope of the Study
2 Research Methodology
3 Executive Summary
4 Market Landscape
- 4.1 Market Overview
- 4.2 Market Drivers
- 4.2.1 Rapid digitalization of farms
- 4.2.2 Government subsidies and incentive schemes
- 4.2.3 Rising agriculture labour shortage
- 4.2.4 Satellite NB-IoT-enabled sub-acre prescriptions
- 4.2.5 Carbon credit monetization demanding input traceability
- 4.2.6 On-equipment AI chips for offline VRT analytics
- 4.3 Market Restraints
- 4.3.1 High capital expenditure of VRT-ready machinery
- 4.3.2 Patchy rural connectivity infrastructure
- 4.3.3 Data ownership and sharing ambiguities
- 4.3.4 Shortage of VRT skilled agronomic service providers
- 4.4 Regulatory Landscape
- 4.5 Technological Outlook
- 4.6 Porter's Five Forces Analysis
- 4.6.1 Threat of New Entrants
- 4.6.2 Bargaining Power of Buyers
- 4.6.3 Bargaining Power of Suppliers
- 4.6.4 Threat of Substitutes
- 4.6.5 Intensity of Competitive Rivalry
5 Market Size and Growth Forecasts (Value)
- 5.1 By Crop Type
- 5.1.1 Cereals and Grains
- 5.1.2 Fruits and Vegetables
- 5.1.3 Oilseeds and Pulses
- 5.1.4 Commercial Crops
- 5.2 By Application
- 5.2.1 Fertilizers
- 5.2.2 Crop-protection Chemicals
- 5.2.3 Soil Sensing
- 5.2.4 Yield Monitoring
- 5.2.5 Irrigation
- 5.2.6 Others (variable-rate seeding/planting, variable-rate lime and soil-amendment application)
- 5.3 By Offering
- 5.3.1 Hardware
- 5.3.2 Software
- 5.3.3 Services
- 5.4 By Implementation Method
- 5.4.1 Map-based VRT
- 5.4.2 Sensor-based VRT
- 5.5 By Farm Size
- 5.5.1 Large Farms (greater than 1,000 ha)
- 5.5.2 Medium Farms (200-1,000 ha)
- 5.5.3 Small Farms (less than 200 ha)
- 5.6 By Geography
- 5.6.1 North America
- 5.6.1.1 United States
- 5.6.1.2 Canada
- 5.6.1.3 Mexico
- 5.6.1.4 Rest of North America
- 5.6.2 Europe
- 5.6.2.1 Germany
- 5.6.2.2 France
- 5.6.2.3 United Kingdom
- 5.6.2.4 Italy
- 5.6.2.5 Spain
- 5.6.2.6 Russia
- 5.6.2.7 Rest of Europe
- 5.6.3 Asia-Pacific
- 5.6.3.1 China
- 5.6.3.2 Japan
- 5.6.3.3 India
- 5.6.3.4 South Korea
- 5.6.3.5 Australia
- 5.6.3.6 Rest of Asia-Pacific
- 5.6.4 Middle East
- 5.6.4.1 Turkey
- 5.6.4.2 Saudi Arabia
- 5.6.4.3 United Arab Emirates
- 5.6.4.4 Rest of Middle East
- 5.6.5 Africa
- 5.6.5.1 South Africa
- 5.6.5.2 Egypt
- 5.6.5.3 Nigeria
- 5.6.5.4 Rest of Africa
- 5.6.1 North America
6 Competitive Landscape
- 6.1 Market Concentration
- 6.2 Strategic Moves
- 6.3 Market Share Analysis
- 6.4 Company Profiles (includes Global level Overview, Market level overview, Core Segments, Financials as available, Strategic Information, Market Rank/Share, Products and Services, Recent Developments)
- 6.4.1 Deere & Company
- 6.4.2 AGCO Corporation
- 6.4.3 CNH Industrial N.V.
- 6.4.4 Valmont Industries, Inc.
- 6.4.5 Lindsay Corporation
- 6.4.6 EarthOptics
- 6.4.7 Hexagon AB
- 6.4.8 CropX Technologies
- 6.4.9 TeeJet Technologies (Spraying Systems)
- 6.4.10 DJI
- 6.4.11 DroneDeploy
- 6.4.12 The Climate Corporation (Bayer AG)
- 6.4.13 EOS Data Analytics,Inc
- 6.4.14 SoilOptix
- 6.4.15 Frontier Agriculture Ltd