|
시장보고서
상품코드
1689948
글리콜 시장 : 시장 점유율 분석, 산업 동향 및 통계, 성장 예측(2025-2030년)Glycol - Market Share Analysis, Industry Trends & Statistics, Growth Forecasts (2025 - 2030) |
||||||
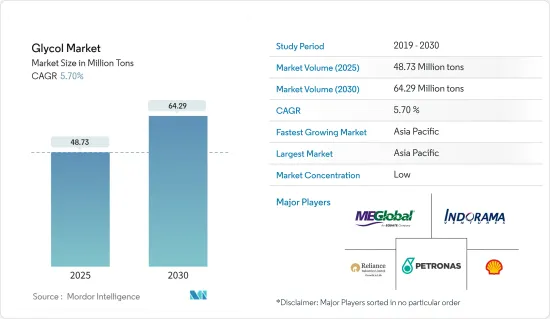
글리콜 시장 규모는 2025년에 4,873만 톤으로 추계되고, 2030년에는 6,429만 톤에 이를 것으로 예측되며, 시장 추계 및 예측 기간인 2025-2030년 CAGR 5.7%로 성장할 전망입니다.

2020년, COVID-19 팬데믹은 세계적인 봉쇄 및 사회적 거리두기 조치를 일으켜 공급망을 혼란시켜 많은 제조 부문을 폐쇄했습니다. 이것은 글리콜 시장에 악영향을 주었습니다. 그러나 시장은 2021년에는 회복되고 예측 기간 동안 안정적인 성장이 예상됩니다.
주요 하이라이트
- 단기적으로는 섬유산업에서의 사용량 증가 및 식음료 분야에서 수요 증가가 시장 수요를 견인하는 주요 요인입니다.
- 독성과 환경에 대한 우려가 시장 성장의 방해가 될 것으로 예측됩니다.
- 그러나 바이오 글리콜에 대한 수요 증가는 시장에 새로운 기회를 가져올 것으로 예측됩니다.
- 아시아태평양이 세계 시장을 독점하고, 중국, 인도, 일본에서의 수요가 대부분을 차지할 것으로 예측됩니다.
글리콜 시장 동향
섬유 산업에서의 사용 증가
- 주요 원료인 프로파일렌글리콜과 에틸렌글리콜은 다양한 제품, 특히 폴리에스테르 섬유를 생산하는데 있어서 매우 중요합니다. 이 섬유들은 의류, 의자 붙이기, 카펫, 베개 등에 사용되고 있습니다.
- 에틸렌 글리콜의 가장 두드러진 용도는 폴리에스테르 섬유로, 섬유 산업을 지배하고 있습니다. 또한, 글리콜 에테르는 섬유 시장에서 염욕 첨가제로서 중요한 역할을 하고, 색조의 정확도, 균염성, 견뢰도 등의 특성을 높여, 염색 온도와 사이클 시간을 단축합니다.
- 세계 섬유 분야가 증가 추세에 있기 때문에 글리콜류 수요는 증가하는 경향에 있습니다. World Trade Statistical Review 2023과 UN Comtrade의 데이터에 따르면 2022년에는 중국, EU, 인도가 섬유 수출 상위 3위로 총 세계 섬유 수출의 72.1%를 차지했습니다.
- 중국은 스판덱스 생산과 소비 모두에서 세계를 선도하고 있습니다. 중국 화학섬유협회의 스판덱스 부문은 2023년 말까지 중국의 스판덱스 생산 능력은 123만 9,500톤/년에 달했다고 보고했습니다. 조정 후 생산능력은 143톤/년 순증하여 2022년 대비 13% 증가했습니다.
- 인도에서 가장 오래된 산업 중 하나인 인도 섬유 부문은 GDP의 2.3%, 산업 생산의 13%, 수출의 12%를 차지하며, 경제에 큰 영향을 미치고 있습니다. 인도 브랜드 에쿼티 재단의 데이터에 따르면 2023년 섬유 및 의류 수출 총액은 367억 달러에 달했습니다. 2024년에는 359억 달러에 이른 것으로 평가되고 있습니다. 또한 기성복 및 부속품 수출액은 142억 3,000만 달러였습니다. 2024년도에는, 인도 최대의 시장인 미국으로의 섬유제품 및 의류품의 수출은, 총수출액의 32.7%를 차지했습니다. 이러한 수출 급증은 인도에서의 글리콜 수요를 높일 것으로 예상됩니다.
- National Council of Textile Organization(NCTO)의 데이터에 따르면 미국은 세계 3위의 섬유 수출국입니다. 미국의 섬유 산업은 8,000개 이상의 제품을 군에 공급했으며, 2023년에는 648억 달러의 출하액을 달성했습니다. 이 나라는 섬유 연구 개발의 세계적인 리더로서 눈에 띄고 있습니다.
- 일류 패션 브랜드로 유명한 이탈리아는 섬유 분야의 변화를 목격하고 있으며, 기술의 진보를 도입하면서 근대화에 노력하고 있습니다. ITMA에 따르면 이탈리아에는 약 45,000개의 섬유 및 패션 기업이 있습니다.
- Comex Stat(브라질)의 데이터에 의하면, 2023년에는 아르헨티나가 브라질의 섬유 및 의류 수출의 주요 수출처가 되어, 그 액수는 2억 3,000만 달러를 넘습니다. 파라과이와 우루과이는 이어서 각각 1억 3,300만 달러와 7,800만 달러의 수출이었습니다.
- 아프리카에서는 남아프리카가 대륙의 주요 섬유 수출국으로 떠오르고 2023년 수출액은 38억 달러에 달했습니다. Apparel and Textile Association of South Africa(남아프리카 의류 섬유 협회)의 데이터에 따르면, 이러한 수출의 대부분은 주로 기술 직물이며 항공사를 위한 것입니다.
- 이러한 역학을 고려하면, 세계의 글리콜 시장은 향후 수년간 성장하는 태세를 갖추고고 있습니다.
아시아태평양이 시장을 독점
- 아시아태평양은 글리콜 소비를 선도하고 시장을 독점하며 예측 기간 동안 가장 빠르게 성장하는 지역으로 떠오릅니다. 이러한 급성장은 특히 중국, 인도, 한국, 일본, 동남아시아 국가 등 포장, 식음료, 자동차, 수송, 화장품, 섬유 등 다양한 최종 사용자 산업에서의 수요가 높아지고 있는 것이 배경에 있습니다.
- 아시아태평양에서는 수출과 국내 소비가 증가함에 따라 식품 및 소비재 등 업계가 포장 재료를 요구하는 경향이 강해지고 있습니다. 이 지역의 포장 시장은, 특히 e커머스의 대두에 의해, 포장 식품이나 움직임이 빠른 소비재에의 의욕이 높아지고 있는 것에 의지하고 있습니다. 그 이점으로부터, 엔지니어링 플라스틱 제품, 특히 PET 용기와 병은, 포장 분야에서 큰폭의 상승을 눈 앞에 두고 있습니다. PET는 에틸렌글리콜, 테레프탈산디메틸(DMT), 테레프탈산에서 파생됩니다.
- 중국의 포장 산업은 세계의 중요한 포장 산업 중 하나입니다. 중국의 포장 산업이 일관되게 성장하고 있는 것은 경제가 확대되면서 구매력을 가진 중산층이 급증하고 있기 때문입니다. 또한 이 나라의 포장 산업은 성장이 전망되고 있습니다. 중국 정부의 보고서에 의하면, 동산업의 평가액은 2025년까지 2조 위안(2,900억 달러)에 달할 것으로 추정되고 있습니다.
- 식품 가공 산업의 대두로 인도에서는 식품 포장의 수요가 높아질 것으로 예상되고 있습니다. 식품 가공부는 인도 경제의 주요 기업인 식품 가공 부문이 식품 시장 전체의 32%를 차지하고 있음을 강조하고 있습니다. 시장 추계 및 예측에 의하면, 이 산업의 생산고는 2025년까지 5,350억 달러에 이를 전망이며, 연율 15.2%로 성장해, 시장의 성장을 지탱할 것으로 예측됩니다.
- 포장 외에도, 에틸렌 글리콜은 자동차 라디에이터의 동결 방지제로서 중요한 역할을 하고 있습니다. 자동차 업계는 활기차고 중국이 세계를 선도하고 있습니다. 국제자동차건설기구(OICA) 데이터에 따르면 2023년 중국의 자동차 생산대수는 3,016만 대로 2022년 2,702만 대에서 12% 증가했습니다. 이 같은 자동차 생산 급증은 글리콜 시장을 강화할 태세입니다.
- 한국은 현대, 삼성, 키아 등 유명 브랜드를 자랑하는 성숙한 자동차 산업을 자랑하고 있습니다. 자동차공업협회와 한국자동차연구원의 예측에 따르면 2024년 국내 자동차 생산량은 1.0% 증가해 436만 대에 이른 것으로 평가됩니다. 이 성장은 시장의 수요를 촉진할 것으로 예상됩니다.
- 중국의 화장품 시장은 지난 10년간 급성장을 이뤘습니다. 중국 국가통계국의 데이터에 따르면 2023년 화장품 소매 매출액은 약 4,141억 7,000만 위안(585억 달러)에 달했습니다. 제2, 제3의 도시에서 수요가 급증하고 남성용 스킨케어도 현저히 증가하고 있어 글리콜 시장은 성장할 것으로 보입니다.
- 한국은 세계의 미용 시장의 톱 10에 랭크되어 그 혁신성, 천연 성분의 사용, 매력적인 포장으로 칭찬되고 있습니다. 식품의약품안전부(MFDS) 데이터에 따르면 한국의 화장품 수출은 2023년 85억 달러에 달해 세계 4위의 지위를 확보했습니다.
- 합리적인 가격으로 고품질의 의약품을 제공하는 것으로 알려진 인도의 의약품 부문은 급속한 과학적 진보의 궤도를 타고 있습니다. 정부는 2030년까지 500억 달러에서 1,300억 달러, 2047년까지 4,500억 달러로 급증할 것으로 예측하고 있습니다. 이러한 성장은 예측 기간 동안 의약품 제조에 대한 글리콜 수요의 증가를 시사하고 있습니다.
- 이러한 역학을 생각하면, 아시아태평양은 다양한 산업에 있어서 수요의 급증에 견인되어, 큰 성장을 이루게 됩니다.
글리콜 산업 개요
글리콜 시장은 세분화되어 있습니다. 주요 기업은 Shell PLC, MEGlobal, Indorama Ventures Public Company Limited, Reliance Industries Limited, Petronas Chemicals Group Berhad 등입니다.
기타 혜택
- 엑셀 형식 시장 예측(ME) 시트
- 3개월간의 애널리스트 서포트
목차
제1장 서론
- 조사의 전제조건 및 시장 정의
- 조사 범위
제2장 조사 방법
제3장 주요 요약
제4장 시장 역학
- 성장 촉진요인
- 섬유 산업에서 사용 증가
- 식음료 분야에서 수요 증가
- 기타
- 성장 억제요인
- 독성과 환경에 대한 우려
- 기타
- 산업 밸류체인 분석
- Porter's Five Forces 분석
- 공급기업의 협상력
- 구매자의 협상력
- 신규 참가업체의 위협
- 대체품의 위협
- 경쟁도
제5장 시장 세분화
- 유형별
- 에틸렌글리콜
- 모노에틸렌글리콜(MEG)
- 디에틸렌글리콜(DEG)
- 트리에틸렌글리콜(TEG)
- 폴리에틸렌글리콜(PEG)
- 프로파일렌글리콜
- 기타
- 에틸렌글리콜
- 최종 사용자 산업별
- 자동차 및 운송
- 포장
- 음식
- 화장품
- 의약품
- 섬유
- 기타
- 지역별
- 아시아태평양
- 중국
- 인도
- 일본
- 한국
- 말레이시아
- 태국
- 인도네시아
- 베트남
- 기타 아시아태평양
- 북미
- 미국
- 캐나다
- 멕시코
- 유럽
- 독일
- 영국
- 프랑스
- 이탈리아
- 스페인
- 북유럽 국가
- 튀르키예
- 러시아
- 기타 유럽
- 남미
- 브라질
- 아르헨티나
- 콜롬비아
- 기타 남미
- 중동 및 아프리카
- 사우디아라비아
- 카타르
- 아랍에미리트(UAE)
- 나이지리아
- 이집트
- 남아프리카
- 기타 중동 및 아프리카
- 아시아태평양
제6장 경쟁 구도
- M&A, 합작사업, 제휴 및 협정
- 시장 점유율(%)** 및 랭킹 분석
- 주요 기업의 전략
- 기업 프로파일
- BASF SE
- China Petrochemical Corporation
- China Sanjiang Fine Chemical Co. Ltd
- Dow
- Huntsman International LLC
- India Glycols Limited
- Indian Oil Corporation Ltd
- Indorama Ventures Public Company Limited
- INEOS
- LOTTE Chemical Corporation
- LyondellBasell Industries Holdings BV
- MEGlobal
- Mitsubishi Chemical Group Corporation
- Nouryon
- PETRONAS Chemicals Group Berhad
- Petrorabigh
- Reliance Industries Limited
- SABIC
- Shell PLC
제7장 시장 기회 및 향후 동향
- 바이오 글리콜 수요 증가
- 기타 기회
The Glycol Market size is estimated at 48.73 million tons in 2025, and is expected to reach 64.29 million tons by 2030, at a CAGR of 5.7% during the forecast period (2025-2030).
In 2020, the COVID-19 pandemic triggered nationwide lockdowns and social distancing measures, disrupting supply chains and shuttering numerous manufacturing sectors. This adversely affected the glycol market. However, the market recovered in 2021, and it is expected to grow steadily during the forecast period.
Key Highlights
- Over the short term, increasing usage in the textile industry and growing demand from the food and beverage sector are the major factors driving the demand for the market studied.
- However, toxicity and environmental concerns are expected to hinder the market's growth.
- Nevertheless, increasing demand for bio-based glycols is expected to create new opportunities for the market studied.
- Asia-Pacific is expected to dominate the global market, with the majority of demand coming from China, India, and Japan.
Glycol Market Trends
Increasing Usage in the Textile Industry
- Key raw materials propylene glycol and ethylene glycol are pivotal in producing various products, most notably polyester fibers. These fibers find applications in clothing, upholstery, carpets, and pillows.
- Ethylene glycol's most prominent application is in polyester fibers, which dominate the textile industry. Additionally, glycol ethers play a crucial role as dyebath additives in the textile market, enhancing properties like shade accuracy, level dyeing, colorfastness, and reducing dyeing temperatures and cycle times.
- With the global textile sector on the rise, the demand for glycols is set to increase. Data from the World Trade Statistical Review 2023 and UN Comtrade highlighted that in 2022, China, the European Union, and India were the top three textile exporters, collectively accounting for 72.1% of global textile exports.
- China leads the world in both spandex production and consumption. The Spandex Branch of China Chemical Fibers Association reported that by the end of 2023, China's spandex capacity reached 1.2395 million tons/year. After adjustments, this marked a net capacity increase of 143 kt/year, translating to a 13% growth from 2022.
- India's textile sector, one of the nation's oldest industries, impacts the economy significantly, accounting for 2.3% of the GDP, 13% of industrial production, and 12% of exports. Data from the Indian Brand Equity Foundation showed that the total textile and apparel exports reached USD 36.7 billion in 2023. It is estimated to reach USD 35.9 billion in 2024. Additionally, exports of readymade garments and accessories were valued at USD 14.23 billion. In FY 2024, exports of textiles and apparel to the United States, India's largest market, constituted 32.7% of the total export value. This surge in exports is expected to bolster the demand for glycols in India.
- According to data from the National Council of Textile Organization (NCTO), the United States ranks as the world's third-largest textile exporter. The US textile industry supplies over 8,000 products to the military and achieved shipments worth USD 64.8 billion in 2023. The country stands out as a global leader in textile research and development.
- Renowned for its prestigious fashion brands, Italy is witnessing a transformation in its textile sector, striving for modernization while embracing technological advancements. ITMA reports that Italy boasts around 45,000 textile and fashion companies.
- Data from Comex Stat (Brazil) revealed that in 2023, Argentina was the primary destination for Brazilian textile and apparel exports, valued at over USD 230 million. Paraguay and Uruguay followed, with exports worth USD 133 million and USD 78 million, respectively.
- In Africa, South Africa emerged as the continent's leading textile exporter, with exports reaching USD 3.8 billion in 2023. A significant portion of these exports, primarily technical textiles, catered to aeronautics companies, as reported by the data from the Apparel and Textile Association of South Africa.
- Given these dynamics, the global glycol market is poised for growth in the coming years.
Asia-Pacific to Dominate the Market
- Asia-Pacific is poised to lead glycol consumption, dominating the market and emerging as the fastest-growing region during the forecast period. This surge is fueled by escalating demands from diverse end-user industries, including packaging, food and beverage, automotive, transportation, cosmetics, and textiles, particularly in nations like China, India, South Korea, Japan, and various Southeast Asian countries.
- In Asia-Pacific, industries such as food and beverage and consumer goods are increasingly seeking packing materials, driven by rising exports and domestic consumption. The region's packaging market is buoyed by a growing appetite for packaged foods and fast-moving consumer goods, especially with the rise of e-commerce. Due to their advantages, engineering plastic products, notably PET containers and bottles, are witnessing a significant uptick in the packaging sector. PET is derived from ethylene glycol, dimethyl terephthalate (DMT), or terephthalic acid.
- China's packaging industry is one of the significant global packaging industries. The consistent growth of China's packaging industry can be attributed to its expanding economy and a burgeoning middle class with increased purchasing power. Furthermore, the packaging industry in the country is expected to grow. A report by the Chinese government estimates the industry achieving a valuation of CNY 2 trillion (USD 290 billion) by 2025.
- With the rising food processing industry, India anticipates heightened demand for food packaging. The Ministry of Food Processing highlights that the food processing sector, a major player in India's economy, represents 32% of the overall food market. Projections estimate the industry's output to hit USD 535 billion by 2025, growing at an annual rate of 15.2%, supporting the market's growth.
- Beyond packaging, ethylene glycol plays a crucial role as an anti-freezing agent in car radiators. The automotive landscape is vibrant, with China leading globally. Data from the Organisation Internationale des Constructeurs d'Automobiles (OICA) revealed that in 2023, China produced 30.16 million vehicles, a 12% increase from 27.02 million in 2022. This surge in automobile production is poised to bolster the glycol market.
- South Korea boasts a mature automotive industry with notable brands like Hyundai, Renault, Samsung, and Kia. Projections from the Automobile Manufacturers Association and Korea Automobile Research Institute anticipate a 1.0% rise in domestic automobile production for 2024, reaching 4.36 million units. This growth is expected to drive demand in the market studied.
- China's cosmetics landscape has seen rapid growth over the past decade. Data from the National Bureau of Statistics of China indicated that in 2023, retail sales of cosmetics reached approximately CNY 414.17 billion (~USD 58.5 billion). With demand surging in second and third-tier cities and a notable rise in men's skincare, the glycol market is set to thrive.
- South Korea ranks among the top ten global beauty markets and is celebrated for its innovation, use of natural ingredients, and attractive packaging. According to the data from the Ministry of Food and Drug Safety (MFDS), Korea's cosmetics exports hit USD 8.5 billion in 2023, securing fourth position globally.
- India's pharmaceutical sector, known for its affordable and high-quality medicines, is on a trajectory of rapid scientific advancements. The government forecasts the industry's value to soar from USD 50 billion to USD 130 billion by 2030 and an ambitious USD 450 billion by 2047. Such growth signals a heightened demand for glycol in pharmaceutical drug production during the forecast period.
- Given these dynamics, Asia-Pacific is set for significant growth, driven by surging demands across various industries.
Glycol Industry Overview
The glycol market is fragmented in nature. The major players include Shell PLC, MEGlobal, Indorama Ventures Public Company Limited, Reliance Industries Limited, and PETRONAS Chemicals Group Berhad.
Additional Benefits:
- The market estimate (ME) sheet in Excel format
- 3 months of analyst support
TABLE OF CONTENTS
1 Introduction
- 1.1 Study Assumptions and Market Definition
- 1.2 Scope of the Study
2 Research Methodology
3 Executive Summary
4 Market Dynamics
- 4.1 Drivers
- 4.1.1 Increasing Usage in the Textile Industry
- 4.1.2 Growing Demand from the Food and Beverage Sector
- 4.1.3 Other Drivers
- 4.2 Restraints
- 4.2.1 Toxicity and Environmental Concerns
- 4.2.2 Other Restraints
- 4.3 Industry Value Chain Analysis
- 4.4 Porter's Five Forces Analysis
- 4.4.1 Bargaining Power of Suppliers
- 4.4.2 Bargaining power of Buyers
- 4.4.3 Threat of New Entrants
- 4.4.4 Threat of Substitute Products and Services
- 4.4.5 Degree of Competition
5 Market Segmentation (Market Size in Volume)
- 5.1 By Type
- 5.1.1 Ethylene Glycol
- 5.1.1.1 Monoethylene Glycol (MEG)
- 5.1.1.2 Diethylene Glycol (DEG)
- 5.1.1.3 Triethylene Glycol (TEG)
- 5.1.1.4 Polyethylene Glycol (PEG)
- 5.1.2 Propylene Glycol
- 5.1.3 Other Types
- 5.1.1 Ethylene Glycol
- 5.2 By End-user Industry
- 5.2.1 Automotive and Transportation
- 5.2.2 Packaging
- 5.2.3 Food and Beverage
- 5.2.4 Cosmetics
- 5.2.5 Pharmaceuticals
- 5.2.6 Textile
- 5.2.7 Other End-user Industries
- 5.3 By Geography
- 5.3.1 Asia-Pacific
- 5.3.1.1 China
- 5.3.1.2 India
- 5.3.1.3 Japan
- 5.3.1.4 South Korea
- 5.3.1.5 Malaysia
- 5.3.1.6 Thailand
- 5.3.1.7 Indonesia
- 5.3.1.8 Vietnam
- 5.3.1.9 Rest of Asia-Pacific
- 5.3.2 North America
- 5.3.2.1 United States
- 5.3.2.2 Canada
- 5.3.2.3 Mexico
- 5.3.3 Europe
- 5.3.3.1 Germany
- 5.3.3.2 United Kingdom
- 5.3.3.3 France
- 5.3.3.4 Italy
- 5.3.3.5 Spain
- 5.3.3.6 NORDIC Countries
- 5.3.3.7 Turkey
- 5.3.3.8 Russia
- 5.3.3.9 Rest of Europe
- 5.3.4 South America
- 5.3.4.1 Brazil
- 5.3.4.2 Argentina
- 5.3.4.3 Colombia
- 5.3.4.4 Rest of South America
- 5.3.5 Middle East and Africa
- 5.3.5.1 Saudi Arabia
- 5.3.5.2 Qatar
- 5.3.5.3 United Arab Emirates
- 5.3.5.4 Nigeria
- 5.3.5.5 Egypt
- 5.3.5.6 South Africa
- 5.3.5.7 Rest of Middle East and Africa
- 5.3.1 Asia-Pacific
6 Competitive Landscape
- 6.1 Mergers and Acquisitions, Joint Ventures, Collaborations, and Agreements
- 6.2 Market Share(%)**/Ranking Analysis
- 6.3 Strategies Adopted by Leading Players
- 6.4 Company Profiles
- 6.4.1 BASF SE
- 6.4.2 China Petrochemical Corporation
- 6.4.3 China Sanjiang Fine Chemical Co. Ltd
- 6.4.4 Dow
- 6.4.5 Huntsman International LLC
- 6.4.6 India Glycols Limited
- 6.4.7 Indian Oil Corporation Ltd
- 6.4.8 Indorama Ventures Public Company Limited
- 6.4.9 INEOS
- 6.4.10 LOTTE Chemical Corporation
- 6.4.11 LyondellBasell Industries Holdings B.V.
- 6.4.12 MEGlobal
- 6.4.13 Mitsubishi Chemical Group Corporation
- 6.4.14 Nouryon
- 6.4.15 PETRONAS Chemicals Group Berhad
- 6.4.16 Petrorabigh
- 6.4.17 Reliance Industries Limited
- 6.4.18 SABIC
- 6.4.19 Shell PLC
7 Market Opportunities and Future Trends
- 7.1 Increasing Demand for Bio-based Glycols
- 7.2 Other Opportunities