|
시장보고서
상품코드
1693523
미량영양소 비료 시장 : 점유율 분석, 산업 동향, 통계, 성장 예측(2025-2030년)Micronutrient Fertilizer - Market Share Analysis, Industry Trends & Statistics, Growth Forecasts (2025 - 2030) |
||||||
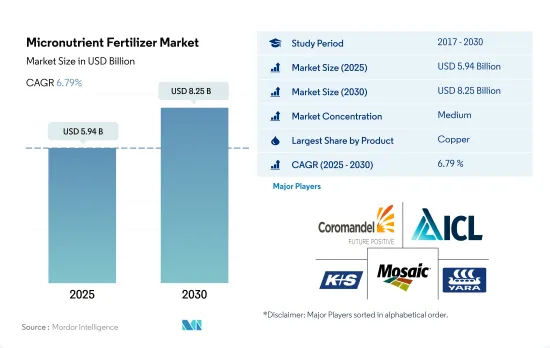
미량영양소 비료 시장 규모는 2025년에 59억 4,000만 달러, 2030년에는 82억 5,000만 달러에 이를 것으로 예측되며, 예측 기간 중(2025-2030년) CAGR은 6.79%를 나타낼 전망입니다.

토양에서 미량영양소 결핍증 증가는 미량영양소 비료시장의 성장을 가속할 것으로 예상
- 미량영양소는 세포벽 형성, 꽃가루 형성, 발아, 엽록소 생산, 질소 고정, 단백질의 필수 부분의 합성 등 많은 식물 대사 활동에서 중요한 역할을 하고 있습니다.
- 2022년 미량영양소 비료 세계 시장에서 아연은 26.6%의 점유율을 차지하고 있습니다.
- 아시아태평양은 세계 시장을 독점하여 2022년 시장 규모 점유율의 33.3%를 차지했습니다. 식량 곡물에 대한 수요 증가와 토양의 영양소의 감소가 이 지역 시장 성장을 가속하는 주요 요인 중 하나입니다. 최근 연구에서는 아연 결핍증이 중국에서 가장 만연하고 있는 미량영양소 결핍증인 것으로 나타났습니다.
- 세계적으로 광범위한 미량영양소의 결핍은 식물의 건강에 대한 관심이 높아지고 있으며 식물과 토양의 건강을 높이기 위해 미량영양소의 사용을 개선하기 위해 다양한 정부기관과 기타 조직에서 장려되게 되어 있는 것도 함께 시장의 성장을 가속하고 있습니다.
미량영양소 결핍증 증가는 미량영양소 비료 수요를 증가시킵니다.
- 미량영양소 비료 세계 시장은 조사기간 중 안정된 성장률로 추이해 2022년 시장 규모는 57억 달러였습니다.
- 인도와 중국과 같은 국가는 주요 미량영양소 비료 시장으로 2022년 시장 점유율의 각각 13.9%와 10.5%를 차지했습니다. kg/ha의 아연을 전국 추천 비료에 추가해, 최근, 쌀이나 옥수수 등의 여름 작물용으로 확대했습니다.
- 프랑스는 유럽에서의 미량영양소 비료의 주요 시장이며, 이어 우크라이나에서 2022년 시장 규모는 2억 1,840만 달러입니다.
- 아시아를 제외하면 사하라 이남의 아프리카와 남미 북서부에서는 토양 중의 아연과 철의 결핍이 상당히 퍼지고 있습니다. 미량영양소 비료의 전반적인 장점은 널리 받아들여지고 인정받고 있습니다.
- 이 시장이 성장하고 있는 것은 세계에서 미량영양소의 결핍이 만연하고 있어 철과 아연의 결핍이 식물의 건강에 대한 우려가 높아지고 있기 때문에 또한, 다양한 정부 기관으로부터 미량영양소의 사용을 늘리도록 장려하고 있기 때문입니다.
세계의 미량영양소 비료의 동향
증가하는 식량 수요를 충족시키기 위한 농업 산업에 대한 압력 증가는 농작물의 재배 면적을 증가시킬 것으로 예측됩니다.
- 세계의 농업 부문은 현재 많은 과제에 직면하고 있습니다. 유엔에 따르면 세계 인구는 2050년까지 90억 명을 넘을 가능성이 있습니다. 유엔 식량 농업 기관에 따르면, 2050년까지 세계 인구의 70%가 도시에 살 것으로 예측됩니다.
- 아시아태평양은 세계 최대의 농산물 생산지입니다. 농업은 이 지역의 경제에 필수적이며, 전체 노동 인구의 약 20%를 고용하고 있습니다. 밭작물 재배가 지역의 전체 작물 재배 면적의 약 95% 이상을 차지하고 있습니다.
- 북미는 세계 제2위의 경작 가능 지역입니다.그 농장에서는 농작물을 중심으로 다양한 작물이 재배되고 있습니다. 재배 면적의 46.2%를 차지하고 있습니다. 그러나, 이 나라는 2017-2019년에 걸쳐 작물 재배 면적의 대폭적인 감소를 목격했지만, 이것은 주로 텍사스나 휴스턴과 같은 지역에서 심각한 홍수로 이어지는 악환경 조건 때문이었습니다.
아시아태평양은 5.20kg/헥타르라는 가장 높은 평균 미량영양소 적용률을 차지했습니다.
- 고수량 작물의 양분 손실률이 높기 때문에 미량영양소 수요가 크게 증가하고 있습니다. 2022년 전 세계적으로 밭작물의 평균 미량영양소 사용량은3.92kg/헥타르였습니다. 따라서 망간, 아연, 구리는 2022년의 농작물에 있어서의 시용률이 보다 높은 주요 영양소로 추정되어 각각 9.53kg/ha, 6.63kg/ha, 6.34kg/ha를 차지합니다.
- 2022년 평균 미량영양소 시용량이 가장 많은 것은 유채, 카놀라로 5.20kg/ha, 이어서 벼가 4.42kg/ha, 설엄이 4.37kg/ha였습니다. 작물과 지역마다 미량영양소에 따라 다르게 반응합니다. 예를 들어, 밀에서는 구리와 망간의 결핍이 일반적이지만, 붕소의 결핍은 밀에서 관찰되고, 몰리브덴은 아시아태평양에서 결핍하고 있습니다.
- 2022년 미량영양소의 평균 시용량은 아시아태평양이 5.20kg/ha로 가장 많았고 남미가 4.37kg/ha, 북미가 4.21kg/ha였습니다. 따라서 근년에 현저하게 증가하고 있습니다.
미량영양소 비료의 산업 개요
미량영양소 비료 시장은 적당히 통합되어 상위 5개사에서 57.38%를 차지하고 있습니다.이 시장의 주요 기업은 Coromandel International Ltd., ICL Group Ltd.K+S Aktiengesellschaft, The Mosaic Company and Yara International ASA (sorted alphabetically)입니다.
기타 혜택
- 엑셀 형식 시장 예측(ME) 시트
- 3개월의 애널리스트 서포트
목차
제1장 주요 요약과 주요 조사 결과
제2장 보고서 제안
제3장 소개
- 조사의 전제조건과 시장 정의
- 조사 범위
- 조사 방법
제4장 주요 산업 동향
- 주요 작물의 작부 면적
- 밭작물
- 원예작물
- 평균 양분 시용률
- 미량영양소
- 밭작물
- 원예작물
- 미량영양소
- 관개 설비가 있는 농지
- 규제 프레임워크
- 밸류체인과 유통채널 분석
제5장 시장 세분화
- 제품
- 붕소
- 구리
- 철
- 망간
- 몰리브덴
- 아연
- 기타
- 적용방법
- 시비
- 잎면 살포
- 토양
- 작물 유형
- 밭작물
- 원예작물
- 잔디 및 관상용
- 지역
- 아시아태평양
- 호주
- 방글라데시
- 중국
- 인도
- 인도네시아
- 일본
- 파키스탄
- 필리핀
- 태국
- 베트남
- 기타 아시아태평양
- 유럽
- 프랑스
- 독일
- 이탈리아
- 네덜란드
- 러시아
- 스페인
- 우크라이나
- 영국
- 기타 유럽
- 중동 및 아프리카
- 나이지리아
- 사우디아라비아
- 남아프리카
- 튀르키예
- 기타 중동 및 아프리카
- 북미
- 캐나다
- 멕시코
- 미국
- 기타 북미
- 남미
- 아르헨티나
- 브라질
- 기타 남미
- 아시아태평양
제6장 경쟁 구도
- 주요 전략 동향
- 시장 점유율 분석
- 기업 상황
- 기업 프로파일
- BMS Micro-Nutrients NV
- Coromandel International Ltd.
- Haifa Group
- ICL Group Ltd
- KS Aktiengesellschaft
- Koch Industries Inc.
- Nouryon
- The Mosaic Company
- Yara International ASA
제7장 CEO에 대한 주요 전략적 질문
제8장 부록
- 세계 개요
- 개요
- Five Forces 분석 프레임워크
- 세계의 밸류체인 분석
- 시장 역학(DROs)
- 정보원과 참고문헌
- 도표 일람
- 주요 인사이트
- 데이터 팩
- 용어집
The Micronutrient Fertilizer Market size is estimated at 5.94 billion USD in 2025, and is expected to reach 8.25 billion USD by 2030, growing at a CAGR of 6.79% during the forecast period (2025-2030).
The rising micronutrient deficiency in soil is expected to fuel the growth of the micronutrient fertilizer market
- Micronutrients play an important role in many plant metabolic activities, such as cell wall formation, pollen formation, germination, chlorophyll production, nitrogen fixation, and the synthesis of the essential parts of proteins. The global micronutrient fertilizer market value is anticipated to register a CAGR of 6.6% during 2023-2030.
- Zinc accounted for a major share of 26.6% of the global micronutrient fertilizer market value in 2022. Of the total value share held by zinc fertilizers, conventional zinc fertilizers accounted for about 87.5%, and specialty zinc fertilizers accounted for about 12.5%. Specialty zinc fertilizers have the advantage of uniform distribution and fast acting on crops compared to conventional fertilizers.
- The Asia-Pacific region dominated the global market, accounting for 33.3% of the market value share in 2022. The distribution network of micronutrient fertilizers is well-established in the major Asia-Pacific countries, further boosting the market for various micronutrient fertilizer products in the region. The increasing demand for food grains, coupled with decreasing nutrients in the soil, is one of the major factors driving the growth of the market in the region. Recent studies have indicated that zinc deficiency is China's most widespread micronutrient deficiency. More than 50.0% of the arable soils are low in zinc, thereby limiting agricultural growth and improvement in human nutrition.
- Widespread micronutrient deficiencies worldwide are becoming a rising concern for plant health, coupled with increasing encouragement from various government agencies and other organizations to improve the use of micronutrients to enhance plant and soil health, which is driving the growth of the market.
The increase in micronutrient deficiencies increases the demand for micronutrient fertilizers
- The global micronutrient fertilizer market grew at a stable rate during the study period, with a value of USD 5.70 billion in 2022. Asia-Pacific occupied the largest market share of 38.8% in 2022, followed by Europe and North America.
- Countries such as India and China are the major micronutrient fertilizer markets, accounting for 13.9% and 10.5% of the market share in 2022, respectively. The increase in micronutrient deficiency in Chinese crops resulted in 31.4% of micronutrient fertilizer consumption in 2022. The Ministry of Agriculture (MoA) of China added zinc, at a rate of 15-30 ZnSO4 kg/ha, to its national fertilizer recommendation, which was recently extended for summer crops like rice and corn.
- France is the major market for micronutrient fertilizer in Europe, followed by Ukraine, with a market value of USD 218.4 million in 2022. The area under the cultivation of horticultural crops decreased from 17.4 million hectares in 2017 to 15.6 million hectares in 2022. However, the figure is expected to increase further in the following years.
- Apart from Asia, zinc and iron deficiency in the soil is quite widespread in Sub-Saharan Africa and northwest South America. The overall advantages of micronutrient fertilizers are being widely accepted and recognized. The global export value of zinc in 2021 amounted to USD 1.6 million, with the Netherlands as the top exporter of the micronutrients, with a value of USD 275.6 thousand.
- The market is growing because of the widespread micronutrient deficiencies around the world, with iron and zinc deficiencies becoming a rising concern for plant health, and also due to the increasing encouragement from various government agencies to increase the use of micronutrients.
Global Micronutrient Fertilizer Market Trends
The rising pressure on the agriculture industry to meet the growing demand for food is expected to increase the area under field crop cultivation
- The global agricultural sector is currently facing many challenges. According to the UN, the world population may exceed 9 billion by 2050. This population growth may overburden the agricultural industry, which is already experiencing an output loss due to a lack of laborers and the shrinkage of agricultural fields caused by rising urbanization. According to the Food and Agriculture Organization, 70% of the global population is expected to live in cities by 2050. Due to the global loss of arable land, farmers now need to utilize more fertilizers to increase crop yields.
- The Asia-Pacific region is the world's largest producer of agricultural products. Agriculture is critical to the region's economy, as it employs about 20% of the total available workforce. Field crop cultivation dominates the region, accounting for about more than 95% of the total crop area in the region. Rice, wheat, and corn are the major field crops produced in the region, together accounting for about 24.3% of the total crop area in 2022.
- North America ranks as the second-largest arable region globally. Its farms cultivate a diverse range of crops, with a focus on field crops. Notably, corn, cotton, rice, soybean, and wheat are the prominent field crops, as highlighted by the USDA. In 2022, the United States commanded 46.2% of North America's crop cultivation area. However, the country witnessed a significant drop in crop acreage between 2017 and 2019, primarily due to adverse environmental conditions, leading to severe flooding in regions like Texas and Houston.
The Asia-Pacific region accounted for the highest average micronutrient application rate of 5.20 kg/hectare
- Due to high rates of nutrient loss from high-yielding crops, the demand for micronutrients has risen significantly. Micronutrient deficiency is a problem that affects almost all regions across the world. Globally, the average micronutrient application in field crops was 3.92 kg/hectare in 2022. Accordingly, manganese, zinc, and copper were estimated to be major nutrients with higher application rates in field crops in 2022, accounting for 9.53 kg/ha, 6.63 kg/ha, and 6.34 kg/ha, respectively.
- Rapeseed/canola led the pack with the highest average micronutrient application of 5.20 kg/ha in 2022, followed by rice and sorghum at 4.42 kg/ha and 4.37 kg/ha, respectively. Different crops and regions respond differently to micronutrients. For example, copper and manganese deficiencies are common in wheat, while boron deficiency is observed in wheat, and molybdenum is lacking in the Asia-Pacific region. In rapeseed/canola, zinc, manganese, and copper are the primary deficiencies.
- In 2022, Asia-Pacific had the highest average micronutrient application rate of 5.20 kg/ha, followed by South America with 4.37 kg/ha and North America with 4.21kg/ha. Micronutrient use in crop production has increased significantly in recent years as farmers strive to increase yield per planted hectare. To improve soil health and crop productivity and satisfy a growing population, crop yields must increase to meet food production demands. As a result, the global demand for micronutrient fertilizers and agricultural production is experiencing the most significant rise.
Micronutrient Fertilizer Industry Overview
The Micronutrient Fertilizer Market is moderately consolidated, with the top five companies occupying 57.38%. The major players in this market are Coromandel International Ltd., ICL Group Ltd, K+S Aktiengesellschaft, The Mosaic Company and Yara International ASA (sorted alphabetically).
Additional Benefits:
- The market estimate (ME) sheet in Excel format
- 3 months of analyst support
TABLE OF CONTENTS
1 EXECUTIVE SUMMARY & KEY FINDINGS
2 REPORT OFFERS
3 INTRODUCTION
- 3.1 Study Assumptions & Market Definition
- 3.2 Scope of the Study
- 3.3 Research Methodology
4 KEY INDUSTRY TRENDS
- 4.1 Acreage Of Major Crop Types
- 4.1.1 Field Crops
- 4.1.2 Horticultural Crops
- 4.2 Average Nutrient Application Rates
- 4.2.1 Micronutrients
- 4.2.1.1 Field Crops
- 4.2.1.2 Horticultural Crops
- 4.2.1 Micronutrients
- 4.3 Agricultural Land Equipped For Irrigation
- 4.4 Regulatory Framework
- 4.5 Value Chain & Distribution Channel Analysis
5 MARKET SEGMENTATION (includes market size in Value in USD and Volume, Forecasts up to 2030 and analysis of growth prospects)
- 5.1 Product
- 5.1.1 Boron
- 5.1.2 Copper
- 5.1.3 Iron
- 5.1.4 Manganese
- 5.1.5 Molybdenum
- 5.1.6 Zinc
- 5.1.7 Others
- 5.2 Application Mode
- 5.2.1 Fertigation
- 5.2.2 Foliar
- 5.2.3 Soil
- 5.3 Crop Type
- 5.3.1 Field Crops
- 5.3.2 Horticultural Crops
- 5.3.3 Turf & Ornamental
- 5.4 Region
- 5.4.1 Asia-Pacific
- 5.4.1.1 Australia
- 5.4.1.2 Bangladesh
- 5.4.1.3 China
- 5.4.1.4 India
- 5.4.1.5 Indonesia
- 5.4.1.6 Japan
- 5.4.1.7 Pakistan
- 5.4.1.8 Philippines
- 5.4.1.9 Thailand
- 5.4.1.10 Vietnam
- 5.4.1.11 Rest of Asia-Pacific
- 5.4.2 Europe
- 5.4.2.1 France
- 5.4.2.2 Germany
- 5.4.2.3 Italy
- 5.4.2.4 Netherlands
- 5.4.2.5 Russia
- 5.4.2.6 Spain
- 5.4.2.7 Ukraine
- 5.4.2.8 United Kingdom
- 5.4.2.9 Rest of Europe
- 5.4.3 Middle East & Africa
- 5.4.3.1 Nigeria
- 5.4.3.2 Saudi Arabia
- 5.4.3.3 South Africa
- 5.4.3.4 Turkey
- 5.4.3.5 Rest of Middle East & Africa
- 5.4.4 North America
- 5.4.4.1 Canada
- 5.4.4.2 Mexico
- 5.4.4.3 United States
- 5.4.4.4 Rest of North America
- 5.4.5 South America
- 5.4.5.1 Argentina
- 5.4.5.2 Brazil
- 5.4.5.3 Rest of South America
- 5.4.1 Asia-Pacific
6 COMPETITIVE LANDSCAPE
- 6.1 Key Strategic Moves
- 6.2 Market Share Analysis
- 6.3 Company Landscape
- 6.4 Company Profiles
- 6.4.1 BMS Micro-Nutrients NV
- 6.4.2 Coromandel International Ltd.
- 6.4.3 Haifa Group
- 6.4.4 ICL Group Ltd
- 6.4.5 K+S Aktiengesellschaft
- 6.4.6 Koch Industries Inc.
- 6.4.7 Nouryon
- 6.4.8 The Mosaic Company
- 6.4.9 Yara International ASA
7 KEY STRATEGIC QUESTIONS FOR FERTILIZER CEOS
8 APPENDIX
- 8.1 Global Overview
- 8.1.1 Overview
- 8.1.2 Porter's Five Forces Framework
- 8.1.3 Global Value Chain Analysis
- 8.1.4 Market Dynamics (DROs)
- 8.2 Sources & References
- 8.3 List of Tables & Figures
- 8.4 Primary Insights
- 8.5 Data Pack
- 8.6 Glossary of Terms