


|
시장보고서
상품코드
1693524
수용성 비료 시장 : 점유율 분석, 산업 동향, 성장 예측(2025-2030년)Water Soluble Fertilizer - Market Share Analysis, Industry Trends & Statistics, Growth Forecasts (2025 - 2030) |
||||||
■ 보고서에 따라 최신 정보로 업데이트하여 보내드립니다. 배송일정은 문의해 주시기 바랍니다.
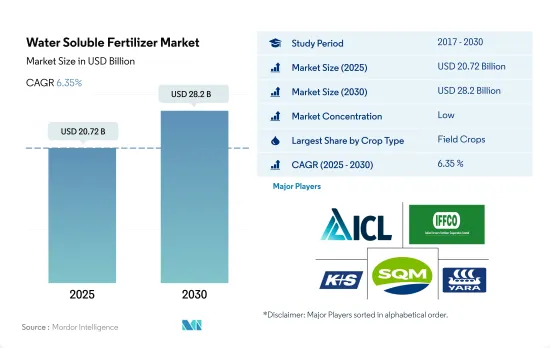
수용성 비료 시장 규모는 2025년에 207억 2,000만 달러, 2030년에는 282억 달러에 이르고, 예측 기간(2025-2030년)의 CAGR은 6.35%를 나타낼 전망입니다.

재배면적 확대가 수용성 비료 수요를 끌어올려 생산성을 향상시키고 있다.
- 농작물 재배가 세계적으로 우세하며 수용성 비료의 총소비량의 약 78.8%를 차지하고 있습니다. 이러한 작물 재배로 인해 2,910만 톤의 수용성 비료가 소비되었으며, 그 규모는 181억 9천만 달러에 달했습니다. 밭작물에 의한 수용성 비료의 소비량이 많은 것은 이러한 작물의 재배 면적이 넓기 때문입니다.
- 일반적으로 원예 작물은 스프링클러나 마이크로 관개 시스템과 같은 관개 설비가 갖추어져 있기 때문에 수용성 비료 수요가 많습니다. 원예 작물은 수용성 비료를 소비하는 두 번째로 큰 작물 유형이며, 2022년 세계의 수용성 비료 시장 규모의 약 18.8%를 차지하고 있습니다.
- 잔디 및 관상용 작물은 세계의 수용성 비료 시장의 약 3.5%를 차지해 98만 4,000톤을 소비합니다. 다양한 응용 분야에서 이러한 작물에 대한 수요 증가와 친환경 비료의 채택은 이러한 작물의 수용성 비료 시장을 확대하고 있습니다. 잔디 및 관상용 작물의 재배 면적이 증가하고 있기 때문에 시장의 CAGR은 5.4%를 나타낼 것으로 예측됩니다. 이는 오염에 대한 우려 증가와 미관을 중시한 조경과 에코 투어리즘의 중요성이 세계적으로 높아지고 있기 때문입니다.
- 따라서 각각의 작물 유형에 있어서의 수용성 비료의 세계 소비량은 2023-2030년에 걸쳐 성장할 것으로 예측됩니다.
농업 종사자가 작물의 수율을 극대화하는 것을 선호하기 때문에 시장은 성장을 목격하고 있습니다.
- 아시아태평양의 수용성 비료 시장은 시장 점유율의 43.9%를 차지하며 조사 기간 동안 안정적인 성장을 보이고 있으며, 이 지역 전체 시장 규모는 2022년에 101억 달러에 달할 전망입니다. 농작물이 81.6%로 최대의 점유율을 차지하고, 이어 원예작물이 뒤를 잇고 있습니다.
- 지난 몇 년 동안 중국의 수용성 비료 산업은 많은 이점으로 인해 현저한 성장과 개발을 경험해 왔습니다. 이 산업은 비료 사용량, 물, 노동력, 비용을 줄이는 동시에 작물의 수율과 품질을 향상시키는 효과적인 솔루션임이 입증되었습니다. 이 성장은 현대농업개발에 대한 정부의 호의적인 시책과 이 산업에 대한 엄청난 투자에 의해 촉진되고 있습니다.
- 북미의 특수 비료 시장은 수용성 비료가 대부분을 차지하고 있어 2022년 시장 점유율은 52.8%였습니다. 이러한 비료에 대한 수요는 이용가능한 다양한 영양 등급 및 특정 적용 요건에 따라 잎 표면 살포 및 관주와 같은 상이한 적용 모드에 의해 영향을 받습니다. 분석에 따르면 2022년 시장 점유율은 시비 모드가 54.7%를 차지했으며, 엽면 시비 모드는 45.3%였습니다.
- 최근 세계 농업 종사자들 사이에서 수용성 비료와 같은 특수 비료에 대한 수요가 상당히 급증하고 있습니다. 이 비료는 필요한 영양소를 곧바로 이용할 수 있는 형태로 작물에 공급해, 식물의 성장과 수량의 향상을 촉진하는 것으로 알려져 있습니다.
세계의 수용성 비료 시장 동향
증가하는 식량 수요를 충족시키기 위한 농업 산업에 대한 압력 증가로 농작물 재배 면적 증가가 예상된다.
- 세계 농업 분야는 현재 많은 과제에 직면하고 있습니다. 유엔 식량농업기관에 따르면 2050년까지 세계인구의 70%가 도시에 살게 될 것으로 예상되고 있습니다.
- 아시아태평양은 세계에서 가장 큰 농산물 생산지입니다. 지역의 총 작물 재배 면적의 95% 이상을 차지하고 있습니다.
- 북미는 세계 제2위의 경작 가능 지역입니다.그 농장에서는 농작물을 중심으로 다양한 작물이 재배되고 있습니다. 작물 재배 면적의 46.2%를 차지했습니다. 그러나, 이 나라는 2017-2019년에 걸쳐 작물 재배 면적의 대폭적인 감소를 확인했지만, 이것은 주로 텍사스나 휴스턴과 같은 지역에서 심각한 홍수로 이어지는 악환경 조건 때문입니다.
농작물에서 1차 양분의 질소, 칼륨, 인의 세계 평균 시용량은 164.31 kg/ha
- 옥수수, 유채, 면화, 소르감, 벼, 밀, 간장은 세계적으로 주요 양분 집약 작물입니다. kg/ha, 120.97 kg/ha였습니다. 1차 양분 비료는 식물의 중요한 대사 과정을 촉진하고 세포, 세포막, 엽록소 등의 주요 조직의 형성에 기여하기 때문에 작물에 있어서 필수적입니다.
- 농작물에서 질소, 칼륨, 인의 세계 평균 시용량은 164.31kg/ha입니다.
- 2022년의 질소 시용량은 유채가 347.4 kg/ha로 가장 많고, 인 시용량은 옥수수가 156.3 kg/ha로 톱이었습니다.
- 세계 농작물의 재배면적은 증가 경향에 있으며, 특히 남미와 아시아태평양이 비료의 잠재적 성장시장이 되고 있습니다.
수용성 비료 산업 개요
수용성 비료 시장은 세분화되어 있으며 상위 5개 기업에서 27.25%를 차지하고 있습니다.
기타 혜택
- 엑셀 형식 시장 예측(ME) 시트
- 3개월의 애널리스트 서포트
목차
제1장 주요 요약과 주요 조사 결과
제2장 보고서 제안
제3장 소개
- 조사의 전제조건과 시장 정의
- 조사 범위
- 조사 방법
제4장 주요 산업 동향
- 주요 작물의 작부 면적
- 밭작물
- 원예작물
- 평균 양분 시용률
- 미량영양소
- 밭작물
- 원예작물
- 1차 영양소
- 밭작물
- 원예작물
- 2차 다량 영양소
- 밭작물
- 원예작물
- 미량영양소
- 관개 농지
- 규제 프레임워크
- 밸류체인과 유통채널 분석
제5장 시장 세분화
- 유형
- 복합형
- 스트레이트
- 영양소별
- 미량영양소
- 질소
- 인산
- 칼륨
- 2차 다량 영양소
- 적용 모드
- 시비
- 잎면 살포
- 작물 유형
- 밭작물
- 원예작물
- 잔디 및 관상용
- 지역
- 아시아태평양
- 호주
- 방글라데시
- 중국
- 인도
- 인도네시아
- 일본
- 파키스탄
- 필리핀
- 태국
- 베트남
- 기타 아시아태평양
- 유럽
- 프랑스
- 독일
- 이탈리아
- 네덜란드
- 러시아
- 스페인
- 우크라이나
- 영국
- 기타 유럽
- 중동 및 아프리카
- 나이지리아
- 사우디아라비아
- 남아프리카
- 튀르키예
- 기타 중동 및 아프리카
- 북미
- 캐나다
- 멕시코
- 미국
- 기타 북미
- 남미
- 아르헨티나
- 브라질
- 기타 남미
- 아시아태평양
제6장 경쟁 구도
- 주요 전략 동향
- 시장 점유율 분석
- 기업 상황
- 기업 프로파일
- BMS Micro-Nutrients NV
- Coromandel International Ltd.
- Grupa Azoty SA(Compo Expert)
- Haifa Group
- ICL Group Ltd
- Indian Farmers Fertiliser Cooperative Limited
- KS Aktiengesellschaft
- Sociedad Quimica y Minera de Chile SA
- Yara International ASA
제7장 CEO에 대한 주요 전략적 질문
제8장 부록
- 세계 개요
- 개요
- Five Forces 분석 프레임워크
- 세계의 밸류체인 분석
- 시장 역학(DROs)
- 정보원과 참고문헌
- 도표 일람
- 주요 인사이트
- 데이터 팩
- 용어집
The Water Soluble Fertilizer Market size is estimated at 20.72 billion USD in 2025, and is expected to reach 28.2 billion USD by 2030, growing at a CAGR of 6.35% during the forecast period (2025-2030).
The expansion of cultivation areas is driving the demand for water-soluble fertilizers, improving productivity
- Field crop cultivation dominates globally, accounting for about 78.8% of the total water-soluble fertilizer consumption. The cultivation of these crops led to a consumption of 29.1 million metric tons of water-soluble fertilizers, valued at USD 18.19 billion. The large consumption of water-soluble fertilizers by field crops was due to the large area under the cultivation of these crops. More than 90.0% of the global agricultural land is dedicated to the cultivation of field crops.
- Generally, there is more demand for water-soluble fertilizers in horticultural crops, as they are well-equipped for irrigation like sprinkler or micro irrigation systems. Water-soluble fertilizers can be applied using the foliar or fertigation method. Horticultural crops are the second-largest crop types that consume water-soluble fertilizers, and they accounted for about 18.8% of the global water-soluble fertilizer market volume in 2022. Foliar water-soluble fertilizers play an important role in fruit crops, as foliar spraying is known to improve the quality of the fruits.
- Turf & ornamental crops account for about 3.5% of the global water-soluble fertilizer market volume and consume 984.0 thousand million metric tons. The growing demand for these crops in various applications and the adoption of environmentally friendly fertilizers are increasing the market for water-soluble fertilizers in these crops. The market is expected to register a CAGR of 5.4% due to the increasing area under cultivation of turf & ornamental crops. This is due to the increasing concern over pollution and the growing importance of aesthetic landscaping gardens and ecotourism globally.
- Therefore, the global consumption of water-soluble fertilizers in respective crop types is anticipated to grow during 2023-2030.
The market is witnessing growth as farmers prioritize maximizing crop yields
- The Asia-Pacific water-soluble fertilizer market accounted for 43.9% of the market share and witnessed stable growth during the study period, with an overall value in the region amounting to USD 10.1 billion in 2022. Field crops occupied the largest share of 81.6%, followed by horticultural crops.
- Over the past few years, the soluble fertilizer industry in China has experienced significant growth and development due to its numerous benefits. This industry has proven to be an effective solution for reducing fertilizer usage, water, labor, and cost while simultaneously increasing crop yield and quality. This growth has been facilitated by the government's favorable policies toward modern agriculture development and substantial investment in the industry.
- The market for specialty fertilizers in North America is largely dominated by water-soluble fertilizers, which held a market share of 52.8% in 2022. The demand for these fertilizers is influenced by the variety of nutrient grades available, as well as the different application modes such as foliar or fertigation, depending on the specific application requirements. Based on the analysis, the fertigation mode accounted for 54.7% of the market share in 2022, while the foliar application mode accounted for 45.3%.
- In recent years, there has been a considerable surge in the demand for specialized fertilizers, such as water-soluble fertilizers, among farmers worldwide. The primary reason behind this trend is that farmers are increasingly looking to maximize their crop yield per hectare. These fertilizers are known to provide the required nutrients to the crops in a readily available form, promoting better plant growth and yield. As a result, the market is expected to continue to grow during 2023-2030.
Global Water Soluble Fertilizer Market Trends
The rising pressure on the agriculture industry to meet the growing food demand is expected to increase the area under field crop cultivation
- The global agricultural sector is currently facing many challenges. According to the United Nations, the world population may exceed 9 billion by 2050. This population growth could overburden the agricultural industry, which is already experiencing an output loss due to a lack of laborers and the shrinkage of agricultural fields caused by rising urbanization. According to the Food and Agriculture Organization, 70% of the global population is expected to live in cities by 2050. Due to the global loss of arable land, farmers now need to utilize more fertilizers to increase crop yields.
- Asia-Pacific is the world's largest producer of agricultural products. Agriculture is critical to the region's economy, as it employs about 20% of the total available workforce. Field crop cultivation dominates the region, accounting for more than 95% of the total crop area in the region. Rice, wheat, and corn are the major field crops produced in the region, together accounting for about 24.3% of the total crop area in 2022.
- North America ranks as the second-largest arable region globally. Its farms cultivate a diverse range of crops, with a focus on field crops. Notably, corn, cotton, rice, soybean, and wheat are the prominent field crops, as highlighted by the USDA. In 2022, the United States accounted for 46.2% of North America's crop cultivation area. However, the country witnessed a significant drop in crop acreage between 2017 and 2019, primarily due to adverse environmental conditions, leading to severe flooding in regions like Texas and Houston.
The global average application rate of primary nutrient nitrogen, potassium, and phosphorus in field crops is 164.31 kg/ha
- Corn, rapeseed, cotton, sorghum, rice, wheat, and soybean are among the primary nutrient-intensive crops globally. The average application rates for primary nutrients in these crops were 230.57 kg/ha, 255.75 kg/ha, 172.70 kg/ha, 158.46 kg/ha, 154.49 kg/ha, 135.35 kg/ha, and 120.97 kg/ha, respectively. Primary nutrient fertilizers are vital for crops as they facilitate crucial plant metabolic processes and contribute to the formation of key tissues, including cells, cell membranes, and chlorophyll. Phosphorus is pivotal for cultivating high-quality crops, while potassium activates enzymes crucial for plant growth.
- The global average application rate for nitrogen, potassium, and phosphorus in field crops stands at 164.31 kg/ha. Nitrogen leads the pack as the most widely used primary nutrient fertilizer, with an application rate of 224.6 kg/ha, followed by potassic fertilizers at 150.3 kg/ha. Phosphorus ranks third, with an application rate of 117.9 kg/ha in 2022.
- In 2022, rapeseed recorded the highest nitrogen application rate at 347.4 kg/ha, while corn topped the phosphorus application rate at 156.3 kg/ha. Canola took the lead for potassium application, with a rate of 248.6 kg/ha.
- The global cultivation area for field crops is on the rise, notably in South America and the Asia-Pacific region, making them potential growth markets for fertilizers. Developed regions like Europe and North America, along with areas grappling with nutrient deficiencies, are increasingly turning to specialty fertilizers for their efficacy. These factors are poised to propel the primary nutrient fertilizers market in the coming years.
Water Soluble Fertilizer Industry Overview
The Water Soluble Fertilizer Market is fragmented, with the top five companies occupying 27.25%. The major players in this market are ICL Group Ltd, Indian Farmers Fertiliser Cooperative Limited, K+S Aktiengesellschaft, Sociedad Quimica y Minera de Chile SA and Yara International ASA (sorted alphabetically).
Additional Benefits:
- The market estimate (ME) sheet in Excel format
- 3 months of analyst support
TABLE OF CONTENTS
1 EXECUTIVE SUMMARY & KEY FINDINGS
2 REPORT OFFERS
3 INTRODUCTION
- 3.1 Study Assumptions & Market Definition
- 3.2 Scope of the Study
- 3.3 Research Methodology
4 KEY INDUSTRY TRENDS
- 4.1 Acreage Of Major Crop Types
- 4.1.1 Field Crops
- 4.1.2 Horticultural Crops
- 4.2 Average Nutrient Application Rates
- 4.2.1 Micronutrients
- 4.2.1.1 Field Crops
- 4.2.1.2 Horticultural Crops
- 4.2.2 Primary Nutrients
- 4.2.2.1 Field Crops
- 4.2.2.2 Horticultural Crops
- 4.2.3 Secondary Macronutrients
- 4.2.3.1 Field Crops
- 4.2.3.2 Horticultural Crops
- 4.2.1 Micronutrients
- 4.3 Agricultural Land Equipped For Irrigation
- 4.4 Regulatory Framework
- 4.5 Value Chain & Distribution Channel Analysis
5 MARKET SEGMENTATION (includes market size in Value in USD and Volume, Forecasts up to 2030 and analysis of growth prospects)
- 5.1 Type
- 5.1.1 Complex
- 5.1.2 Straight
- 5.1.2.1 By Nutrient
- 5.1.2.1.1 Micronutrients
- 5.1.2.1.2 Nitrogenous
- 5.1.2.1.3 Phosphatic
- 5.1.2.1.4 Potassic
- 5.1.2.1.5 Secondary Macronutrients
- 5.2 Application Mode
- 5.2.1 Fertigation
- 5.2.2 Foliar
- 5.3 Crop Type
- 5.3.1 Field Crops
- 5.3.2 Horticultural Crops
- 5.3.3 Turf & Ornamental
- 5.4 Region
- 5.4.1 Asia-Pacific
- 5.4.1.1 Australia
- 5.4.1.2 Bangladesh
- 5.4.1.3 China
- 5.4.1.4 India
- 5.4.1.5 Indonesia
- 5.4.1.6 Japan
- 5.4.1.7 Pakistan
- 5.4.1.8 Philippines
- 5.4.1.9 Thailand
- 5.4.1.10 Vietnam
- 5.4.1.11 Rest of Asia-Pacific
- 5.4.2 Europe
- 5.4.2.1 France
- 5.4.2.2 Germany
- 5.4.2.3 Italy
- 5.4.2.4 Netherlands
- 5.4.2.5 Russia
- 5.4.2.6 Spain
- 5.4.2.7 Ukraine
- 5.4.2.8 United Kingdom
- 5.4.2.9 Rest of Europe
- 5.4.3 Middle East & Africa
- 5.4.3.1 Nigeria
- 5.4.3.2 Saudi Arabia
- 5.4.3.3 South Africa
- 5.4.3.4 Turkey
- 5.4.3.5 Rest of Middle East & Africa
- 5.4.4 North America
- 5.4.4.1 Canada
- 5.4.4.2 Mexico
- 5.4.4.3 United States
- 5.4.4.4 Rest of North America
- 5.4.5 South America
- 5.4.5.1 Argentina
- 5.4.5.2 Brazil
- 5.4.5.3 Rest of South America
- 5.4.1 Asia-Pacific
6 COMPETITIVE LANDSCAPE
- 6.1 Key Strategic Moves
- 6.2 Market Share Analysis
- 6.3 Company Landscape
- 6.4 Company Profiles
- 6.4.1 BMS Micro-Nutrients NV
- 6.4.2 Coromandel International Ltd.
- 6.4.3 Grupa Azoty S.A. (Compo Expert)
- 6.4.4 Haifa Group
- 6.4.5 ICL Group Ltd
- 6.4.6 Indian Farmers Fertiliser Cooperative Limited
- 6.4.7 K+S Aktiengesellschaft
- 6.4.8 Sociedad Quimica y Minera de Chile SA
- 6.4.9 Yara International ASA
7 KEY STRATEGIC QUESTIONS FOR FERTILIZER CEOS
8 APPENDIX
- 8.1 Global Overview
- 8.1.1 Overview
- 8.1.2 Porter's Five Forces Framework
- 8.1.3 Global Value Chain Analysis
- 8.1.4 Market Dynamics (DROs)
- 8.2 Sources & References
- 8.3 List of Tables & Figures
- 8.4 Primary Insights
- 8.5 Data Pack
- 8.6 Glossary of Terms


샘플 요청 목록