|
시장보고서
상품코드
1693526
특수 비료 시장 : 점유율 분석, 산업 동향 및 통계, 성장 예측(2025-2030년)Specialty Fertilizer - Market Share Analysis, Industry Trends & Statistics, Growth Forecasts (2025 - 2030) |
||||||
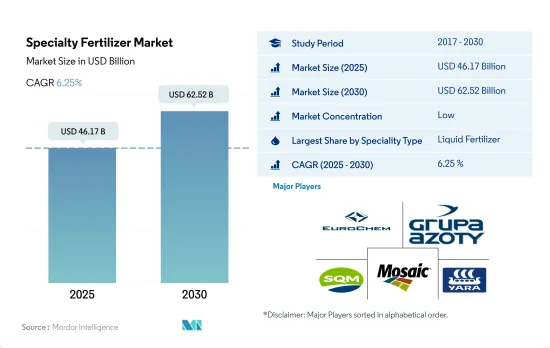
세계의 특수 비료 시장 규모는 2025년 461억 7,000만 달러로 추정되고, 2030년에는 625억 2,000만 달러에 이르고, 예측 기간 중(2025-2030년) CAGR 6.25%를 나타낼 것으로 예측됩니다.

고영양 효율 비료 수요가 특수 비료 수요를 견인
- 2022년 세계 특수비료시장은 세계 비료시장 전체의 약 12.0%를 차지했으며, 평가액은 약 517억 4,000만 달러였습니다. 조사 기간 중, 동 시장은 83.8%의 강한 성장을 이룰 것으로 보입니다. 이 급성장은 환경 문제에 대한 관심의 고조에 의한 것으로, 2023-2030년간 특수 비료 시장을 촉진할 것으로 예측되고 있습니다.
- 수용성 비료는 시장 전체의 약 44.6%를 차지하고 아시아태평양과 북미가 압도적인 점유율을 차지하고 있습니다.
- 2023년부터 2030년까지 완효성 비료의 소비량은 현저한 증가를 보이고 CAGR은 3.7%가 될 것으로 예측되고 있습니다. 이 변화는 농가와 생산자가 환경에 대한 영향을 최소화하면서 작물의 수율과 품질을 향상시키는 완효성 비료의 이점을 인식하고 있는 것이 배경에 있습니다.
- 게다가 시비의 용이함, 균일한 분배, 비용 대비 효과에 의해 액체 비료로의 전환이 현저해지고 있습니다.
- 예측 기간에 있어서의 세계의 특수 비료 시장의 주된 촉진요인으로서는 비료 사용 효율의 향상, 특수 비료의 채용 급증, 농지 전체에 있어서의 스프링클러나 마이크로 관개 시스템의 선호의 고조등을 들 수 있습니다.
아시아태평양은 특수 비료의 최대 시장입니다.
- 2022년에는 아시아태평양이 특수 비료 시장에서 가장 큰 점유율을 차지했으며, 그 총액의 45.8%를 차지했습니다.
- 농작 분야에서는 중국이 최대로로, 특수 비료 시장의 금액의 43.04%를 차지했습니다. 인도는 17.15%로 뒤를 이었고, 일본은 약 16.35%, 인도네시아는 5.67%였습니다.
- 북미는 세계 2위 특수 비료 시장으로 부상해 2022년에는 약 125억 9,000만 달러였고, 그 총액의 24.8%를 차지했습니다.
- 남미는 세계의 특수 비료 시장의 약 18.48%를 차지해 2021년에는 약 30억 4,000만 달러에 달했습니다.
- 특수 비료 시장은 2020년에 COVID-19의 대유행에 의한 공급 체인의 혼란으로 침체됐던 것을 제외하면 수량 및 금액 모두 일관된 성장을 보였습니다.
- 세계적으로 과잉 사용에 기인하는 비료 오염에 대한 우려의 고조는 향후 수년간, 세계의 특수 비료 시장을 추진할 자세입니다.
세계특수비료시장 동향
밭 작물은 세계의 주식이며, 밭 작물의 재배 면적은 향후 수년간 확대됩니다.
- 세계의 농업 부문은 많은 과제에 직면하고 있습니다. 유엔에 따르면 세계 인구는 2050년까지 90억 명을 넘을 가능성이 높습니다. 2050년까지 세계 인구의 70%가 도시에 살게 될 것으로 예상되고 있습니다.
- 아시아태평양은 세계에서 가장 큰 농산물 생산지입니다. 밭 작물 재배가 이 지역을 지배하고 있으며, 지역 전체의 작물 재배 면적의 약 95% 이상을 차지하고 있습니다.
- 북미는 세계 제2위의 경지 면적을 자랑하는 지역입니다. 북미의 농장에서는 농작물을 중심으로 다양한 작물이 재배되고 있습니다. 미국은 2022년 북미 전체 작물 재배 면적의 작물 재배 면적의 46.2%를 차지해 시장을 독점했습니다.
전체 영양소 중에서 1차 양분(N, P, K)의 평균 시용량은 164.3kg/헥타르로 가장 많습니다.
- 옥수수, 캐놀라, 면화, 사탕수수, 쌀, 밀, 간장은 세계적으로 주요 양분 집약형 작물의 상위에 랭크되고 있습니다. 주 영양소 비료는 작물의 성장에 매우 중요하고, 식물의 중요한 대사 과정을 촉진하고, 세포, 세포막, 엽록소 등의 중요한 식물 조직의 형성을 돕습니다.
- 농작물에서 질소, 칼륨, 인의 세계 평균 시용량은 164.31kg/ha입니다.
- 2022년 질소 시용량은 유채가 347.4kg/ha로 가장 많았고, 인 시용량은 옥수수가 156.3kg/ha로 가장 많았습니다. 세계의 밭작물의 재배 면적은 증가 경향에 있으며, 남미와 아시아태평양이 현저한 성장을 나타내고 있습니다. 유럽과 북미와 같은 개발 지역은 영양 부족에 고민하는 지역과 함께, 그 유효성으로부터 특수 비료에 눈을 돌리게 되어 왔습니다. 이러한 동향은 2023-2030년간의 1차 영양 비료 시장을 촉진할 것으로 예상됩니다.
특수 비료 산업 개요
특수 비료 시장은 세분화되어 있으며 주요 5개사에서 30.38%를 차지하고 있습니다. 이 시장 주요 기업은 EuroChem Group, Grupa Azoty S.A.(Compo Expert), Sociedad Quimica y Minera de Chile SA, The Mosaic Company, Yara International ASA(알파벳순) 입니다.
기타 혜택
- 엑셀 형식 시장 예측(ME) 시트
- 3개월의 애널리스트 서포트
목차
제1장 주요 요약과 주요 조사 결과
제2장 보고서 제안
제3장 소개
- 조사의 전제조건과 시장 정의
- 조사 범위
- 조사 방법
제4장 주요 산업 동향
- 주요 작물의 작부 면적
- 밭 작물
- 원예 작물
- 평균 양분 시용률
- 미량 영양소
- 밭 작물
- 원예 작물
- 1차 영양소
- 밭 작물
- 원예 작물
- 2차 다량 영양소
- 밭 작물
- 원예 작물
- 미량 영양소
- 관개 농지
- 규제 프레임워크
- 밸류체인과 유통채널 분석
제5장 시장 세분화
- 특수 유형
- CRF
- 폴리머 코트
- 폴리머 유황 코팅
- 기타
- 액체 비료
- SRF
- 수용성
- CRF
- 시비 모드
- 시비
- 엽면 살포
- 토양
- 작물 유형
- 밭 작물
- 원예 작물
- 잔디 및 관상용
- 지역
- 아시아태평양
- 호주
- 방글라데시
- 중국
- 인도
- 인도네시아
- 일본
- 파키스탄
- 필리핀
- 태국
- 베트남
- 기타 아시아태평양
- 유럽
- 프랑스
- 독일
- 이탈리아
- 네덜란드
- 러시아
- 스페인
- 우크라이나
- 영국
- 기타 유럽
- 중동 및 아프리카
- 나이지리아
- 사우디아라비아
- 남아프리카
- 튀르키예
- 기타 중동 및 아프리카
- 북미
- 캐나다
- 멕시코
- 미국
- 기타 북미
- 남미
- 아르헨티나
- 브라질
- 기타 남미
- 아시아태평양
제6장 경쟁 구도
- 주요 전략 동향
- 시장 점유율 분석
- 기업 상황
- 기업 프로파일
- Coromandel International Ltd.
- EuroChem Group
- Grupa Azoty SA(Compo Expert)
- Haifa Group
- Kingenta Ecological Engineering Group Co., Ltd.
- Koch Industries Inc.
- Nutrien Ltd.
- Sociedad Quimica y Minera de Chile SA
- The Mosaic Company
- Yara International ASA
제7장 CEO에 대한 주요 전략적 질문
제8장 부록
- 세계 개요
- 개요
- Porter's Five Forces 분석 프레임워크
- 세계의 밸류체인 분석
- 시장 역학(DROs)
- 정보원과 참고문헌
- 도표 일람
- 주요 인사이트
- 데이터 팩
- 용어집
The Specialty Fertilizer Market size is estimated at 46.17 billion USD in 2025, and is expected to reach 62.52 billion USD by 2030, growing at a CAGR of 6.25% during the forecast period (2025-2030).
The demand for high nutrient-efficient fertilizers is driving the demand for specialty fertilizers
- In 2022, the global specialty fertilizers market represented approximately 12.0% of the total global fertilizer market, with a valuation of around USD 51.74 billion. Over the study period, the market witnessed a robust growth of 83.8%. This surge can be attributed to the rising environmental concerns, which are anticipated to propel the specialty fertilizer market during 2023-2030.
- Water-soluble fertilizers, constituting roughly 44.6% of the market value, are predominantly dominated by Asia-Pacific and North America. Together, these regions commanded over 70.3% of the global water-soluble fertilizer market in 2022.
- Between 2023 and 2030, the consumption of slow-release fertilizers is projected to witness a notable uptick, with a CAGR of 3.7%. Simultaneously, the market value for these fertilizers is expected to register a CAGR of 6.1%. This shift is driven by farmers and growers recognizing the benefits of slow-release fertilizers in enhancing crop yields and quality while minimizing environmental impact.
- Moreover, there is a discernible shift toward liquid fertilizers, driven by their ease of application, uniform distribution, and cost-effectiveness. These factors are projected to fuel the liquid fertilizer market, with an estimated CAGR of 5.8% during 2023-2030.
- Key drivers for the global specialty fertilizer market in the forecast period include heightened fertilizer-use efficiency, a surge in specialty fertilizer adoption, and an increasing preference for sprinklers or micro-irrigation systems across agricultural lands.
Asia-Pacific region is the largest market for specialty fertilizers.
- In 2022, Asia-Pacific held the largest share of the specialty fertilizer market, accounting for 45.8% of its total value. Field crops dominated the region's specialty fertilizer consumption, representing 83.5% of the volume. Horticultural crops followed at 13.7%, while turf and ornamental crops lagged behind at under 1%.
- China led the pack in the field crops segment, commanding 43.04% of the specialty fertilizer market's value. India trailed at 17.15%, with Japan at roughly 16.35%, and Indonesia at 5.67%. Australia secured a 4.07% share of the Asia-Pacific specialty fertilizer market in 2022.
- North America emerged as the second-largest specialty fertilizer market globally, capturing 24.8% of its total value, amounting to approximately USD 12.59 billion in 2022. Field crops dominated the North American market, accounting for 86.8% of the consumption, while turf and ornamental crops held a 7.6% share, and horticultural crops claimed 6.2%.
- South America contributed around 18.48% to the global specialty fertilizer market, valued at roughly USD 3.04 billion in 2021. Brazil stood out as the dominant player in the South American market, with its specialty fertilizer market reaching USD 1.75 billion in 2022, and a consumption volume of 2.0 million metric tons.
- The specialty fertilizer market witnessed a consistent growth in volume and value, barring a dip in 2020 due to supply chain disruptions triggered by the COVID-19 pandemic.
- Mounting concerns over fertilizer pollution, stemming from global overuse, are poised to propel the global specialty fertilizer market in the coming years.
Global Specialty Fertilizer Market Trends
Field crops being the staple food across the globe, area under field crops will grow in the coming years.
- The global agricultural sector is facing many challenges. According to the UN, the world population will likely exceed nine billion by 2050. This population growth may overburden the agricultural industry, which is already experiencing an output loss due to a lack of laborers and the shrinkage of agricultural fields caused by rising urbanization. According to the Food and Agriculture Organization, 70% of the global population is expected to live in cities by 2050. Due to the global loss of arable land, farmers now need to utilize more fertilizers to increase crop yields.
- Asia-Pacific is the world's largest producer of agricultural products. Agriculture is critical to the region's economy, as it employs about 20% of the total available workforce. Field crop cultivation dominates the region, accounting for about more than 95% of the total crop area in the region. Rice, wheat, and corn are the major field crops produced in the region, together accounting for about 24.3% of the total crop area in 2022.
- North America is the second-largest arable region of the total agricultural land area in the world. Diverse varieties of crops are grown in North American farms, primarily field crops. As per the USDA, corn, cotton, rice, soybean, and wheat are among the region's dominant field crops. The United States dominated the market by accounting for 46.2% of the total area under crop cultivation in 2022 of the overall North American area under cultivation. Crop acreage in the country fell significantly between 2017 and 2019, primarily due to unfavorable environmental conditions that resulted in heavy floods in areas such as Texas and Houston.
Among all nutrients, primary nutrients (N, P, and K) have the highest average application rate at 164.3 kg/hectares.
- Corn/maize, rapeseed/canola, cotton, sorghum, rice, wheat, and soybean rank among the primary nutrient-intensive crops globally. The application rates for primary nutrients in these crops were as follows: corn/maize - 230.57 kg/ha, rapeseed/canola - 255.75 kg/ha, cotton - 172.70 kg/ha, sorghum - 158.46 kg/ha, rice - 154.49 kg/ha, wheat - 135.35 kg/ha, and soybean - 120.97 kg/ha. Primary nutrient fertilizers are pivotal for crop growth, facilitating vital plant metabolic processes and aiding in the formation of crucial plant tissues like cells, cell membranes, and chlorophyll. Phosphorus is particularly vital for cultivating high-quality crops, while potassium plays a key role in activating enzymes essential for plant growth.
- The global average application rate for nitrogen, potassium, and phosphorus in field crops stands at 164.31 kg/ha. Nitrogen emerges as the most widely used primary nutrient fertilizer, with an average application rate of 224.6 kg/ha, followed by potassic fertilizers at 150.3 kg/ha. Phosphorus ranks third, with an average application rate of 117.9 kg/ha in 2022.
- In 2022, rapeseed recorded the highest nitrogen application rate at 347.4 kg/ha, while corn/maize led in phosphorus application at 156.3 kg/ha. Canola took the lead in potassium application, with a rate of 248.6 kg/ha. The global cultivation area for field crops is on the rise, with South America and Asia-Pacific witnessing notable growth. These regions are emerging as potential markets for fertilizers. Developed regions like Europe and North America, along with areas grappling with nutrient deficiencies, are increasingly turning to specialty fertilizers for their efficacy. These trends are expected to propel the primary nutrient fertilizers market during 2023-2030.
Specialty Fertilizer Industry Overview
The Specialty Fertilizer Market is fragmented, with the top five companies occupying 30.38%. The major players in this market are EuroChem Group, Grupa Azoty S.A. (Compo Expert), Sociedad Quimica y Minera de Chile SA, The Mosaic Company and Yara International ASA (sorted alphabetically).
Additional Benefits:
- The market estimate (ME) sheet in Excel format
- 3 months of analyst support
TABLE OF CONTENTS
1 EXECUTIVE SUMMARY & KEY FINDINGS
2 REPORT OFFERS
3 INTRODUCTION
- 3.1 Study Assumptions & Market Definition
- 3.2 Scope of the Study
- 3.3 Research Methodology
4 KEY INDUSTRY TRENDS
- 4.1 Acreage Of Major Crop Types
- 4.1.1 Field Crops
- 4.1.2 Horticultural Crops
- 4.2 Average Nutrient Application Rates
- 4.2.1 Micronutrients
- 4.2.1.1 Field Crops
- 4.2.1.2 Horticultural Crops
- 4.2.2 Primary Nutrients
- 4.2.2.1 Field Crops
- 4.2.2.2 Horticultural Crops
- 4.2.3 Secondary Macronutrients
- 4.2.3.1 Field Crops
- 4.2.3.2 Horticultural Crops
- 4.2.1 Micronutrients
- 4.3 Agricultural Land Equipped For Irrigation
- 4.4 Regulatory Framework
- 4.5 Value Chain & Distribution Channel Analysis
5 MARKET SEGMENTATION (includes market size in Value in USD and Volume, Forecasts up to 2030 and analysis of growth prospects)
- 5.1 Speciality Type
- 5.1.1 CRF
- 5.1.1.1 Polymer Coated
- 5.1.1.2 Polymer-Sulfur Coated
- 5.1.1.3 Others
- 5.1.2 Liquid Fertilizer
- 5.1.3 SRF
- 5.1.4 Water Soluble
- 5.1.1 CRF
- 5.2 Application Mode
- 5.2.1 Fertigation
- 5.2.2 Foliar
- 5.2.3 Soil
- 5.3 Crop Type
- 5.3.1 Field Crops
- 5.3.2 Horticultural Crops
- 5.3.3 Turf & Ornamental
- 5.4 Region
- 5.4.1 Asia-Pacific
- 5.4.1.1 Australia
- 5.4.1.2 Bangladesh
- 5.4.1.3 China
- 5.4.1.4 India
- 5.4.1.5 Indonesia
- 5.4.1.6 Japan
- 5.4.1.7 Pakistan
- 5.4.1.8 Philippines
- 5.4.1.9 Thailand
- 5.4.1.10 Vietnam
- 5.4.1.11 Rest of Asia-Pacific
- 5.4.2 Europe
- 5.4.2.1 France
- 5.4.2.2 Germany
- 5.4.2.3 Italy
- 5.4.2.4 Netherlands
- 5.4.2.5 Russia
- 5.4.2.6 Spain
- 5.4.2.7 Ukraine
- 5.4.2.8 United Kingdom
- 5.4.2.9 Rest of Europe
- 5.4.3 Middle East & Africa
- 5.4.3.1 Nigeria
- 5.4.3.2 Saudi Arabia
- 5.4.3.3 South Africa
- 5.4.3.4 Turkey
- 5.4.3.5 Rest of Middle East & Africa
- 5.4.4 North America
- 5.4.4.1 Canada
- 5.4.4.2 Mexico
- 5.4.4.3 United States
- 5.4.4.4 Rest of North America
- 5.4.5 South America
- 5.4.5.1 Argentina
- 5.4.5.2 Brazil
- 5.4.5.3 Rest of South America
- 5.4.1 Asia-Pacific
6 COMPETITIVE LANDSCAPE
- 6.1 Key Strategic Moves
- 6.2 Market Share Analysis
- 6.3 Company Landscape
- 6.4 Company Profiles
- 6.4.1 Coromandel International Ltd.
- 6.4.2 EuroChem Group
- 6.4.3 Grupa Azoty S.A. (Compo Expert)
- 6.4.4 Haifa Group
- 6.4.5 Kingenta Ecological Engineering Group Co., Ltd.
- 6.4.6 Koch Industries Inc.
- 6.4.7 Nutrien Ltd.
- 6.4.8 Sociedad Quimica y Minera de Chile SA
- 6.4.9 The Mosaic Company
- 6.4.10 Yara International ASA
7 KEY STRATEGIC QUESTIONS FOR FERTILIZER CEOS
8 APPENDIX
- 8.1 Global Overview
- 8.1.1 Overview
- 8.1.2 Porter's Five Forces Framework
- 8.1.3 Global Value Chain Analysis
- 8.1.4 Market Dynamics (DROs)
- 8.2 Sources & References
- 8.3 List of Tables & Figures
- 8.4 Primary Insights
- 8.5 Data Pack
- 8.6 Glossary of Terms