


|
시장보고서
상품코드
1693589
민간 항공 시장 : 점유율 분석, 산업 동향 및 통계, 성장 예측(2025-2030년)Commercial Aviation - Market Share Analysis, Industry Trends & Statistics, Growth Forecasts (2025 - 2030) |
||||||
■ 보고서에 따라 최신 정보로 업데이트하여 보내드립니다. 배송일정은 문의해 주시기 바랍니다.
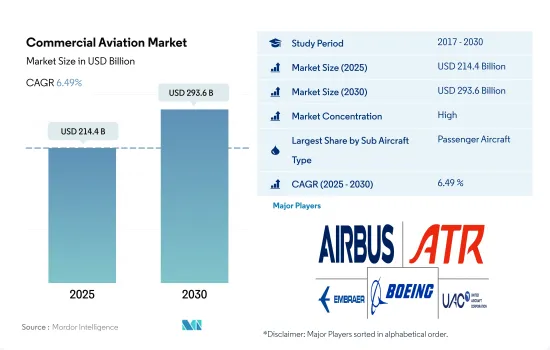
세계의 민간 항공 시장 규모는 2025년 2,144억 달러로 추정되고, 2030년에는 2,936억 달러에 이를 것으로 예상되고, 예측 기간 중(2025-2030년) CAGR 6.49%로 성장할 것으로 예측됩니다.

항공 여객 수송량 증가와 연비가 좋고 최신식 항공기에 대한 수요 증가가 세계적으로 민간 항공 산업을 밀어올릴 것으로 예측됩니다.
- 유엔 세계관광기관(UNWTO)에 따르면 관광업은 세계 GDP의 10%에 기여하고 있으며, 현대세계의 주요 수입원 중 하나가 되고 있습니다.
- 그러나 민간항공산업은 2022년에 서서히 회복되었으며, 그 결과 항공기 납품수는 2021년에 비해 크게 증가했습니다. 항공사는 더 나은 연료 효율과 항속 거리를 가진 항공기를 요구하고 있으며, 새로운 항공기 개발은 OEM이 앞으로 몇 년 동안 더 많은 항공사의 고객을 유치하는 데 도움이 될 수 있습니다. 2017-2022년간 납품기수에서는 총 2,049대가 세계 여러 항공사에 의해 조달되었습니다. 이 총 2,049대 가운데 여객기가 96%를 차지하고 화물기가 4%를 차지했습니다.
- 국내 여객 수요는 국제 여객 수요보다 빨리 COVID-19 이전 수준으로 돌아갈 것으로 예상되므로 협폭동체 시장은 광폭동체 수요보다 빨리 회복될 것으로 예측됩니다. 이러한 개발은 시장 수요를 견인할 것으로 예측됩니다. 예측기간 중 전 세계적으로 여객기 13,812기, 화물기 268기의 납품이 예상됩니다.
아시아태평양이 민간항공시장에서 가장 유리한 시장이 될 전망
- 북미는 아시아태평양에 이어 두 번째로 높은 성장이 예상되는 지역입니다. 항공기 납품 수에서 북미 민간 항공기는 2017-2022년까지 전 세계 민간 항공기 전체의 거의 29%를 차지했습니다. 2023-2030년까지 항공기 납품 수는 57% 증가할 것으로 예측됩니다. 북미는 예측 기간 동안 항공기 납품 총수의 27%를 차지할 수 있습니다. 유럽의 민간 항공기는 2017-2022년까지 세계 민간 항공기 총수의 17%를 차지합니다.
- 남미 항공 여객수는 2020년 2억 1,073만 명에 비해 2021년 1억 9,915만 명으로 축소되었습니다. 예측 기간 동안 유럽, 중동, 아프리카, 남미는 각각 항공기 납품 총수의 약 20%, 9%, 3%를 차지할 수 있습니다.
- COVID-19 팬데믹은 전 세계 운송 중단으로 인해 민간 항공기 시장에 큰 영향을 미쳤습니다. 2021년 국제여객 수요는 2019년에 비해 75.5% 감소했습니다.
- 아시아태평양에서는 팬데믹이 이 지역의 항공산업에 큰 영향을 미쳤지만, 국내 여객 수송량은 꾸준히 증가하고 있습니다.
- 이 지역의 경제 성장과 인프라 정비에 의한 1인당 소득 증가는 항공 여객수 증가에 기여해, 지역 항공사나 국내 항공사의 기재 확대를 지지했습니다.
세계 민간항공시장 동향
여행 제한 완화와 여객 수 증가로 수요 견인
- 국경을 넘은 여행이 점차 회복됨에 따라 아시아태평양 항공사는 여행에 대한 욕구 증가와 COVID-19에 의한 2년간의 쇄국 기간 동안 축적된 저축에 자극을 받아 수요에 대응하기 위해 편의 투입을 서두르고 있습니다. 그 결과, 2022년에는 이 지역의 항공 여객 수송량은 다른 지역보다 팬데믹으로부터 급속하게 회복했습니다. 항공 여객 수송량은 22억명을 기록했으며, 2021년 대비 10%의 성장을 보였습니다. 중국, 인도, 일본, 인도네시아는 아시아태평양의 총 여객 수송량의 70%를 차지하고 있어 이 지역의 기타 국가들에 비해 신형 항공기에 대한 수요가 높아질 것으로 예측됩니다.
- 아시아태평양 항공사는 세계적으로 경제 상황이 엄격해지고 있음에도 불구하고 잠재적인 여행 수요가 성장을 계속 추진했기 때문에 국제 항공 여객 시장의 현저한 회복을 목표로 삼았습니다.
민간 항공 산업 개요
민간 항공 시장은 상당히 통합되어 있으며 상위 5개 기업에서 90.21%를 차지하고 있습니다.
기타 혜택
- 엑셀 형식 시장 예측(ME) 시트
- 3개월의 애널리스트 서포트
목차
제1장 주요 요약과 주요 조사 결과
제2장 보고서 제안
제3장 소개
- 조사의 전제조건과 시장 정의
- 조사 범위
- 조사 방법
제4장 주요 산업 동향
- 항공 여객 수송량
- 아시아태평양
- 유럽
- 중동 및 아프리카
- 북미
- 남미
- 항공수송화물
- 아시아태평양
- 유럽
- 중동 및 아프리카
- 북미
- 남미
- 국내총생산
- 아시아태평양
- 유럽
- 중동 및 아프리카
- 북미
- 남미
- 수입 여객 킬로(rpk)
- 아시아태평양
- 유럽
- 중동 및 아프리카
- 북미
- 남미
- 인플레이션율
- 아시아태평양
- 유럽
- 중동 및 아프리카
- 북미
- 남미
- 규제 프레임워크
- 밸류체인 분석
제5장 시장 세분화
- 서브 항공기 유형
- 화물기
- 여객기
- 협폭동체 항공기
- 광폭동체 항공기
- 지역
- 아시아태평양
- 호주
- 중국
- 인도
- 인도네시아
- 일본
- 말레이시아
- 필리핀
- 싱가포르
- 한국
- 태국
- 기타 아시아태평양
- 유럽
- 프랑스
- 독일
- 이탈리아
- 네덜란드
- 러시아
- 스페인
- 튀르키예
- 영국
- 기타 유럽
- 중동 및 아프리카
- 알제리
- 이집트
- 카타르
- 사우디아라비아
- 남아프리카
- 아랍에미리트(UAE)
- 기타 중동 및 아프리카
- 북미
- 캐나다
- 멕시코
- 미국
- 기타 북미
- 남미
- 브라질
- 칠레
- 콜롬비아
- 기타 남미
- 아시아태평양
제6장 경쟁 구도
- 주요 전략적 움직임
- 시장 점유율 분석
- 기업 상황
- 기업 프로파일
- Airbus SE
- ATR
- COMAC
- De Havilland Aircraft of Canada Ltd.
- Embraer
- The Boeing Company
- United Aircraft Corporation
제7장 CEO에 대한 주요 전략적 질문
제8장 부록
- 세계 개요
- 개요
- Porter's Five Forces 분석 프레임워크
- 세계의 밸류체인 분석
- 시장 역학(DROs)
- 정보원과 참고문헌
- 도표 일람
- 주요 인사이트
- 데이터 팩
- 용어집
The Commercial Aviation Market size is estimated at 214.4 billion USD in 2025, and is expected to reach 293.6 billion USD by 2030, growing at a CAGR of 6.49% during the forecast period (2025-2030).
The Growth In Air Passenger Traffic And The Increasing Demand For Fuel-Efficient And Modern Aircraft Are Expected To Boost The Commercial Aviation Industry Globally
- According to the UNWTO, tourism contributes 10% of the world's GDP, making it one of the main sources of income in the modern world, with 57% of cross-border travelers using aircraft. In the last 15 years, the number of passengers in commercial aviation has doubled. During the forecast period, a total of 14,080 commercial aircraft are expected to be delivered, some of which may replace the current fleet's more aged aircraft. The COVID-19 pandemic affected air passenger traffic globally in 2020, reducing flight activity and impacting airline cash flows. As a result, most airlines decided to cancel or defer their aircraft orders.
- However, the commercial aviation industry recovered gradually in 2022, which led to a significant increase in aircraft deliveries compared to 2021. Airlines are looking for aircraft with better fuel efficiency and range, and the development of newer aircraft may help OEMs attract more airline customers in the coming years. In terms of deliveries during 2017-2022, a total of 2,049 aircraft were procured by various airlines globally. Of these total 2,049 aircraft, passenger aircraft accounted for 96%, and freighter aircraft accounted for 4%.
- Since the domestic passenger demand is anticipated to return to pre-COVID-19 levels earlier than the international passenger demand, the market for narrowbody aircraft is anticipated to rebound faster than the demand for widebody aircraft. The 737 MAX's return to service in late 2020 may also support the expansion of the narrowbody segment. Such developments are expected to drive the demand in the market. A total of 13,812 passenger aircraft and 268 freighter aircraft are expected to be delivered globally during the forecast period
Asia-Pacific Is Expected To Be The Most Lucrative Market In The Commercial Aviation
- North America is expected to be the second-highest-growing region after Asia-Pacific. In terms of aircraft deliveries, North America's commercial aircraft accounted for almost 29% of the total commercial aircraft worldwide from 2017 to 2022. Aircraft deliveries are expected to rise by 57% from 2023 to 2030. North America may be accountable for 27% of total aircraft deliveries during the forecast period. Europe's commercial aircraft accounted for 17% of the total commercial aircraft worldwide from 2017 to 2022.
- Air travel in South America contracted to 199.15 million air passengers in 2021 compared to 210.73 million passengers traveled in 2020. During the forecast period, Europe, Middle East & Africa, and South America may account for around 20%, 9%, and 3% of total aircraft deliveries, respectively.
- The COVID-19 pandemic greatly impacted the commercial aircraft market due to a halt in global transportation. The stringent lockdowns enforced worldwide also significantly impacted the economic conditions of the commercial aircraft market. Therefore, in 2021, international passenger demand was 75.5% lower than in 2019. Asia-Pacific (APAC) is projected to grow at a healthy rate between 2023 and 2030.
- Domestic passenger traffic has been steadily increasing in the APAC region, although the pandemic had a significant impact on the region's aviation industry. In 2022, the APAC region contributed 38% of total air passenger traffic worldwide.
- The region's rising per capita income due to economic and infrastructure growth contributed to the growth of air passenger numbers and supported the expansion of the regional and domestic airlines' fleets. Narrowbody aircraft accounted for approximately 83% of total deliveries during the period.
Global Commercial Aviation Market Trends
Ease of travel restrictions and the rising number of passengers are driving the demand
- As cross-border travel was progressively restored, the carriers in the Asia-Pacific have raced to put on flights to meet runaway demand, stimulated by the pent-up desire to travel and savings accumulated in the two years of isolation due to COVID-19. As a result, in 2022, air passenger traffic in the region recovered more rapidly from the pandemic than other regions. For instance, in 2022, air passenger traffic in Asia-Pacific was recorded at 2.2 billion, witnessing a growth of 10% compared to 2021. Moreover, airline companies in the region are implementing fleet expansion plans to cater to the growing air passenger traffic in the major countries in the region. China, India, Japan, and Indonesia account for 70% of the total air passenger traffic in Asia-Pacific and are expected to generate more demand for new aircraft compared to other countries in the region.
- Airlines in Asia-Pacific witnessed a notable recovery in international air passenger markets as pent-up travel demand continued to fuel growth despite increasingly challenging global economic conditions. The passenger load factor for the region's airlines also improved, showing a year-on-year increase of 17.9 ppts and reaching 78.8%. These developments in total ASK and passenger load factor are highly encouraging and support the increasing demand for air travel in the region. Moreover, the healthy growth in international passenger traffic shows strong travel demand from the business and leisure sectors. The rapid increase in air passenger traffic in the region is expected to drive the air transport industry in the future.
Commercial Aviation Industry Overview
The Commercial Aviation Market is fairly consolidated, with the top five companies occupying 90.21%. The major players in this market are Airbus SE, ATR, Embraer, The Boeing Company and United Aircraft Corporation (sorted alphabetically).
Additional Benefits:
- The market estimate (ME) sheet in Excel format
- 3 months of analyst support
TABLE OF CONTENTS
1 EXECUTIVE SUMMARY & KEY FINDINGS
2 REPORT OFFERS
3 INTRODUCTION
- 3.1 Study Assumptions & Market Definition
- 3.2 Scope of the Study
- 3.3 Research Methodology
4 KEY INDUSTRY TRENDS
- 4.1 Air Passenger Traffic
- 4.1.1 Asia-Pacific
- 4.1.2 Europe
- 4.1.3 Middle East and Africa
- 4.1.4 North America
- 4.1.5 South America
- 4.2 Air Transport Freight
- 4.2.1 Asia-Pacific
- 4.2.2 Europe
- 4.2.3 Middle East and Africa
- 4.2.4 North America
- 4.2.5 South America
- 4.3 Gross Domestic Product
- 4.3.1 Asia-Pacific
- 4.3.2 Europe
- 4.3.3 Middle East and Africa
- 4.3.4 North America
- 4.3.5 South America
- 4.4 Revenue Passenger Kilometers (rpk)
- 4.4.1 Asia-Pacific
- 4.4.2 Europe
- 4.4.3 Middle East and Africa
- 4.4.4 North America
- 4.4.5 South America
- 4.5 Inflation Rate
- 4.5.1 Asia-Pacific
- 4.5.2 Europe
- 4.5.3 Middle East and Africa
- 4.5.4 North America
- 4.5.5 South America
- 4.6 Regulatory Framework
- 4.7 Value Chain Analysis
5 MARKET SEGMENTATION (includes market size in Value in USD and Volume, Forecasts up to 2030 and analysis of growth prospects)
- 5.1 Sub Aircraft Type
- 5.1.1 Freighter Aircraft
- 5.1.2 Passenger Aircraft
- 5.1.2.1 Narrowbody Aircraft
- 5.1.2.2 Widebody Aircraft
- 5.2 Region
- 5.2.1 Asia-Pacific
- 5.2.1.1 Australia
- 5.2.1.2 China
- 5.2.1.3 India
- 5.2.1.4 Indonesia
- 5.2.1.5 Japan
- 5.2.1.6 Malaysia
- 5.2.1.7 Philippines
- 5.2.1.8 Singapore
- 5.2.1.9 South Korea
- 5.2.1.10 Thailand
- 5.2.1.11 Rest of Asia-Pacific
- 5.2.2 Europe
- 5.2.2.1 France
- 5.2.2.2 Germany
- 5.2.2.3 Italy
- 5.2.2.4 Netherlands
- 5.2.2.5 Russia
- 5.2.2.6 Spain
- 5.2.2.7 Turkey
- 5.2.2.8 UK
- 5.2.2.9 Rest of Europe
- 5.2.3 Middle East and Africa
- 5.2.3.1 Algeria
- 5.2.3.2 Egypt
- 5.2.3.3 Qatar
- 5.2.3.4 Saudi Arabia
- 5.2.3.5 South Africa
- 5.2.3.6 United Arab Emirates
- 5.2.3.7 Rest of Middle East and Africa
- 5.2.4 North America
- 5.2.4.1 Canada
- 5.2.4.2 Mexico
- 5.2.4.3 United States
- 5.2.4.4 Rest of North America
- 5.2.5 South America
- 5.2.5.1 Brazil
- 5.2.5.2 Chile
- 5.2.5.3 Colombia
- 5.2.5.4 Rest of South America
- 5.2.1 Asia-Pacific
6 COMPETITIVE LANDSCAPE
- 6.1 Key Strategic Moves
- 6.2 Market Share Analysis
- 6.3 Company Landscape
- 6.4 Company Profiles
- 6.4.1 Airbus SE
- 6.4.2 ATR
- 6.4.3 COMAC
- 6.4.4 De Havilland Aircraft of Canada Ltd.
- 6.4.5 Embraer
- 6.4.6 The Boeing Company
- 6.4.7 United Aircraft Corporation
7 KEY STRATEGIC QUESTIONS FOR AVIATION CEOS
8 APPENDIX
- 8.1 Global Overview
- 8.1.1 Overview
- 8.1.2 Porter's Five Forces Framework
- 8.1.3 Global Value Chain Analysis
- 8.1.4 Market Dynamics (DROs)
- 8.2 Sources & References
- 8.3 List of Tables & Figures
- 8.4 Primary Insights
- 8.5 Data Pack
- 8.6 Glossary of Terms


샘플 요청 목록