
|
시장보고서
상품코드
2066367
에틸벤젠 시장 : 시장 점유율 분석, 업계 동향 및 통계, 성장 예측(2026-2031년)Ethylbenzene - Market Share Analysis, Industry Trends & Statistics, Growth Forecasts (2026 - 2031) |
||||||
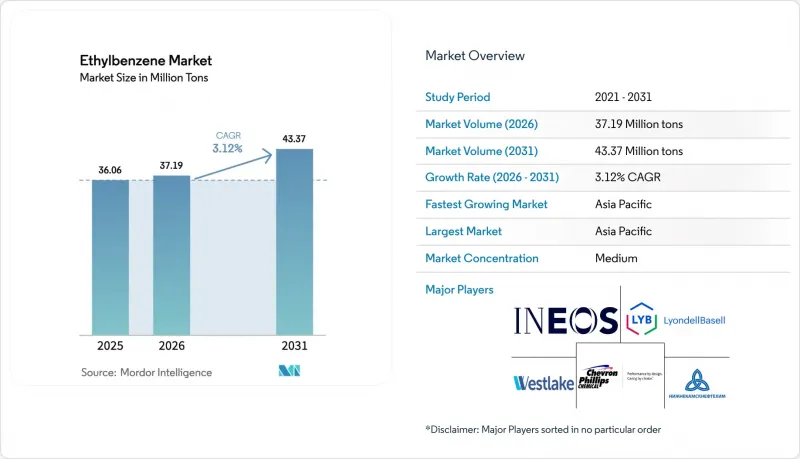
Mordor Intelligence에 의하면, 에틸벤젠 시장 규모는 2025년에 3,606만 톤으로 평가되었고, 2026년에 3,719만 톤으로 추정되고, 2031년까지 4,337만 톤에 이를 것으로 예측되며, 2026-2031년 CAGR 3.12%로 성장할 전망입니다.
본 보고서는 용도별(스티렌, 가솔린, 디에틸벤젠, 천연가스, 도료, 아스팔트 및 나프타), 최종 사용자 산업별(포장, 전자, 건설, 농업, 자동차, 기타), 지역별(아시아태평양, 북미, 남미, 중동 및 아프리카)로 분류되어 있습니다. 시장 전망은 수량(톤) 기준으로 제시되어 있습니다.
세계의 에틸벤젠 시장 동향 및 분석
스티렌계 ABS 및 SBR 소재에 대한 수요 급증
자동차 경량화 및 전기차용 부품 수요가 ABS 수요를 끌어올리고 있어, 중국에서만 가동률이 55%에 육박함에도 불구하고 향후 2년 동안 연간 210만 톤 이상의 ABS 생산 능력을 확대될 전망입니다. 전자상거래의 확대에 따라 내충격성이 뛰어나고 가벼운 상자 및 트레이에 대한 수요가 증가함에 따라, 2025년까지 폴리스티렌 및 ABS의 포장용 수요는 확대되었으나, 중국의 경쟁으로 인해 북미 및 유럽의 가공업체들의 이익률은 압박을 받았습니다. SBR 수요는 주행 거리의 지속적인 증가에 힘입어 교체용 타이어 부문에서 견조한 추세를 보였습니다. 2025년 전 세계 벤젠 소비량은 2,500만 톤을 넘어섰으며, 그 중 약 48%가 에틸벤젠 제조 공정에 투입되었습니다. 이는 이 유도체가 광범위한 방향족 화합물 계열에서 핵심적인 역할을 하고 있음을 여실히 보여줍니다. 수익성은 벤젠과 에틸렌 생산 라인을 모두 보유한 완전 통합형 기업으로 전환되고 있으며, 서유럽에서 잇달아 발생한 가동 중단 사례에서 볼 수 있듯이, 단독 스티렌 제조업체는 가동 중단 위험에 노출되어 있습니다.
가솔린 블렌드(옥탄가 향상제)의 소비량 증가
에틸벤젠은 높은 연구 옥탄가를 제공하기 때문에 벤젠이 리포메이트에 비해 가격 경쟁력이 있을 경우 정제 업체가 규격을 충족하는 데 도움이 됩니다. 미국 환경보호청(EPA)은 40 CFR Part 1090에 따라 완제품 휘발유 내 벤젠의 평균 함유량을 부피비 0.62%로 제한하고 있으며, 이에 따라 벤젠 원료 가격이 급등할 경우 에틸벤젠의 배합량이 간접적으로 제한됩니다. ASTM D5580에 따른 분석을 통해 블렌더는 에틸벤젠을 정확하게 추적하고, 방향족 성분의 구성을 실시간으로 조정할 수 있게 됩니다. 북미에서는 겨울철에 부탄이나 RVP가 높은 블렌드 스톡이 시장에 재유입되면서 수요가 감소했으나, 2025년 하반기의 소비량은 수출 화물에서 저옥탄가 경나프타를 방향족 화합물이 보완해 주었기 때문에 유지되었습니다. 벤젠의 거래 가격이 리포맷 가격을 상회하면, 정제업체들은 톨루엔이나 크실렌으로 전환하기 때문에 에틸벤젠 수요는 억제됩니다.
엄격한 VOC 및 벤젠 유도체 배출 기준
OSHA는 2025년 7월, 노출 한계치를 완화하지 않은 채 호흡용 보호구에 관한 내용을 현대화하기 위해 벤젠 기준 개정안을 제안했습니다. 공청회 의견 접수는 2025년 11월에 마감됩니다. 한편, EPA는 NESHAP 서브파트 FF에 따라 벤젠에 대한 펜스라인 모니터링을 시행하고 있으며, 측정값이 행동 기준치를 초과할 경우 수백만 달러 규모의 벌금을 부과하고 시정 계획 수립을 의무화하고 있습니다. 2024년 합의에 따라, 미국의 한 정유시설는 1,900만 달러의 합의금에 더해 1억 5,000만 달러의 제어 설비 도입 비용을 부담함으로써 연간 219톤의 VOC 배출을 감축했습니다. 한국에서는 합성수지 제조 시설에서 에틸벤젠이 우선적으로 규제해야 할 VOC 상위 4개 품목에 포함되어 감시가 강화되고 있습니다. 이러한 규제는 유럽 내 구형 크래커의 폐쇄를 가속화하고 폐쇄형 회수 시스템을 촉진하는 한편, 순수입 지역에서는 이미 낮은 이익률에 추가적인 자본 부담을 가중시키고 있습니다.
부문별 분석
스티렌은 2025년에 에틸벤젠 시장의 95.78% 점유율을 차지한 것으로 평가되었으며, 하류 제품인 폴리스티렌, ABS, SBR의 소비에 힘입어 2031년까지 연평균 성장률(CAGR) 3.15%로 성장할 전망입니다. 중국의 스티렌 생산 능력 확대는 지역적 공급 과잉을 심화시켜 스프레드를 축소시키고 있습니다. 일본 내 치바의 크래커 시설 통합으로 인해, 2027년까지 상당한 양의 에틸렌 생산이 중단되어 국내 에틸벤젠 수요가 감소하게 될 것입니다. 휘발유에의 혼합, 디에틸벤젠 및 특수 용매로의 용도는 여전히 틈새 시장에 머물러 있으며, 이 세 가지를 합쳐도 수요의 2% 미만을 차지하고 있습니다. 2024년 3분기 유럽에서 벤젠·스티렌 스프레드가 축소됨에 따라, 일부 독립형 공장이 손익분기점에 근접하게 되었으며, 이는 정유시설와 크래커를 통합한 복합 시설로의 전략적 전환을 촉진했습니다.
2차적 영향이 촉매 선정의 경향을 여실히 드러내고 있습니다. 바저(Badger)사의 EBMax 제올라이트 공법은 벤젠 대 에틸렌 비율이 2.5-4.0이므로 재활용 비용과 에너지 비용을 절감할 수 있으며, 현재 전 세계 생산량의 절반 이상을 차지하고 있습니다. 지속가능성을 고려하여 각 생산 업체들은 바이오에틸렌의 시범 생산을 추진하고 있으나, 생산량이 제한적이기 때문에 2030년 이전에 상업적인 영향이 나타날 것으로 예상되지는 않습니다.
지역별 분석
아시아태평양은 2025년 생산량의 57.03%를 차지했으며, 2031년까지 연평균 성장률(CAGR) 3.65%를 나타낼 것으로 전망되어, 이 지역은 에틸벤젠 시장의 중심적 지위를 유지하고 있습니다. BASF의 잔장(Zhanjiang) 및 푸젠 중샤 구레이(Fujian Zhongsha Gulei) 등 대규모 에틸렌 생산 확대 프로젝트에는 통합형 스티렌 생산 체인이 포함되어 있어, 벤젠과 에틸벤젠의 자급자족을 확보하고 있습니다. 인도의 BPCL 비나(Bina) 및 나야라 에너지(Nayara Energy)의 바디나르(Vadinar) 에탄 크래커(총액 80억 달러)는 인도의 석유화학제품 수입액의 45%를 감축하고, 국내 에틸벤젠 공급을 안정화하는 것을 목표로 하고 있습니다. PTT GC와 같은 동남아시아 기업들은 미국산 에탄을 수입하고, 2026년까지 대규모 턴어라운드를 피함으로써 경쟁력을 높이고 안정적인 수출을 유지하고 있습니다.
북미는 셰일에서 추출한 에탄을 활용하여 세계 최저 수준의 현금 비용을 실현하고 있지만, 휘발유 수요의 구조적 감소로 인해 개질 공정에서 생산되는 벤젠의 성장세는 정체 상태에 접어들었습니다. 2025년 12월 웨스트레이크사가 연간 생산량 26만 톤 규모의 레이크찰스 스티렌 공장의 가동을 중단한 것은 전 세계적인 공급 과잉으로 인해 스프레드가 축소되면 원료 면에서 우위를 점하고 있는 생산자조차 시장에서 철수하게 된다는 점을 보여줍니다. 그럼에도 불구하고, 다우, 엑슨모빌, 셰브론 Philips는 경기 회복과 수출 차익 거래를 예상하여 2026년 1월에 생산 능력을 확대했습니다. 다른 지역에서 공급이 부족해지는 가운데, 해당 지역의 에틸벤젠 장기 시장 점유율은 18-20% 전후로 유지될 것으로 예측됩니다.
유럽은 높은 에너지 비용과 EU 배출권 거래 제도(EU ETS)의 영향으로 어려움을 겪고 있어, 이는 약점으로 작용하고 있습니다. 베르사리스, 엑슨모빌, SABIC 및 INEOS는 2024-2025년 총 연간 20만 톤이 넘는 크래커 생산 능력을 폐쇄했습니다. 탄소 국경세와 급등하는 LNG 가격이 나프타의 마진을 압박하고 있으며, 이로 인해 특수 제품 및 순환형 생산 경로로의 전환이 가속화되고 있습니다. 중동의 복합 시설은 저비용 에탄을 활용하여 수익성을 유지하고 있습니다. 타스니사의 자금 조달을 통한 확장으로 인해, 2030년 4분기까지 연간 330만 톤의 제품이 추가 생산되어 잉여 스티렌이 아시아 시장에 공급될 예정입니다. 아프리카와 남미는 규모는 작지만, 전략적으로 중요한 지역으로 남아 있습니다. 이집트 알렉산드리아에서 추진 중인 연간 30만 톤 규모의 스티렌 프로젝트는 2030년까지 해당 지역공급 부족을 해소할 것이며, 브라질의 브라스크엠(Braskem)과 페트로브라스(Petrobras)가 체결한 장기 원료 공급 협정은 에탄 시장 점유율을 확대하고 에틸벤젠 수요 증가를 뒷받침할 것입니다.
기타 혜택 :
- 엑셀 형식 시장 예측(ME) 시트
- 3개월간의 애널리스트 지원
자주 묻는 질문
목차
제1장 서론
제2장 조사 방법
제3장 주요 요약
제4장 시장 구도
제5장 시장 규모 및 성장 예측
제6장 경쟁 구도
제7장 시장 기회 및 향후 전망
AJY 26.06.24According to Mordor Intelligence, the ethylbenzene market size is projected to be 36.06 million tons in 2025, 37.19 million tons in 2026, and reach 43.37 million tons by 2031, growing at a CAGR of 3.12% from 2026 to 2031.

This report is Segmented by Application (Styrene, Gasoline, Diethylbenzene, Natural Gas, Paint, and Asphalt and Naphtha), by End-User Industry (Packaging, Electronics, Construction, Agriculture, Automotive, and Others), and Geography (Asia-Pacific, North America, South America, and the Middle East and Africa). The Market Forecasts are Provided in Terms of Volume (Tons).
Global Ethylbenzene Market Trends and Insights
Surging Demand for Styrene-Based ABS and SBR Materials
Automotive lightweighting and electric-vehicle parts are lifting ABS off-take, and China alone is adding more than 2.1 million tons per year of ABS capacity within two years despite utilization rates near 55%. Packaging needs for polystyrene and ABS grew through 2025 as e-commerce pushed demand for impact-resistant, lightweight boxes and trays, although Chinese export competition crimped converter margins in North America and Europe. SBR demand tied to replacement tires remained firm, supported by sustained vehicle miles traveled. Global benzene consumption exceeded 25 million tons in 2025, and roughly 48% of that volume entered the ethylbenzene route, underscoring the derivative's anchor role in the broader aromatics chain. Profitability is drifting toward fully integrated players that own both benzene and ethylene streams, leaving standalone styrene makers vulnerable to shutdowns, as seen in multiple West European closures.
Rising Consumption in Gasoline Blending (Octane Improver)
Ethylbenzene delivers a high research octane number, helping refiners hit specifications when benzene is cost-competitive versus reformate. The U.S. EPA caps average benzene in finished gasoline at 0.62 vol% under 40 CFR Part 1090, indirectly limiting ethylbenzene inclusion when benzene feedstock prices spike. ASTM D5580 analysis allows blenders to track ethylbenzene precisely and toggle aromatic composition in real time. North American demand dips during the winter months when butane and high-RVP blendstocks re-enter the pool, yet late-2025 consumption held because aromatics offset low-octane light naphtha in export cargoes. When benzene trades above reformate, refiners switch to toluene or xylene, capping ethylbenzene pull.
Stringent VOC and Benzene-Derivative Emission Norms
OSHA proposed revisions to the Benzene standard in July 2025, aiming to modernize respirator language without relaxing exposure limits; public comments close in November 2025. EPA, meanwhile, enforces benzene fenceline monitoring under NESHAP Subpart FF, imposing multimillion-dollar penalties and mandating corrective plans when readings breach action levels. A 2024 settlement cost one U.S. refinery USD 19 million plus USD 150 million in control equipment, eliminating 219 tons per year of VOCs. In South Korea, ethylbenzene ranked among the top four VOCs identified for priority control at synthetic resin sites, intensifying scrutiny. These rules accelerate closures of older European crackers and incentivize closed-loop recovery, but they add capital strain to already thin margins in net-import regions.
Other drivers and restraints analyzed in the detailed report include:
- Capacity Additions in Asia's On-Purpose Ethylbenzene Plants
- Rebound of Construction Sector Fuelling UPR Resins Demand
- Price Volatility of Crude-Derived Feedstocks
For complete list of drivers and restraints, kindly check the Table Of Contents.
Segment Analysis
Styrene held 95.78% share of the Ethylbenzene market in 2025 and will advance at 3.15% CAGR through 2031, fueled by downstream polystyrene, ABS, and SBR consumption. China's styrene nameplate growth is amplifying regional surpluses and compressing spreads. Japan's consolidation of Chiba crackers will shutter a significant volume of ethylene by 2027, trimming ethylbenzene demand domestically. Gasoline blending, diethylbenzene, and specialty solvent outlets remain niche, absorbing less than 2 % combined. Tight benzene-styrene spreads in Europe Q3 2024 pushed several standalone units toward breakeven, reinforcing the strategic shift to integrated refinery-cracker complexes.
Second-order effects underline catalyst preference: the Badger EBMax zeolite route now produces over half of global volumes because its 2.5-4.0 benzene-to-ethylene ratio cuts recycle and energy cost. Sustainability considerations push producers to trial bio-ethylene streams, but limited tonnage delays commercial impact before 2030.
Geography Analysis
Asia-Pacific commanded 57.03% of the 2025 volume and is on course for a 3.65% CAGR to 2031, keeping the region at the center of the Ethylbenzene market. Massive ethylene expansions, such as BASF Zhanjiang and Fujian Zhongsha Gulei, embed integrated styrene chains, ensuring benzene and ethylbenzene self-sufficiency. India's BPCL Bina and Nayara Energy's Vadinar ethane cracker, valued at USD 8 billion, aim to cut the country's 45% petrochemicals import bill and create domestic ethylbenzene supply security. Southeast Asian players like PTT GC boost competitiveness by importing U.S. ethane and avoiding major turnarounds through 2026, sustaining steady exports.
North America leverages shale-based ethane to enjoy the world's lowest cash costs, but structural gasoline demand decline caps reformate-derived benzene growth. Westlake's 260,000 tons per year Lake Charles styrene shutdown in December 2025 illustrates how even feedstock-advantaged producers exit when global oversupply erodes spreads. Dow, ExxonMobil, and Chevron Phillips nevertheless added incremental capacity in January 2026, betting on cyclical recovery and export arbitrage. Long-term ethylbenzene market share in the region is expected to stay around 18-20% as supply tightens elsewhere.
Europe is the weak link, battered by high energy costs and EU ETS exposure. Versalis, ExxonMobil, SABIC, and INEOS retired more than 200,000 tons per year of combined cracker capacity between 2024-2025. Carbon border taxes and pricey LNG undermine naphtha margins, propelling an accelerated switch to specialty or circular routes. Middle East complexes stay profitable on low-cost ethane; Tasnee's financed expansion will add 3.3 million tons per year of products by Q4 2030, channeling surplus styrene into Asian markets. Africa and South America remain small but strategic: Egypt's 300,000 tons per year styrene project in Alexandria fills a regional deficit by 2030, and Brazil's long-term Braskem-Petrobras feedstock pact boosts ethane share, supporting incremental ethylbenzene demand.
- Carbon Holdings Limited (Cairo)
- Changzhou Dohow Chemical Co. Ltd
- Chevron Phillips Chemical Company LLC
- Cos-Mar Company
- Dow
- Guangdong Wengjiang Chemical Reagent Co., Ltd.
- Honeywell International Inc
- INEOS
- J&K Scientific Ltd.
- LLC 'Gazprom neftekhim Salavat'
- LyondellBasell Industries Holdings B.V.
- ROSNEFT
- Shanghai Myrell Chemical Technology Co., Ltd.
- SIBUR Holding PJSC
- Sibur-Khimprom CJSC
- TCI Chemicals (India) Pvt. Ltd.
- Versalis S.p.A.
- Westlake Chemical Corporation
Additional Benefits:
- The market estimate (ME) sheet in Excel format
- 3 months of analyst support
TABLE OF CONTENTS
1 Introduction
- 1.1 Study Assumptions & Market Definition
- 1.2 Scope of the Study
2 Research Methodology
3 Executive Summary
4 Market Landscape
- 4.1 Market Overview
- 4.2 Market Drivers
- 4.2.1 Surging demand for styrene-based ABS and SBR materials
- 4.2.2 Rising consumption in gasoline blending (octane improver)
- 4.2.3 Capacity additions in Asia's on-purpose ethylbenzene plants
- 4.2.4 Rebound of construction sector fuelling UPR resins demand
- 4.2.5 Adoption of bio-ethylene routes for low-carbon ethylbenzene
- 4.3 Market Restraints
- 4.3.1 Stringent VOC and benzene-derivative emission norms
- 4.3.2 Price volatility of crude-derived feedstocks
- 4.3.3 Shrinking mixed-xylene pool as refiners upgrade gasoline
- 4.4 Value Chain Analysis
- 4.5 Regulatory Analysis
- 4.6 Porter's Five Forces
- 4.6.1 Threat of New Entrants
- 4.6.2 Bargaining Power of Suppliers
- 4.6.3 Bargaining Power of Buyers
- 4.6.4 Threat of Substitutes
- 4.6.5 Degree of Competition
- 4.7 Pricing Analysis
- 4.8 Trade Analysis
5 Market Size & Growth Forecasts (Volume)
- 5.1 By Application
- 5.1.1 Styrene
- 5.1.1.1 Polystyrene
- 5.1.1.2 Acrylonitrile-Butadiene-Styrene
- 5.1.1.3 Styrene-Acrylonitrile Resins
- 5.1.1.4 Styrene-Butadiene Elastomers and Latex
- 5.1.1.5 Unsaturated Polyester Resins
- 5.1.2 Gasoline
- 5.1.3 Diethylbenzene
- 5.1.4 Natural Gas
- 5.1.5 Paint
- 5.1.6 Asphalt and Naphtha
- 5.1.1 Styrene
- 5.2 By End-user Industry
- 5.2.1 Packaging
- 5.2.2 Electronics
- 5.2.3 Construction
- 5.2.4 Agriculture
- 5.2.5 Automotive
- 5.2.6 Others
- 5.3 By Geography
- 5.3.1 Asia-Pacific
- 5.3.1.1 China
- 5.3.1.2 India
- 5.3.1.3 Japan
- 5.3.1.4 South Korea
- 5.3.1.5 ASEAN Countries
- 5.3.1.6 Rest of Asia-Pacific
- 5.3.2 North America
- 5.3.2.1 United States
- 5.3.2.2 Canada
- 5.3.2.3 Mexico
- 5.3.3 Europe
- 5.3.3.1 Germany
- 5.3.3.2 United Kingdom
- 5.3.3.3 Italy
- 5.3.3.4 France
- 5.3.3.5 Spain
- 5.3.3.6 Russia
- 5.3.3.7 NORDIC Countries
- 5.3.3.8 Rest of Europe
- 5.3.4 South America
- 5.3.4.1 Brazil
- 5.3.4.2 Argentina
- 5.3.4.3 Rest of South America
- 5.3.5 Middle-East and Africa
- 5.3.5.1 Saudi Arabia
- 5.3.5.2 South Africa
- 5.3.5.3 Rest of Middle-East and Africa
- 5.3.1 Asia-Pacific
6 Competitive Landscape
- 6.1 Market Concentration
- 6.2 Strategic Moves
- 6.3 Market Share(%)/Ranking Analysis
- 6.4 Company Profiles {(includes Global level Overview, Market level overview, Core Segments, Financials as available, Strategic Information, Market Rank/Share for key companies, Products & Services, and Recent Developments)}
- 6.4.1 Carbon Holdings Limited (Cairo)
- 6.4.2 Changzhou Dohow Chemical Co. Ltd
- 6.4.3 Chevron Phillips Chemical Company LLC
- 6.4.4 Cos-Mar Company
- 6.4.5 Dow
- 6.4.6 Guangdong Wengjiang Chemical Reagent Co., Ltd.
- 6.4.7 Honeywell International Inc
- 6.4.8 INEOS
- 6.4.9 J&K Scientific Ltd.
- 6.4.10 LLC 'Gazprom neftekhim Salavat'
- 6.4.11 LyondellBasell Industries Holdings B.V.
- 6.4.12 ROSNEFT
- 6.4.13 Shanghai Myrell Chemical Technology Co., Ltd.
- 6.4.14 SIBUR Holding PJSC
- 6.4.15 Sibur-Khimprom CJSC
- 6.4.16 TCI Chemicals (India) Pvt. Ltd.
- 6.4.17 Versalis S.p.A.
- 6.4.18 Westlake Chemical Corporation
7 Market Opportunities and Future Outlook
- 7.1 White-space and Unmet-need Assessment
