


|
시장보고서
상품코드
1849926
임상시험 : 시장 점유율 분석, 산업 동향, 통계, 성장 예측(2025-2030년)Clinical Trials - Market Share Analysis, Industry Trends & Statistics, Growth Forecasts (2025 - 2030) |
||||||
임상시험 시장은 2025년에 901억 달러로 평가되었고, 2030년에 1,235억 달러에 이를 것으로 예측되며, 2025년부터 2030년까지의 CAGR은 6.51%를 나타낼 전망입니다.

상업적 후원사들은 현장 관련 비용을 절감하고, 환자 등록 기간을 단축하며, 연결된 기기를 통한 실시간 감독을 지원하기 위해 분산형 또는 하이브리드 실행 모델로 전환하고 있습니다. 2025년 1월 ICH E6(R3) 우수임상시험기준(GCP) 가이드라인의 최종 채택은 위험 기반 품질 관리, 실용적 데이터 수집 및 원격 우선 모니터링을 공식적으로 승인함으로써 이러한 전환을 가속화하고 있습니다. 종양학은 전 세계 프로토콜 시작 건수에서 여전히 가장 큰 비중을 차지하지만, 신경학, 희귀질환 및 세포 및 유전자 치료 분야가 적응형 설계와 바이오마커 기반 코호트 선별의 혜택을 받으며 더 빠르게 성장하고 있습니다. 계약 연구 기관(CRO)들은 기술 투자를 통해 마진을 방어하는 한편, 신흥 중견 전문 기업들은 치료 분야 깊이와 지역별 규제 전문성을 제공하며 대형 기존 기업들의 점유율을 잠식하고 있습니다. 경험 많은 현장 인력의 지속적인 부족과 바이오마커 분석의 복잡성 증가는 성장을 저해하여 비용 상승률을 역사적 평균 이상으로 유지시키고 있습니다.
세계의 임상시험 시장 동향 및 인사이트
분산형 및 하이브리드형 임상시험 플랫폼의 채택 가속
분산형 접근법은 참가자가 원격의료, 지역 실험실 및 가정용 기기를 통해 방문을 완료할 수 있게 하여 이동 부담을 줄이고 유지율을 높입니다. 글로벌 DCT(분산형 임상시험) 수익 규모는 2030년까지 133억 달러에 달할 것으로 예상되며, 이는 연평균 복합 성장률(CAGR) 6.6%에 해당합니다. 환자의 90%가 DCT 참여를 수용 가능하다고 여겨 원격 중심 참여에 대한 강력한 수요를 보여줍니다. 2024년 9월 발표된 미국 FDA의 분산형 임상시험 최종 지침은 데이터 무결성, 사전동의, 안전성 감독에 대한 규제 기준이 현장 기반 연구와 동일함을 확인했습니다. 이에 따라 스폰서들은 기술 검증, 위험 기반 모니터링, 사이버 보안 등 새로운 운영 요건에 직면하게 되었으며, 이는 이미 벤더 선정 기준을 형성하고 CRO의 디지털 플랫폼 투자를 촉진하고 있습니다.
전 세계 희귀질환 및 오피슨 의약품 파이프라인 급증
유전체학과 차세대 염기서열 분석 기술은 수천 가지의 기존 원인 불명 질환에 대한 분자적 원인을 밝혀내며 표적 치료제 개발 붐을 촉발했습니다. 미국 내 약 3천만 명의 희귀질환 환자가 존재함에도 현재 승인된 치료제는 500여 가지에 불과합니다. 미국 희귀의약품법(Orphan Drug Act)에 따른 세제 혜택, 사용자 부담금 면제, 7년간의 시장 독점권은 벤처 및 대형 제약사의 자본 유입을 지속해서 이끌고 있습니다. FDA의 희귀 및 소외질환 치료제 지원 프로그램은 초기 인체 연구의 위험을 추가로 낮춰, 자연사 코호트 수집과 분자적 계층화 개념 증명 시험의 높은 성장을 이끌고 있습니다. 환자 집단이 지리적으로 분산되어 있고 진단 지연 기간이 평균 5-7년에 달해 환자 모집은 여전히 어려운 상황으로, 스폰서들은 글로벌, 다기관 또는 완전 가상 등록 전략으로 전환하고 있습니다.
신흥 시장에서 숙련된 임상시험 코디네이터의 지속적 부족
아시아태평양, 라틴아메리카, 동유럽에서 프로토콜 급증은 ICH-GCP, 원격 데이터 수집, 복잡한 규제 서류에 능숙한 현장 인력 공급을 초과했습니다. 완전히 역량 있는 코디네이터를 양성하려면 2-3년의 멘토링이 필요하며, 이는 오하이오 주립대학의 CAAHEP 인증 임상연구 석사 과정과 같은 신규 임상연구 프로그램의 졸업 속도를 앞지릅니다. 경험이 부족한 팀은 프로토콜 편차 위험을 높이고 모니터링 방문을 연장하며 품질 보증 예산을 압박하여, 원래 해외 아웃소싱을 촉진했던 비용 이점 일부를 잠식합니다. 스폰서들은 직원 교육 모듈을 공급업체 계약에 포함시키고, 모바일 모니터링 유닛을 배치하며, 중앙 통계 모니터링를 강화하는 방식으로 대응하지만, 기술 격차는 여전히 심각한 단기적 병목 현상으로 남아 있습니다.
부문 분석
2024년 임상시험 시장의 55.0%를 차지한 3상 연구는 대규모 다기관 코호트와 규제 등급의 평가변수를 포함하여 CRO 예산의 상당 부분을 차지합니다. 단일 3상 종양학 프로토콜의 환자당 비용은 40,000달러를 초과할 수 있으며, 바이오마커 스크리닝 비용이 지출 증가를 주도하고 있습니다. 그럼에도 적응형 설계가 개념 증명(PoC) 기간을 단축하고 용량 범위 설정과 초기 효능 평가를 결합함에 따라 2상 시험은 6.8% CAGR로 더 빠르게 성장할 전망입니다. 중국의 신속한 IND 심사 절차 덕분에 아시아태평양 지역은 현재 전 세계 1상 시작 건수의 58%를 차지하며 유전적 다양성이 높은 집단에 대한 조기 접근성을 강화하고 있습니다.
후원사는 원활한 1/2상 프레임워크를 도입해 진행 여부 결정 마일스톤을 가속화하고 3상 투자 관문을 설정함으로써 위험 분산과 자산 우선순위 최적화를 도모합니다. 벤처 자본 지원 바이오테크 기업들은 실험실 유전체학 통합 역량을 갖춘 중견 CRO에 이러한 연구를 아웃소싱하는 반면, 대형 제약사는 핵심 치료법에 대해 내부 1상 부서를 유지합니다. 규제 기관은 통계적 엄밀성과 유연성을 조화시킨 지침을 통해 혁신을 지원하며, 새로운 평가 지표와 디지털 바이오마커 도입을 장려합니다. 이러한 추세들은 임상 시험 시장의 대부분 비용을 후기 단계 시험이 흡수하는 가운데, 탐색적 단계에서 더 풍부한 데이터를 확보하는 파이프라인을 강화합니다.
중재적 무작위 대조 시험은 여전히 규제 분야의 골드 스탠다드로, 2024년 수익의 72.3%를 차지하며 대부분의 치료제 위험 계산의 기준이 됩니다. ICH E6(R3) 지침은 비례적 감독을 명시적으로 지지하며, 중간 분석 및 사전 지정된 중지 규칙을 포함하도록 스폰서를 독려함으로써 적응형 프레임워크의 연평균 복합 성장률(CAGR) 8.2%를 촉진합니다. 종양학 분야가 선두에 서 있습니다. 우산형, 바스켓형, 플랫폼형 구조는 공유 대조군을 활용해 등록 부담을 줄이면서 다중 바이오마커 정의 코호트를 병렬로 테스트합니다.
임상시험 시장은 이질성으로 치료 평가가 복잡한 감염성 질환, 신경계 장애, 자가면역 질환 분야에 플랫폼 시험을 점차 통합하고 있습니다. 시뮬레이션 운영 특성 패키지는 오차율 통제를 입증하기 위해 규제 제출물에 동봉되며, 중앙통계모니터링은 기존 현장 검증보다 데이터 이상을 더 신속하게 포착합니다. 마스터 프로토콜 구조의 지속적인 수용은 적응형 선별(adaptive enrichment)의 활용 범위를 넓히며, 유연한 설계가 더 이상 실험적 단계가 아닌 임상시험 시장 내 현대적 증거 생성(evidence generation)의 필수 요소라는 인식을 강화하고 있습니다.
지역 분석
북미는 성숙한 규제 생태계, 선진화된 연구자 네트워크 및 풍부한 과학적 자본을 바탕으로 2024년 글로벌 매출의 49.2%를 창출했습니다. 주 단위 경제 파급 효과는 임상시험 지출의 지역적 가치를 부각시킵니다. 플로리다주는 2024년 활동으로 83억 달러, 텍사스주는 77억 달러, 캘리포니아주는 71억 달러를 확보했습니다. 지역 당국은 분산형 임상시험, 적응형 설계, 실제 세계 증거 통합에 대한 기관 지침에서 드러나듯, 단순한 규모보다 방법론적 혁신을 점점 더 우선시하고 있습니다. 이에 따라 해당 지역의 임상시험 시장은 비용 압박에 직면하여, 스폰서들이 전략적 미국 허브를 유지하면서 낮은 강도의 절차를 해외로 이전하는 하이브리드 모델을 채택하도록 유도하고 있습니다.
아시아태평양 지역은 연평균 7.9% 성장률로 전망되며, 규제 완화, 심사 기간 단축, 대규모 치료 경험이 없는 환자 집단으로 글로벌 임상시험 시장을 재편하고 있습니다. 중국과 인도는 전체 진행 중인 프로토콜의 약 40%를 차지합니다. 한국의 중앙 집중형 IRB 체계, 일본의 재생의학 조건부 승인 절차, 대만의 블록체인 기반 전자 자료 검증용 데이터 무결성 샌드박스는 각각 차별화된 틈새 시장을 형성합니다. 이 지역의 환자당 비용 구조(30-40% 저렴)와 모집 속도(서구 기준 대비 2-3배 빠름)는 매력적인 제안 요소를 창출합니다. 그러나 데이터 개인정보 보호법 규정의 차이와 영어 능력은 국경을 넘는 마스터 프로토콜에 도전 과제를 제기하여, 지역적 노하우와 글로벌 프로세스 표준화를 결합한 CRO 동맹을 촉진하고 있습니다.
유럽은 상당한 과학적 전문성과 특화된 인프라를 유지하고 있으나, 장기화된 시작 일정과 비용 상승 속에서 임상시험 시장 점유율은 점차 하락하고 있습니다. 임상시험규정(CTR)은 중앙 포털을 통한 다국적 승인 절차를 간소화하는 것을 목표로 하며, 유럽의약품청(EMA)은 환자 중심의 결과 측정을 강조합니다. 브렉시트는 추가적인 복잡성을 초래합니다. 영국 스폰서는 이중 규정 준수 체계를 따라야 하지만, 새로운 윈저 프레임워크는 북아일랜드의 데이터 흐름을 용이하게 합니다. 향후 성장은 유럽의 학술 네트워크가 경쟁력을 유지하는 희귀질환, 첨단치료의약품 및 복잡한 통계 방법론 분야에 집중될 전망입니다.
기타 혜택 :
- 엑셀 형식 시장 예측(ME) 시트
- 3개월간의 애널리스트 지원
목차
제1장 서론
- 조사의 전제조건과 시장의 정의
- 조사 범위
제2장 조사 방법
제3장 주요 요약
제4장 시장 상황
- 시장 개요
- 시장 성장 촉진요인
- 분산형 및 하이브리드형의 시험 플랫폼의 도입 가속
- 전 세계 희귀질환 및 오피슨 의약품 파이프라인 급증
- 모집 기간 최적화를 위한 아시아태평양 지역 사이트의 확대 참여
- AI 기반 환자 모집 솔루션으로 향상된 등록 효율성
- 전 세계적으로 시행되는 종양학 임상시험에 대한 정부 인센티브
- 승인 후 연구에서 실세계 증거(RWE) 활용 사례 증가
- 시장 성장 억제요인
- 신흥 시장에서 경험이 풍부한 임상조사 코디네이터의 만성적 부족
- 바이오마커 기반 적응형 설계의 복잡성 및 비용 증가
- 데이터 개인정보 보호법(GDPR, CCPA)에 대한 강화된 모니터링로 인한 전자 동의서 도입 지연
- 서유럽 지역 연구자 및 사이트 관리 수수료의 인플레이션에 따른 상승
- 규제 전망
- Porter's Five Forces 분석
- 신규 참가업체의 위협
- 구매자의 협상력
- 공급기업의 협상력
- 대체품의 위협
- 경쟁 기업간 경쟁 관계
제5장 시장 규모와 성장 예측
- 단계별
- 1상
- 2상
- 3상
- 4상
- 연구설계별
- 중재적/치료 연구
- 관찰 연구
- 확대 접근 연구
- 서비스 유형별
- 프로토콜 설계 및 실현 가능성
- 사이트 선정 및 시작
- 규제 당국에의 신청과 승인
- 임상시험 모니터링
- 데이터 관리 및 생물통계학
- 의학 문서 작성
- 기타 서비스 유형
- 치료 영역별
- 종양학
- 심혈관계
- 신경학
- 감염증
- 대사 장애(당뇨병, 비만)
- 면역학/자가면역
- 기타 치료 영역
- 스폰서 유형별
- 제약 및 바이오 의약품 기업
- 의료기기 기업
- 학술연구기관
- 정부기관 및 비영리단체
- 지역별
- 북미
- 미국
- 캐나다
- 멕시코
- 유럽
- 독일
- 영국
- 프랑스
- 이탈리아
- 스페인
- 기타 유럽
- 아시아태평양
- 중국
- 일본
- 인도
- 한국
- 호주
- 기타 아시아태평양
- 중동 및 아프리카
- GCC
- 남아프리카
- 기타 중동 및 아프리카
- 남미
- 브라질
- 아르헨티나
- 기타 남미
- 북미
제6장 경쟁 구도
- 시장 집중도
- 전략적 움직임(M&A, 파트너십, 자금 조달)
- 시장 점유율 분석
- 기업 프로파일
- IQVIA Holdings Inc.
- Laboratory Corporation of America Holdings(Labcorp)
- ICON plc
- Syneos Health
- Parexel International Corp.
- Thermo Fisher Scientific Inc.(PPD)
- Lilly(Lilly Clinical Innovation)
- Pfizer Inc.
- Medpace Holdings Inc.
- Charles River Laboratories International Inc.
- Caidya
- ACM Global Laboratories
- Wuxi AppTec Co. Ltd.
- ClinChoice
- KCR SA
- Pharmaron Inc.
- Novotech
- Aragen Life Sciences Ltd.
제7장 시장 기회와 장래의 전망
HBR 25.11.14The clinical trials market is estimated to generate USD 90.1 billion in 2025 and is set to widen to USD 123.5 billion in 2030, translating to a 6.51% CAGR between 2025 and 2030.
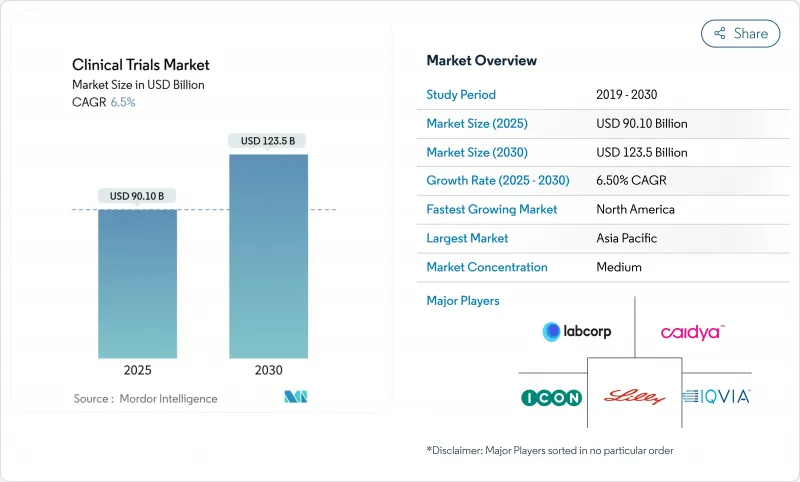
Commercial sponsors are pivoting toward decentralized or hybrid execution models to contain site-related expenses, shorten enrollment timelines and support real-time oversight enabled by connected devices. Final adoption of the ICH E6(R3) Good Clinical Practice guideline in January 2025 is accelerating this shift by formally endorsing risk-based quality management, pragmatic data collection and remote-first monitoring. Oncology retains the largest share of global protocol starts, yet neurology, rare diseases and cell-and-gene therapies are expanding faster because they benefit from adaptive designs and biomarker-guided cohort enrichment. Contract research organizations (CROs) defend margins through technology investment, while emerging mid-tier specialists chip away at large-cap incumbents by offering therapeutic depth and region-specific regulatory expertise. Persistent shortages of experienced site personnel and rising biomarker-assay complexity temper growth, keeping cost inflation above historical norms.
Global Clinical Trials Market Trends and Insights
Accelerated Adoption of Decentralized & Hybrid Trial Platforms
Decentralized approaches allow participants to complete visits through tele-health, local labs and at-home devices, reducing travel burden and increasing retention. The global DCT revenue pool is forecast to reach USD 13.3 billion by 2030, equal to a 6.6% CAGR. Ninety-percent of patients consider DCT participation acceptable, underscoring strong demand for remote-first engagement. The US FDA's final guidance on decentralized clinical trials, issued in September 2024, confirms that regulatory expectations for data integrity, informed consent and safety oversight remain identical to those for site-based studies. Sponsors therefore face new operational requirements around technology qualification, risk-based monitoring and cybersecurity, which are already shaping vendor selection criteria and driving CRO investment in digital platforms.
Surge in Rare-Disease and Orphan-Drug Pipelines Globally
Genomics and next-generation sequencing have illuminated molecular causes for thousands of previously idiopathic disorders, triggering a wave of targeted therapy programs. Although roughly 30 million US residents live with rare diseases, only 500 conditions currently have approved treatments. Tax incentives, user-fee waivers and seven-year exclusivity under the US Orphan Drug Act continue to attract venture and large-pharma capital. FDA's Therapeutics for Rare and Neglected Diseases grant program further de-risks early human studies, leading to high growth in natural-history cohort collection and molecularly stratified proof-of-concept trials. Recruitment remains difficult because patient populations are geographically dispersed and diagnostic latency averages five to seven years, pushing sponsors toward global, multi-site or fully virtual enrollment strategies.
Persistent Shortages of Experienced Clinical Research Coordinators in Emerging Markets
Rapid protocol growth in Asia-Pacific, Latin America and Eastern Europe has outstripped the supply of site staff proficient in ICH-GCP, remote-data collection and complex regulatory dossiers. Developing a fully competent coordinator takes two to three years of mentored exposure, outpacing the graduation rate of new clinical-research programs such as the CAAHEP-accredited Master of Clinical Research offered by The Ohio State University. Inexperienced teams elevate protocol-deviation risk, prolong monitoring visits and strain quality-assurance budgets, eroding some of the cost advantages that originally motivated offshoring. Sponsors respond by bundling staff-training modules into vendor contracts, deploying mobile monitoring units and increasing central-statistical surveillance, but skills gaps remain an acute short-term bottleneck.
Other drivers and restraints analyzed in the detailed report include:
- Growing Inclusion of Asia-Pacific Sites to Optimize Recruitment Timelines
- AI-Enabled Patient Recruitment Solutions Improving Enrollment Efficiency
- Rising Complexity & Cost of Biomarker-Driven Adaptive Designs
For complete list of drivers and restraints, kindly check the Table Of Contents.
Segment Analysis
Phase III studies captured 55.0% of the clinical trials market in 2024 because they involve large multicenter cohorts and regulatory-grade endpoints that command premium CRO budgets. A single Phase III oncology protocol can top USD 40,000 per patient, with biomarker screening costs fueling expenditure growth. Nevertheless, Phase II trials will expand faster at 6.8% CAGR as adaptive designs compress proof-of-concept timelines and combine dose-ranging with early efficacy. The Asia-Pacific region now hosts 58% of global Phase I starts thanks to China's expedited IND review pathway, bolstering early access to genetically diverse populations.
Sponsors deploy seamless Phase I/II frameworks to accelerate go/no-go milestones and gate Phase III investment, an approach that spreads risk and optimizes asset prioritization. Venture-backed biotech companies frequently outsource these studies to mid-tier CROs with laboratory genomics integration, while large pharma maintains internal Phase I units for flagship modalities. Regulatory agencies support innovation through guidance that balances statistical rigor with flexibility, incentivizing novel endpoints and digital biomarker inclusion. Together these trends reinforce a pipeline where exploratory phases become more data-rich even as late-stage trials keep absorbing the majority of spend in the clinical trials market.
Interventional randomized controlled trials remain the regulatory gold standard, absorbing 72.3% revenue in 2024 and anchoring risk calculations for most therapeutics. The ICH E6(R3) guidance explicitly endorses proportionate oversight, encouraging sponsors to embed interim analyses and pre-specified stopping rules, thereby fueling 8.2% CAGR for adaptive frameworks. Oncology is at the forefront: umbrella, basket and platform structures test multiple biomarker-defined cohorts in parallel, leveraging shared control arms to cut enrollment burden.
The clinical trials market increasingly integrates platform trials for infectious diseases, neurologic disorders and autoimmune conditions where heterogeneity complicates treatment evaluation. Simulated-operating-characteristic packages accompany regulatory submissions to demonstrate error-rate control, and central-statistical monitoring flags data anomalies faster than traditional on-site verification. Continued acceptance of master-protocol constructs widens the use of adaptive enrichment, reinforcing the perception that flexible design is no longer experimental but an essential feature of modern evidence generation within the clinical trials market.
The Clinical Trials Market Report is Segmented by Phase (Phase I, Phase II, Phase III, and Phase IV), Study Design (Diagnostic Radiology, and More), Service Type (Protocol Design & Feasibility, and More), Therapeutic Area (Oncology, and More), Sponsor Type (Pharmaceutical & Biopharmaceutical Companies, and More), and Geography (North America, Europe, and More). The Market Forecasts are Provided in Terms of Value (USD).
Geography Analysis
North America generated 49.2% of global revenue in 2024, supported by a mature regulatory ecosystem, advanced investigator networks and abundant scientific capital. State-level economic multipliers highlight the local value of trial spending: Florida captured USD 8.3 billion, Texas USD 7.7 billion and California USD 7.1 billion in 2024 activity. Regional authorities increasingly prioritize methodological innovation over sheer volume, evidenced by agency guidance on decentralized trials, adaptive designs and real-world-evidence integration. The clinical trials market here faces cost pressure, driving sponsors to hybrid models that retain strategic US hubs while offshoring lower-intensity procedures.
Asia-Pacific is forecast to grow at 7.9% CAGR, reshaping the global clinical trials market through regulatory liberalization, accelerated review timelines and large treatment-naive populations. China and India together represent nearly 40% of total active protocols. South Korea's centralized IRB framework, Japan's conditional approval pathway for regenerative medicine, and Taiwan's data-integrity sandbox for blockchain-based e-source verification collectively establish differentiated niches. The region's cost structure-30-40% cheaper per patient-and recruitment speed-two to three times faster than Western benchmarks-create a compelling proposition. However, variation in data-privacy statutes and English-language proficiency poses cross-border master-protocol challenges, prompting CRO alliances that blend regional know-how with global process standardization.
Europe retains considerable scientific expertise and specialized infrastructure, yet its relative share of the clinical trials market has edged downward amid protracted startup timelines and cost inflation. The Clinical Trials Regulation (CTR) aims to streamline multi-member-state permissions through a centralized portal, while the European Medicines Agency emphasizes patient-focused outcome measurement. Brexit introduces an extra layer of complexity: UK sponsors must navigate dual compliance tracks, although the new Windsor Framework facilitates data flow for Northern Ireland. Future growth will likely concentrate on rare diseases, advanced therapy medicinal products and complex statistical methods where Europe's academic networks retain competitive strength.
- IQVIA
- LabCorp
- ICON
- Syneos Health
- Parexel International Corp.
- Thermo Fisher Scientific Inc. (PPD)
- Lilly (Lilly Clinical Innovation)
- Pfizer
- MedPace
- Charles River
- Caidya
- ACM Global Laboratories
- Wuxi AppTec Co. Ltd.
- ClinChoice
- KCR S.A.
- Pharmaron Inc.
- Novotech
- Aragen Life Sciences Ltd.
Additional Benefits:
- The market estimate (ME) sheet in Excel format
- 3 months of analyst support
TABLE OF CONTENTS
1 Introduction
- 1.1 Study Assumptions & Market Definition
- 1.2 Scope of the Study
2 Research Methodology
3 Executive Summary
4 Market Landscape
- 4.1 Market Overview
- 4.2 Market Drivers
- 4.2.1 Accelerated Adoption of Decentralized & Hybrid Trial Platforms
- 4.2.2 Surge in Rare-Disease and Orphan-Drug Pipelines Globally
- 4.2.3 Growing Inclusion of Asia-Pacific Sites to Optimize Recruitment Timelines
- 4.2.4 AI-Enabled Patient Recruitment Solutions Improving Enrollment Efficiency
- 4.2.5 Government Incentives for Oncology Trials Globally
- 4.2.6 Rising Use-case of Real-World Evidence (RWE) Post-Approval Studies
- 4.3 Market Restraints
- 4.3.1 Persistent Shortages of Experienced Clinical Research Coordinators in Emerging Markets
- 4.3.2 Rising Complexity & Cost of Biomarker-Driven Adaptive Designs
- 4.3.3 Increased Scrutiny Around Data-Privacy Laws (GDPR, CCPA) Hindering e-Consent Roll-outs
- 4.3.4 Inflation-driven Escalation of Investigator and Site Management Fees in Western Europe
- 4.4 Regulatory Outlook
- 4.5 Porter's Five Forces Analysis
- 4.5.1 Threat of New Entrants
- 4.5.2 Bargaining Power of Buyers
- 4.5.3 Bargaining Power of Suppliers
- 4.5.4 Threat of Substitutes
- 4.5.5 Intensity of Competitive Rivalry
5 Market Size & Growth Forecasts (Value, USD)
- 5.1 By Phase
- 5.1.1 Phase I
- 5.1.2 Phase II
- 5.1.3 Phase III
- 5.1.4 Phase IV
- 5.2 By Study Design
- 5.2.1 Interventional / Treatment Studies
- 5.2.2 Observational Studies
- 5.2.3 Expanded Access Studies
- 5.3 By Service Type
- 5.3.1 Protocol Design & Feasibility
- 5.3.2 Site Identification & Start-up
- 5.3.3 Regulatory Submission & Approval
- 5.3.4 Clinical Trial Monitoring
- 5.3.5 Data Management & Biostatistics
- 5.3.6 Medical Writing
- 5.3.7 Other Service Types
- 5.4 By Therapeutic Area
- 5.4.1 Oncology
- 5.4.2 Cardiovascular
- 5.4.3 Neurology
- 5.4.4 Infectious Diseases
- 5.4.5 Metabolic Disorders (Diabetes, Obesity)
- 5.4.6 Immunology / Autoimmune
- 5.4.7 Other Therapeutic Areas
- 5.5 By Sponsor Type
- 5.5.1 Pharmaceutical & Biopharmaceutical Companies
- 5.5.2 Medical Device Companies
- 5.5.3 Academic & Research Institutes
- 5.5.4 Government & Non-profit Organizations
- 5.6 Geography
- 5.6.1 North America
- 5.6.1.1 United States
- 5.6.1.2 Canada
- 5.6.1.3 Mexico
- 5.6.2 Europe
- 5.6.2.1 Germany
- 5.6.2.2 United Kingdom
- 5.6.2.3 France
- 5.6.2.4 Italy
- 5.6.2.5 Spain
- 5.6.2.6 Rest of Europe
- 5.6.3 Asia-Pacific
- 5.6.3.1 China
- 5.6.3.2 Japan
- 5.6.3.3 India
- 5.6.3.4 South Korea
- 5.6.3.5 Australia
- 5.6.3.6 Rest of Asia-Pacific
- 5.6.4 Middle-East and Africa
- 5.6.4.1 GCC
- 5.6.4.2 South Africa
- 5.6.4.3 Rest of Middle East and Africa
- 5.6.5 South America
- 5.6.5.1 Brazil
- 5.6.5.2 Argentina
- 5.6.5.3 Rest of South America
- 5.6.1 North America
6 Competitive Landscape
- 6.1 Market Concentration
- 6.2 Strategic Moves (M&A, Partnerships, Funding)
- 6.3 Market Share Analysis
- 6.4 Company Profiles (includes Global level Overview, Market level overview, Core Business Segments, Financials, Headcount, Key Information, Market Rank, Market Share, Products and Services, and analysis of Recent Developments)
- 6.4.1 IQVIA Holdings Inc.
- 6.4.2 Laboratory Corporation of America Holdings (Labcorp)
- 6.4.3 ICON plc
- 6.4.4 Syneos Health
- 6.4.5 Parexel International Corp.
- 6.4.6 Thermo Fisher Scientific Inc. (PPD)
- 6.4.7 Lilly (Lilly Clinical Innovation)
- 6.4.8 Pfizer Inc.
- 6.4.9 Medpace Holdings Inc.
- 6.4.10 Charles River Laboratories International Inc.
- 6.4.11 Caidya
- 6.4.12 ACM Global Laboratories
- 6.4.13 Wuxi AppTec Co. Ltd.
- 6.4.14 ClinChoice
- 6.4.15 KCR S.A.
- 6.4.16 Pharmaron Inc.
- 6.4.17 Novotech
- 6.4.18 Aragen Life Sciences Ltd.
7 Market Opportunities & Future Outlook
- 7.1 White-space & Unmet-Need Assessment
