|
시장보고서
상품코드
1934725
농업용 생물학적 제제 : 시장 점유율 분석, 업계 동향과 통계, 성장 예측(2026-2031년)Agricultural Biologicals - Market Share Analysis, Industry Trends & Statistics, Growth Forecasts (2026 - 2031) |
||||||
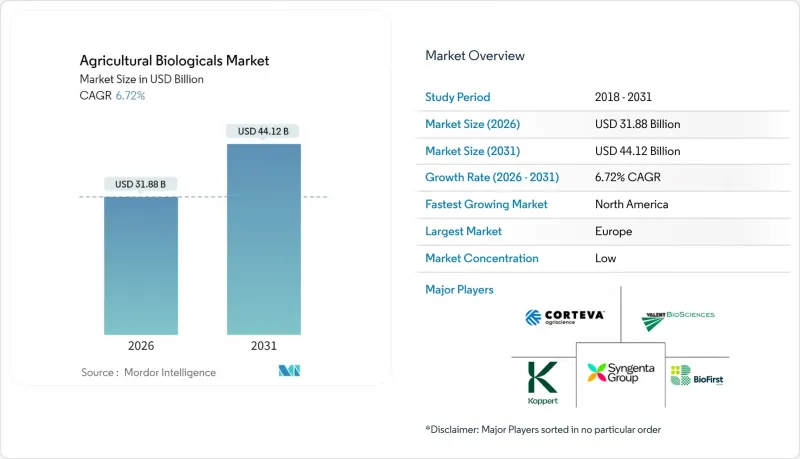
농업용 생물학적 제제 시장은 2025년 298억 7,000만 달러에서 2026년에는 318억 8,000만 달러로 성장하고, 2026-2031년 CAGR 6.72%로 성장을 지속하여, 2031년까지 441억 2,000만 달러에 이를 것으로 예측되고 있습니다.

합성 잔류물에 대한 규제 당국의 감시 강화, 농가의 토양 건강 솔루션에 대한 수요, 인공지능을 활용한 균주 발견의 가속화가 결합하여 시장 성장을 가속하고 있습니다. 대형 식품 소매업체들이 잔류 기준을 강화함에 따라 유기농 인증 농장을 넘어 대상 기반이 확대되고 있습니다. 미생물 연구개발(R&:D) 주기가 빨라지면서 상용화 후보물질이 몇 년이 아닌 몇 달 만에 제공되어 시장 출시 시간이 단축되고 경쟁이 치열해지고 있습니다. 현지 생산과 농장 내 발효에 대한 기업의 자본투입은 물류비용을 절감하고 지리적 범위를 확장하고 있습니다.
세계 농업용 생물학적 제제 시장 동향과 인사이트
유기농 및 무농약 농산물에 대한 수요 증가
미국의 유기농 식품 매출은 2024년 4.6% 증가하여 672억 달러에 달할 것으로 예측됩니다. 이는 농약 잔류물에 대한 소비자들의 높아진 경각심을 반영합니다. 인증 농산물의 프리미엄 가격 설정은 재래식 농가가 소매업체의 엄격한 검사 기준을 통과하기 위해 생물학적 자재를 도입하도록 유도하고 있습니다. 식품 안전이 가정의 관심사 중 가장 높은 비중을 차지하는 아시아 중산층 확대 지역에서도 비슷한 경향을 볼 수 있습니다. 슈퍼마켓이 자체 잔류 기준을 강화하는 가운데, 생물학적 솔루션은 많은 공급 계약에서 임의에서 필수로 전환되고 있습니다. 이러한 견인 효과로 인해 바이오 비료, 바이오 자극제, 바이오 농약의 각 카테고리에서 지속적인 수요가 촉진되고 있습니다.
합성농약에 대한 전 세계 규제 강화
유럽연합(EU)은 2020년 이후 '농장에서 식탁까지' 전략에 따라 70여 종의 유효성분을 금지한 반면, 미국 환경보호청(EPA)은 적격 미생물 농약의 신속한 등록을 허용하고 있습니다. 잔류 기준치 강화로 인해 많은 합성 제품의 상업적 수명이 단축되고 있습니다. 농부들은 화학농약의 선택지가 줄어들고 있는 가운데, 약 18개월 만에 규제 장벽을 통과하는 생물학적 대체품의 전략적 가치가 높아지고 있습니다. 이는 기존 활성 성분의 절반에 해당하는 기간입니다. 정책 입안자들의 위험 감소에 대한 합의는 생물학적 농약의 장기적인 수요 기반을 강화하고 있습니다.
많은 제제의 짧은 유통기한과 콜드체인 의존성 문제
많은 생균제제는 2℃-8℃에서 보관해야 하며, 냉장 트럭 운송이 제한된 지역에서는 유통비용이 최대 40%까지 증가할 수 있습니다. 최종 배송 단계에서 고온에 노출되면 생존균수가 크게 감소하여 밭에서 효과를 떨어뜨리고 농가의 신뢰를 떨어뜨릴 수 있습니다. 동남아시아, 사하라 이남 아프리카 등 열대 시장에서는 가장 높은 열화율이 발생하고 있으며, 보존 안정성이 높은 제제가 빠르게 보급되지 않는 한 판매량 증가를 제약하는 요인이 될 수 있습니다.
부문 분석
2025년 농업용 생물학적 제제 시장에서 작물 영양 분야는 63.55%의 압도적인 점유율을 유지했습니다. 이는 생산자가 토양 미생물의 회복력과 양분 이용 효율을 우선시한 결과입니다. 이 부문의 우위는 합성비료 수요 감소에 따른 실질적인 비용 절감과 탄소배출권 수익 개선에 기인합니다. 이 범주 내에서 질소 고정 기능을 가진 바이오 비료는 에이커당 최대 50파운드 상당의 질소를 공급하여 직접적으로 자재 구매 비용을 절감할 수 있습니다. 또한, 바이오 자극제는 비생물학적 스트레스 내성을 높여 부가가치를 제공하며, 기후 변화의 확대가 우려되는 상황에서 높은 평가를 받고 있는 특성입니다.
작물 영양 분야는 6.78%의 연평균 복합 성장률(CAGR)로 다른 모든 기능을 능가하는 견조한 성장세를 보이고 있습니다. 또한, 작물 영양 분야의 성숙도에 따라 판매량 측면에서의 우위가 지속될 것으로 예측됩니다. 그러나 제조업체들이 기능적 가치 제안을 추구하면서 영양과 보호 기능을 결합한 복합 제품으로 포트폴리오 다각화가 진행되고 있습니다.
수량 지표를 넘어 혁신의 강도가 기업 간 차별화 요소가 됩니다. AI에 의한 균주 선택은 차세대 접종제의 기반이 되며, 정밀한 대사산물 프로파일을 제공함으로써 시행착오 비용을 줄이고 밭에서 균일성을 향상시킬 수 있습니다. 영양제 배합에서는 미생물을 자외선과 건조로부터 보호하는 운반체 화학물질의 통합이 진행되어 냉장보관이 필요 없는 18개월의 유통기한을 실현했습니다.
농업용 생물제품 시장 보고서는 기능별(작물 영양 분야: 유기질 비료, 바이오 비료, 바이오 자극제), 작물 보호 분야(바이오 농약, 생물방제제), 작물 유형별(조작물, 원예작물, 환금작물), 지역별(북미, 남미, 유럽, 기타)로 분류되어 있습니다. 시장 예측은 금액(USD) 및 수량(미터톤)으로 제공됩니다.
지역별 분석
유럽은 유럽연합(EU)의 화학물질 금지와 유기농업 전환에 대한 재정적 지원책에 힘입어 2025년 농업용 생물학적 제품 시장에서 34.05%의 점유율을 차지했습니다. 회원국들은 에코시스템 지불금에서 생물학적 투입비용의 최대 25%를 상환하여 생산자의 투자 회수 기간을 단축하고 있습니다. 규모에 비해 고부가가치 과수 부문은 보급률이 100%에 가까워 확대가 완만하며, 유럽 공급업체들은 기술제휴를 통해 규제 관련 전문지식과 제제를 수출하는 방향으로 전환하고 있습니다.
북미는 2031년까지 8.55%의 가장 빠른 CAGR을 기록했습니다. 생명공학 조정 프레임워크는 미생물 승인을 간소화하고, 중앙값 18개월로 처리함으로써 제품 파이프라인 통과를 촉진하고 있습니다. 코테바와 BASF의 국내 발효 공장에 대한 설비투자는 7억 달러가 넘으며, 장기적인 노력을 보여주고 있습니다. 캐나다와의 국경 간 규제 조화로 인접한 잠재 시장이 더욱 확대되는 한편, 멕시코의 수출 지향적 과수 부문에서는 유럽의 잔류 기준을 충족하기 위해 바이오 농약이 채택되고 있습니다.
아시아태평양은 새로운 성장 지역으로 부상하고 있으며, 인도가 2024년 15종의 바이오 농약을 신속 승인한 것과 중국이 농가 구매 금액의 최대 30%를 돌려주는 보조금 프로그램을 시행하고 있는 것이 그 견인차 역할을 하고 있습니다. 분산형 생산기지에 대한 투자로 콜드체인 문제를 완화하고, 열대 지역의 소규모 농가 시스템에서도 바이오 농약을 도입할 수 있게 되었습니다. 화학물질 과다 사용과 토양 오염에 대한 소비자들의 반발이 커지고 있는 것도 지역 시장 성장에 기여하고 있습니다. 남미에서는 브라질의 대두 생산 우위를 바탕으로 견조한 물량 성장이 지속되고 있습니다. 현지 발효 능력과 브라질의 IN 36 신속 승인 프로세스는 허가 비용을 절감하고, 세라도 지역의 토양에 특화된 국내 및 다국적 기업의 제품 출시를 촉진하고 있습니다. 아르헨티나와 칠레에서는 유럽 수입국의 잔류기준 강화에 대응하고 수출 경쟁력을 유지하기 위해 채택이 가속화되고 있습니다.
기타 특전:
- 엑셀 형식 시장 예측(ME) 시트
- 애널리스트의 3개월간 지원
자주 묻는 질문
목차
제1장 서론
제2장 주요 요약 및 주요 조사 결과
제3장 보고서 제공
제4장 주요 업계 동향
제5장 시장 규모와 성장 예측(금액 및 수량)
제6장 경쟁 구도
제7장 CEO에 대한 주요 전략적 질문
LSH 26.03.03The agricultural biologicals market is expected to grow from USD 29.87 billion in 2025 to USD 31.88 billion in 2026 and is forecast to reach USD 44.12 billion by 2031 at 6.72% CAGR over 2026-2031.
Escalating regulatory scrutiny of synthetic residues, farmer demand for soil health solutions, and the acceleration of artificial intelligence-enabled strain discovery collectively propel growth. Large food retailers are tightening residue standards, widening the addressable base beyond certified-organic farms. Rapid microbial research and development (R&D) cycles now deliver commercial candidates in months instead of years, compressing time-to-market and intensifying competitive churn. Corporate capital commitments to local manufacturing and on-farm fermentation lower logistics costs and widen geographic reach.
Global Agricultural Biologicals Market Trends and Insights
Rising Demand for Organic, Residue-Free Produce
Organic food sales in the United States rose 4.6% to USD 67.2 billion in 2024, reflecting shoppers' heightened vigilance over pesticide residues. Premium pricing for certified produce incentivizes conventional growers to adopt biological inputs that help them clear stringent retailer tests. Similar patterns unfold in expanding middle-income segments of Asia, where food safety ranks high among household concerns. As supermarkets tighten private residue standards, biological solutions move from optional to compulsory within many supply contracts. The pull effect boosts recurring demand across biofertilizer, biostimulant, and biopesticide categories.
Stringent Global Curbs on Synthetic Agro-Chemicals
The European Union has banned more than 70 active ingredients since 2020 under its Farm to Fork Strategy, whereas the United States Environmental Protection Agency allows fast-track registration for eligible microbial pesticides. Tighter maximum residue limits shorten the commercial life of many synthetic products. Farmers now face fewer chemical options, raising the strategic value of biological substitutes that clear regulatory hurdles in roughly 18 months, half the timeline of conventional actives. Policymakers' alignment on risk-reduction amplifies the long-run demand floor for biologicals.
Short Shelf Life and Cold-Chain Dependence Of Many Formulations
Many live-culture formulations require storage between 2 °C and 8 °C, which can increase distribution costs by up to 40% where refrigerated trucking is limited. Heat exposure during last-mile delivery can significantly reduce viable colony counts and compromise field performance, eroding farmer confidence. Tropical markets in Southeast Asia and sub-Saharan Africa experience the highest spoilage rates, which constrain volume growth unless shelf-stable formulations scale rapidly.
Other drivers and restraints analyzed in the detailed report include:
- Integration of Biologicals into Corporate IPM Programs
- Carbon-Credit Revenue from Regenerative Farming Practices
- Complex, Non-Harmonized Registration Pathways
For complete list of drivers and restraints, kindly check the Table Of Contents.
Segment Analysis
Crop nutrition maintained a commanding 63.55% share of the agricultural biologicals market in 2025 as growers prioritized soil microbiome resilience and nutrient-use efficiency. The segment's leadership reflects tangible cost savings from reduced synthetic fertilizer demand and improved carbon-credit earnings. Within this category, biofertilizers that fix nitrogen deliver up to 50 pounds per acre equivalence, directly lowering input purchases. Biostimulants extend benefits by enhancing abiotic stress tolerance, a valued trait amid widening climate variability.
Crop nutrition is growing at a robust pace, outpacing all other functions with a 6.78% CAGR. In addition, the maturity of crop nutrition ensures continued volume dominance. However, portfolio diversification into combined nutrition-protection products is rising as manufacturers pursue cross-functional value propositions.
Beyond volume metrics, innovation intensity differentiates players. AI-guided strain selection now underpins next-generation inoculants that deliver precise metabolite profiles, cutting trial-and-error costs while elevating field consistency. Nutrient formulations are increasingly integrating carrier chemistries that shield microbes from UV radiation and desiccation, extending shelf life to 18 months without refrigeration.
The Agricultural Biologicals Market Report is Segmented by Function (Crop Nutrition Into Organic Fertilizers, Biofertilizers, and Biostimulants); (Crop Protection Into Biopesticides and Biocontrol Agents), by Crop Type (Row Crops, Horticultural Crops, Cash Crops), and Geography (North America, South America, Europe, and More). The Market Forecasts are Provided in Terms of Value (USD) and Volume (Metric Tons).
Geography Analysis
Europe held a 34.05% share of the agricultural biologicals market in 2025, underpinned by the European Union's combination of chemical bans and financial stimuli for organic transitions. Member states reimburse up to 25% of biological input costs within eco-scheme payments, shortening grower payback horizons. Despite its scale, expansion moderates as penetration nears 100% in high-value fruit sectors, prompting European suppliers to pivot outward and export regulatory expertise and formulations through technology partnerships.
North America registered the fastest 8.55% CAGR by 2031. The Coordinated Framework for Biotechnology simplifies microbial approvals to an 18-month median, catalyzing product pipeline throughput. Capital spending on domestic fermentation plants by Corteva and BASF exceeds USD 700 million, signaling a long-term commitment. Cross-border regulatory alignment with Canada further enlarges the contiguous addressable market, while Mexico's export-oriented fruit sector adopts biologicals to meet European residue limits.
The Asia-Pacific region stands as the emerging frontier, driven by India's expedited clearance of 15 biological pesticides in 2024 and China's subsidy program, which rebates up to 30% of farmers' purchases. Investment in decentralized production hubs mitigates cold-chain gaps, making biologicals viable in tropical smallholder systems. Regional market growth also benefits from mounting consumer backlash against chemical overuse and soil contamination. South America sustains robust volume growth anchored in Brazil's soybean dominance. Local fermentation capacity and Brazil's IN 36 fast-track process reduce approval costs, catalyzing a surge in domestic and multinational launches tailored to Cerrado soils. Argentina and Chile accelerate adoption to preserve export competitiveness as European importers enforce tougher residue ceilings.
- Corteva Agriscience
- BASF SE
- Bayer AG
- Syngenta AG
- UPL Limited
- Novonesis A/S
- Koppert Biological Systems B.V.
- Biofirst Group NV
- Valent BioSciences LLC
- FMC Corporation
- Rovensa S.A.
- Certis USA LLC
- ProFarm Group Inc.
- Andermatt Biocontrol AG
- Yara International ASA
Additional Benefits:
- The market estimate (ME) sheet in Excel format
- 3 months of analyst support
TABLE OF CONTENTS
1 Introduction
- 1.1 Study Assumptions and Market Definition
- 1.2 Scope of the Study
- 1.3 Research Methodology
2 Executive Summary and Key Findings
3 Report Offers
4 Key Industry Trends
- 4.1 Area Under Organic Cultivation
- 4.2 Per Capita Spending On Organic Products
- 4.3 Regulatory Framework
- 4.3.1 Argentina
- 4.3.2 Australia
- 4.3.3 Brazil
- 4.3.4 Canada
- 4.3.5 China
- 4.3.6 Egypt
- 4.3.7 France
- 4.3.8 Germany
- 4.3.9 India
- 4.3.10 Indonesia
- 4.3.11 Italy
- 4.3.12 Japan
- 4.3.13 Mexico
- 4.3.14 Netherlands
- 4.3.15 Nigeria
- 4.3.16 Philippines
- 4.3.17 Russia
- 4.3.18 South Africa
- 4.3.19 Spain
- 4.3.20 Thailand
- 4.3.21 Turkey
- 4.3.22 United Kingdom
- 4.3.23 United States
- 4.3.24 Vietnam
- 4.4 Value Chain & Distribution Channel Annalysis
- 4.5 Market Drivers
- 4.5.1 Rising demand for organic, residue-free produce
- 4.5.2 Stringent global curbs on synthetic agro-chemicals
- 4.5.3 Integration of biologicals into corporate IPM programs
- 4.5.4 Carbon-credit revenue from regenerative farming practices
- 4.5.5 AI-enabled microbial-strain discovery accelerates R&D cycles
- 4.5.6 On-farm fermentation and local bio-input manufacturing models
- 4.6 Market Restraints
- 4.6.1 Short shelf-life and cold-chain dependence of many formulations
- 4.6.2 Complex, non-harmonized registration pathways
- 4.6.3 Proliferation of counterfeit and sub-standard biologicals
- 4.6.4 Volatile supply of critical feedstocks such as seaweed
5 Market Size and Growth Forecasts (Value and Volume)
- 5.1 By Function
- 5.1.1 Crop Nutrition
- 5.1.1.1 Organic Fertilizers
- 5.1.1.2 Biofertilizers
- 5.1.1.3 Biostimulants
- 5.1.2 Crop Protection
- 5.1.2.1 Biopesticides
- 5.1.2.2 Biocontrol Agents
- 5.1.1 Crop Nutrition
- 5.2 By Crop Type
- 5.2.1 Row Crops
- 5.2.2 Horticultural Crops
- 5.2.3 Cash Crops
- 5.3 By Geography
- 5.3.1 North America
- 5.3.1.1 United States
- 5.3.1.2 Canada
- 5.3.1.3 Mexico
- 5.3.1.4 Rest of North America
- 5.3.2 South America
- 5.3.2.1 Brazil
- 5.3.2.2 Argentina
- 5.3.2.3 Rest of South America
- 5.3.3 Europe
- 5.3.3.1 Germany
- 5.3.3.2 United Kingdom
- 5.3.3.3 France
- 5.3.3.4 Spain
- 5.3.3.5 Italy
- 5.3.3.6 Netherlands
- 5.3.3.7 Russia
- 5.3.3.8 Turkey
- 5.3.3.9 Rest of Europe
- 5.3.4 Asia-Pacific
- 5.3.4.1 China
- 5.3.4.2 India
- 5.3.4.3 Japan
- 5.3.4.4 Australia
- 5.3.4.5 Vietnam
- 5.3.4.6 Thailand
- 5.3.4.7 Indonesia
- 5.3.4.8 Philippines
- 5.3.4.9 Rest of Asia-Pacific
- 5.3.5 Middle East
- 5.3.5.1 Iran
- 5.3.5.2 Saudi Arabia
- 5.3.5.3 Rest of Middle East
- 5.3.6 Africa
- 5.3.6.1 South Africa
- 5.3.6.2 Nigeria
- 5.3.6.3 Egypt
- 5.3.6.4 Rest of Africa
- 5.3.1 North America
6 Competitive Landscape
- 6.1 Market Concentration
- 6.2 Strategic Moves
- 6.3 Market Share Analysis
- 6.4 Company Profiles (includes Global Overview, Market Overview, Core Segments, Financials, Strategic Information, Market Rank/Share, Products & Services, and Recent Developments)
- 6.4.1 Corteva Agriscience
- 6.4.2 BASF SE
- 6.4.3 Bayer AG
- 6.4.4 Syngenta AG
- 6.4.5 UPL Limited
- 6.4.6 Novonesis A/S
- 6.4.7 Koppert Biological Systems B.V.
- 6.4.8 Biofirst Group NV
- 6.4.9 Valent BioSciences LLC
- 6.4.10 FMC Corporation
- 6.4.11 Rovensa S.A.
- 6.4.12 Certis USA LLC
- 6.4.13 ProFarm Group Inc.
- 6.4.14 Andermatt Biocontrol AG
- 6.4.15 Yara International ASA