
|
시장보고서
상품코드
1906884
바이오 농약 : 시장 점유율 분석, 업계 동향 및 통계, 성장 예측(2026-2031년)Biopesticides - Market Share Analysis, Industry Trends & Statistics, Growth Forecasts (2026 - 2031) |
||||||
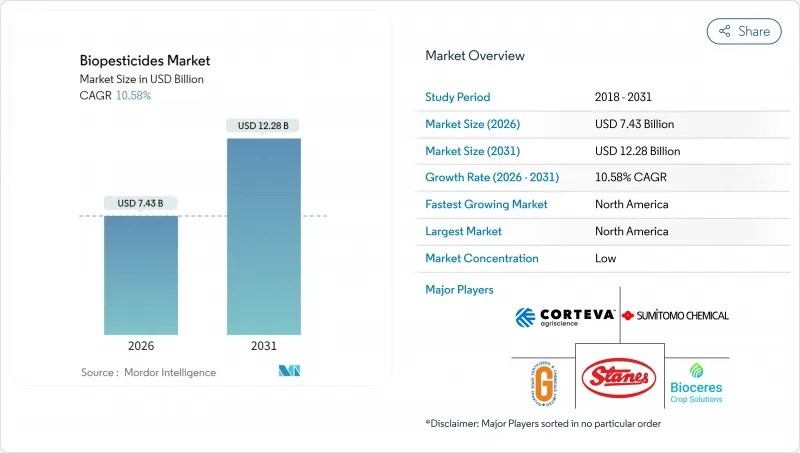
2026년 바이오 농약 시장 규모는 74억 3,000만 달러로 추정되고, 2025년 67억 2,000만 달러에서 성장했으며, 2031년에는 122억 8,000만 달러에 이를 것으로 예상됩니다.
2026년부터 2031년까지의 연평균 성장률(CAGR)은 10.58%를 나타낼 전망입니다.
합성화학물질에 대한 규제당국의 감시 강화, 유기농지의 급속한 확대, 발효서비스 플랫폼의 상승이 결합되어 미생물 기반 솔루션의 상업화가 가속화되고 있습니다. 브라질에서는 2024년 12월에 시행된 통일 바이오인풋법에 의해 생물학적 제품의 승인 기간이 단축되고, 다른 신흥 시장도 이에 추종하기 시작하고 있습니다. 한편, 북미 생산자는 성숙한 제어 환경 농업 인프라와 개혁된 미국 조정 프레임워크(USCF)를 기반으로 하는 효율적인 심사 과정을 통해 세계 도입을 선도하고 있습니다. 특히 비늘눈 해충에서 살충제 내성의 심각화는 농작물과 원예작물 생산자 모두를 기존의 화학농약을 보완하는 생물학적 작용기전으로 향하게 하고 있습니다.
세계의 바이오 농약 시장 동향과 인사이트
합성농약에 대한 세계의 규제 강화
유럽연합(EU)의 '농장에서 식탁까지' 전략은 2030년까지 화학농약 사용량을 50% 줄이는 것을 목표로 하며 바이오농약에 현저한 대체 효과를 가져왔습니다. 이와 함께 미국 환경보호청(EPA)은 2024년에 여러 유기인계 농약의 등록을 취소하고 조사 대상이 된 농작농가의 87%에서 바이오농약에 대한 관심을 높였습니다. 브라질에서는 바이오 농약의 승인 프로세스가 합리화되어 합성 농약에 비해 크게 시간을 단축. 이로 인해 바이오 농약 제조업체는 지연 비용의 우위를 얻었습니다. 태국을 비롯한 동남아시아 국가들도 비슷한 정책을 수립하고 있으며, 규제 강화의 움직임이 세계적으로 확산되고 있음을 보여줍니다. 주요 수출 작물에서 잔류 기준 준수는 현실적인 비즈니스 리스크가 되고 있으며, 구매자는 공급업체에게 합성 화학물질에 대한 의존도 저감을 강하게 요구하고 있습니다.
유기농지면적 확대
주요 생산지역의 연간 성장률 안정화를 배경으로 인증유기농지는 꾸준히 증가하고 있습니다. 유기인증은 합성자재의 사용을 금지하기 때문에 바이오농약이 이러한 시스템에서 주요 해충 관리 수단이 되어 바이오 농약 벤더에게 안정적인 수익 기반을 형성하고 있습니다. 유기 제품과 관련된 프리미엄 소매 가격으로 생산자는 헥타르 당 처리 비용 상승을 관리하면서 수익성을 유지할 수 있습니다. 유기 공급망 내에서의 제어환경농업(CEA)의 확대도 수요를 더욱 밀어 올리고 있습니다. 실내 농장에서는 잔류물 제로의 브랜드 요건을 충족시키기 위해, 처음부터 생물적 방제를 채용하고 있기 때문입니다. 또한 지역유기연구센터에 대한 투자는 생물학적 제품의 보급 지원을 강화하고 채용에 대한 신뢰를 높이고 있습니다.
합성 농약과의 비용 비교
바이오농약의 헥타르당 처리 비용은 기존 제품에 비해 여전히 2-3배 높고, 주요 요인은 유효성분 농도의 낮음과 살포 사이클의 빈도 증가에 있습니다. 아프리카와 아시아의 일부 지역에서 범용 작물 생산자는 프리미엄 수출 루트로 비용을 들여도 비싼 자재에 대한 투자를 망설이기 쉽습니다. 저항성 관리 및 잔류물 검사 비용 절감을 고려한 경제 모델에서는 가격 차이를 일부 상쇄할 수 있지만 이러한 분석은 보급 지원 네트워크를 통해 아직 널리 보급되지 않았습니다. 현재 일부 정부는 가격 차이를 채우기 위해 직접적인 투입 자재 보조를 제공하고 있지만, 프로그램의 범위는 여전히 제한적입니다.
부문 분석
바이오 농약 시장 규모에서 생물살균제는 2025년 수익의 46.92%를 차지했으며 계속해서 핵심을 이루고 있습니다. 이것은 곡물, 과수, 보호 재배 야채에 있어서 바실러스균이나 트리코데르마균주의 입증된 농장 성능을 반영한 것입니다. 수화제나 유분산제의 제제 기술 혁신에 의해 보존 안정성이 향상되어 온난 기후 지역에서의 보급을 지지하고 있습니다. 이 부문의 광범위한 유용성은 유통 업체의 신뢰를 구축하고 소매 채널에서 선반 할당 확대를 촉진합니다. 생물 살충제는 현재 점유율에서 후진을 숭배하지만, 11.86%의 연평균 복합 성장률(CAGR)로 성장하고 다른 카테고리를 초과할 것으로 예측됩니다. 생산자가 비늘눈 해충의 저항성에 대항하는 새로운 작용기전을 요구하는 가운데 채용이 진행되고 있습니다. 최근 규제 당국 신청 상황에서는 2024년 생물 살충제 신청 서류가 35% 증가했으며 예측 기간 동안 선택을 확대하는 파이프라인이 공급될 전망입니다.
2세대 바이오 제초제는 여전히 틈새 시장이지만, 기업이 신규 미생물 분리주와 숙주 특이성을 높이는 보조제를 조합함으로써 상업적 기세를 보이고 있습니다. 제작 면적의 제한으로 인해 생산량은 작지만 제초제 내성 잡초에 대한 차별화된 해결책을 제공하기 위해 벤처 캐피탈의 주목을 받고 있습니다. 기타 바이오농약(살선충제, 살패제 등)은 수량 유지를 위해 높은 투입비용이 정당화되는 고부가가치 특수작물을 대상으로 하고 있습니다. 이러한 다양한 형태가 결합되어 바이오 농약 시장의 기술적 범위의 확대를 보여줍니다.
본 「바이오 농약 시장 보고서」는 형태별(생물살균제, 생물제초제, 생물살충제 등), 작물 유형별(환금작물, 원예작물 등), 지역별(아프리카, 아시아태평양, 유럽, 중동, 북미 등)으로 분류되어 있습니다. 시장 예측은 금액(달러) 및 수량(메트릭톤)으로 제공됩니다.
지역별 분석
북미 지역은 2025년 매출의 39.12%를 유지했으며 12.05%라는 가장 빠른 지역별 연평균 성장률(CAGR)을 기록해, 바이오 농약 시장에서 최대 규모이자 가장 빠르게 성장하는 지역이라는 이중적 지위를 확고히 했습니다. 미국 환경보호청(EPA)의 심사 효율화, 주 수준의 장려 프로그램, 잔류물 제로 조달에 대한 소매업체의 강한 대처가 함께 도입이 가속되고 있습니다. 미국의 CEA(제어환경농업)사업에서는 잎채소, 토마토, 딸기의 생물적 해충구제가 통합되어 안정적인 수요기반을 제공합니다. 캐나다의 유기농지 확대와 멕시코의 수출지향형 원예가 지역에서의 이용을 더욱 확대하고 있습니다.
유럽은 유럽 연합의 '농장에서 식탁에 이르기까지'전략에 힘입어 계속됩니다. 유럽의 바이오 농약 시장은 현저하게 성장하고 작물 보호제 총 매출의 현저한 비율을 차지하고 있습니다. 엄격한 승인 프로세스는 수년이 걸리므로 제품 업데이트는 지연되지만 고품질 데이터 패키지를 확보하고 생산자의 신뢰를 강화하고 있습니다. 북부의 회원국에서는 곡물에 있어서 잔류 저감이 중시되는 한편, 지중해 지역에서는 원예·포도 재배로 생물적 방제제가 널리 활용되고 있습니다.
남미는 가장 역동적인 성장을 보이고 있으며, 브라질 시장의 확대와 생물자재 승인을 통일하는 유리한 규제개혁이 견인역입니다. 브라질 생산자의 대부분은 일상적인 생물자재 사용을 보고하게 되고, 연간 시장 확대율은 세계 평균을 크게 웃돌고 있습니다. 아르헨티나의 동등성 승인과 칠레의 공적 연구 자금이 지역 기세를 더욱 가속화하고 있습니다. 아시아태평양에서는 유기농지의 확대와 정부의 지속가능성 의무화에 연동된 강한 잠재력을 나타내고 있지만, 규제 타임라인의 편차와 기술 보급의 한계에 따라 진전은 단편적입니다. 중동 및 아프리카는 초기 단계 시장으로, 도너 자금에 의한 프로그램이나 다국적 기업에 의한 실증 사업이 장래 수요의 종을 뿌리고 있습니다.
기타 혜택 :
- 엑셀 형식 시장 예측(ME) 시트
- 애널리스트 지원(3개월간)
자주 묻는 질문
목차
제1장 서론
- 조사 전제조건 및 시장 정의
- 조사 범위
- 조사 방법
제2장 보고서 제공
제3장 주요 요약 및 주요 조사 결과
제4장 주요 업계 동향
- 유기 재배 면적
- 유기 제품에 대한 1인당 지출액
- 규제 프레임워크
- 아르헨티나
- 호주
- 브라질
- 캐나다
- 중국
- 이집트
- 프랑스
- 독일
- 인도
- 인도네시아
- 이란
- 이탈리아
- 일본
- 멕시코
- 네덜란드
- 나이지리아
- 필리핀
- 러시아
- 남아프리카
- 스페인
- 태국
- 튀르키예
- 영국
- 미국
- 베트남
- 밸류체인 및 유통채널 분석
- 시장 성장 촉진요인
- 합성농약에 대한 세계의 규제 강화
- 유기농업의 제작면적 확대
- 기존 화학농약에 대한 내성의 향상
- 정부에 의한 바이오농약의 장려책과 신속 승인 제도
- 제어환경농업(CEA)의 성장
- Fermentation-as-a-service에 의한 스케일 업 장벽의 저감
- 시장 성장 억제요인
- 합성농약에 비해 고비용
- 짧은 보존 기간과 높은 콜드체인 의존도
- 미생물 생산에 있어서 원료 가격의 변동성
- 통일된 농장 성능 KPI의 부족
제5장 시장 규모와 성장 예측(금액과 수량)
- 형태별
- 바이오 살균제
- 바이오 제초제
- 바이오 살충제
- 기타 바이오 농약
- 작물 유형별
- 환금 작물
- 원예 작물
- 밭 작물
- 지역별
- 아프리카
- 국가별
- 이집트
- 나이지리아
- 남아프리카
- 기타 아프리카
- 국가별
- 아시아태평양
- 국가별
- 호주
- 중국
- 인도
- 인도네시아
- 일본
- 필리핀
- 태국
- 베트남
- 기타 아시아태평양
- 국가별
- 유럽
- 국가별
- 프랑스
- 독일
- 이탈리아
- 네덜란드
- 러시아
- 스페인
- 튀르키예
- 영국
- 기타 유럽
- 국가별
- 중동
- 국가별
- 이란
- 사우디아라비아
- 기타 중동
- 국가별
- 북미
- 국가별
- 캐나다
- 멕시코
- 미국
- 기타 북미
- 국가별
- 남미
- 국가별
- 아르헨티나
- 브라질
- 기타 남미
- 국가별
- 아프리카
제6장 경쟁 구도
- 주요 전략적 움직임
- 시장 점유율 분석
- 기업 개요
- 기업 프로파일
- Bayer AG
- BASF SE
- Syngenta Group
- Corteva Agriscience
- FMC Corporation
- Valent BioSciences LLC(Sumitomo Chemical Co., Ltd.)
- Certis USA LLC(Mitsui and Co., Ltd.)
- Koppert BV
- Andermatt Group AG
- Marrone Bio Innovations Inc.(Bioceres Crop Solutions Corp.)
- Seipasa SA
- T.Stanes and Company Limited
- UPL Ltd.
- Atlantica Agricola
- Gujarat State Fertilizers and Chemicals Ltd.
제7장 CEO에 대한 주요 전략적 질문
KTH 26.01.20The biopesticides market size in 2026 is estimated at USD 7.43 billion, growing from 2025 value of USD 6.72 billion with 2031 projections showing USD 12.28 billion, growing at 10.58% CAGR over 2026-2031.

Heightened regulatory scrutiny of synthetic chemistries, rapid expansion of organic farmland, and the emergence of fermentation-as-a-service platforms are converging to accelerate the commercialization of microbial-based solutions. Brazil's unified bioinputs law, effective December 2024, has already shortened approval timelines for biological products, providing momentum that other emerging markets are beginning to emulate. At the same time, North American growers lead global adoption because of a mature controlled-environment agriculture infrastructure and streamlined reviews under the reformed United States Coordinated Framework. Intensifying insecticide resistance, especially in lepidopteran pests, is steering both row-crop and horticultural producers toward biological modes of action that complement existing chemistries.
Global Biopesticides Market Trends and Insights
Stricter Global Curbs on Synthetic Pesticides
The European Union's Farm to Fork Strategy targets a 50% cut in chemical pesticide use by 2030, prompting a measurable substitution effect in favor of biologicals. Complementing this, the United States Environmental Protection Agency (EPA) cancelled several organophosphate registrations in 2024, which has increased biological awareness among 87% of surveyed row-crop growers. Brazil's streamlined approval process now takes significantly less time for biologicals compared to synthetics, creating a cost-of-delay advantage for biopesticide manufacturers. Thailand and other Southeast Asian nations are drafting comparable policies, illustrating the global reach of regulatory momentum. Across major export crops, residue-limit compliance has become a tangible business risk, so buyers are pressuring suppliers to reduce dependence on synthetic chemistries.
Expansion of Organic Farming Acreage
Certified organic farmland has been steadily increasing, supported by consistent annual growth across major producing regions. Since organic certification prohibits synthetic inputs, biologicals serve as the primary pest-management option in these systems, creating a reliable revenue base for biopesticide vendors. The premium retail pricing associated with organic products allows growers to manage higher per-hectare treatment costs while maintaining profitability. The expansion of controlled-environment agriculture (CEA) within organic supply chains further drives demand, as indoor farms adopt biological controls from the outset to meet residue-free branding requirements. Additionally, investment in regional organic research centers is enhancing extension support for biological products, boosting adoption confidence.
Higher Cost Versus Synthetic Pesticides
Per-hectare treatment costs for biologicals remain two to three times higher than conventional products, primarily because of lower active-ingredient density and more frequent application cycles. Commodity crop growers in Africa and parts of Asia hesitate to invest in premium inputs, even though premium export channels may cover those costs. Economic modeling that factors in resistance management and residue-testing savings can partially offset price gaps, but such analyses are not yet widely distributed through extension networks. Several governments now offer direct input subsidies to bridge the pricing differential, but program scope is still limited.
Other drivers and restraints analyzed in the detailed report include:
- Rising Resistance to Conventional Chemistries
- Government Biopesticide Incentives and Fast-Track Approvals
- Shorter Shelf Life and Cold-Chain Dependence
For complete list of drivers and restraints, kindly check the Table Of Contents.
Segment Analysis
Biofungicides generated 46.92% of 2025 revenue and continue to anchor the biopesticides market size, reflecting proven field performance of Bacillus and Trichoderma strains across cereals, fruits, and protected vegetables. Innovation in wettable-powder and oil-dispersion formulations has improved shelf stability, which supports penetration in warmer climates. The segment's broad utility has built distributor confidence, encouraging wider shelf allocation in retail channels. Bioinsecticides trail in current share but are forecast to advance at a 11.86% CAGR, outpacing other categories. Adoption is rising as growers seek new modes of action to counter lepidopteran resistance. Recent regulatory submissions show a 35% rise in bioinsecticide dossiers in 2024, supplying a pipeline that will expand choices over the forecast window.
Second-generation bioherbicides remain niche but show commercial momentum as companies pair novel microbial isolates with adjuvants that improve host specificity. While limited acreage uptake keeps volume small, the category attracts venture capital because it offers a differentiated solution to herbicide-resistant weeds. Other biopesticides, including nematicides and molluscicides, target high-value specialty crops where yield preservation justifies higher inputs. Together, these diverse forms demonstrate the expanding technical scope of the biopesticides market.
The Biopesticides Market Report is Segmented by Form (Biofungicides, Bioherbicides, Bioinsecticides, and More), Crop Type (Cash Crops, Horticultural Crops, and More), and Geography (Africa, Asia-Pacific, Europe, Middle East, North America, and More). The Market Forecasts are Provided in Terms of Value (USD) and Volume (Metric Tons).
Geography Analysis
North America retained 39.12% revenue in 2025 and posted the fastest regional CAGR at 12.05%, underscoring its dual status as both the largest and fastest-growing territory for the biopesticides market. Streamlined EPA reviews, state-level incentive programs, and strong retailer commitments to residue-free sourcing combine to accelerate uptake. United States CEA operations integrate biological pest control in leafy greens, tomatoes, and strawberries, providing a steady baseline of demand. Canada's organic acreage expansion and Mexico's export-oriented horticulture further expand regional use.
Europe follows closely, propelled by the European Union's Farm to Fork Strategy. The European biocontrol market has grown significantly, representing a notable portion of total crop-protection sales. Stringent approval processes extend over several years, slowing product turnover but ensuring high-quality data packages that bolster grower trust. Northern member states emphasize residue reduction in cereals, while Mediterranean regions employ biologicals heavily in horticulture and viticulture.
South America delivers the most dynamic growth, led by Brazil's expanding market and favorable regulatory reforms that unify bioinput approvals. A significant portion of Brazilian growers now report routine biological use, and annual market expansion vastly outstrips the global average. Argentina's equivalency recognition and Chile's public research funding enhance regional momentum. Asia-Pacific registers strong potential tied to rising organic acreage and government sustainability mandates, yet progress is fragmented by variable regulatory timelines and limited technical extension. Africa and the Middle East represent early-stage markets where donor-funded programs and multinational demonstrations seed future demand.
- Bayer AG
- BASF SE
- Syngenta Group
- Corteva Agriscience
- FMC Corporation
- Valent BioSciences LLC (Sumitomo Chemical Co., Ltd.)
- Certis USA LLC (Mitsui and Co., Ltd.)
- Koppert B.V.
- Andermatt Group AG
- Marrone Bio Innovations Inc. (Bioceres Crop Solutions Corp.)
- Seipasa SA
- T.Stanes and Company Limited
- UPL Ltd.
- Atlantica Agricola
- Gujarat State Fertilizers and Chemicals Ltd.
Additional Benefits:
- The market estimate (ME) sheet in Excel format
- 3 months of analyst support
TABLE OF CONTENTS
1 INTRODUCTION
- 1.1 Study Assumptions & Market Definition
- 1.2 Scope of the Study
- 1.3 Research Methodology
2 REPORT OFFERS
3 EXECUTIVE SUMMARY AND KEY FINDINGS
4 KEY INDUSTRY TRENDS
- 4.1 Area Under Organic Cultivation
- 4.2 Per Capita Spending On Organic Products
- 4.3 Regulatory Framework
- 4.3.1 Argentina
- 4.3.2 Australia
- 4.3.3 Brazil
- 4.3.4 Canada
- 4.3.5 China
- 4.3.6 Egypt
- 4.3.7 France
- 4.3.8 Germany
- 4.3.9 India
- 4.3.10 Indonesia
- 4.3.11 Iran
- 4.3.12 Italy
- 4.3.13 Japan
- 4.3.14 Mexico
- 4.3.15 Netherlands
- 4.3.16 Nigeria
- 4.3.17 Philippines
- 4.3.18 Russia
- 4.3.19 South Africa
- 4.3.20 Spain
- 4.3.21 Thailand
- 4.3.22 Turkey
- 4.3.23 United Kingdom
- 4.3.24 United States
- 4.3.25 Vietnam
- 4.4 Value Chain and Distribution Channel Analysis
- 4.5 Market Drivers
- 4.5.1 Stricter global curbs on synthetic pesticides
- 4.5.2 Expansion of organic farming acreage
- 4.5.3 Rising resistance to conventional chemistries
- 4.5.4 Government bio-pesticide incentives and fast-track approvals
- 4.5.5 Growth of controlled-environment agriculture (CEA)
- 4.5.6 Fermentation-as-a-service lowering scale-up barriers
- 4.6 Market Restraints
- 4.6.1 Higher cost versus synthetic pesticides
- 4.6.2 Shorter shelf life and cold-chain dependence
- 4.6.3 Feed-stock price volatility for microbial production
- 4.6.4 Absence of uniform field-performance KPIs
5 MARKET SIZE AND GROWTH FORECASTS (VALUE AND VOLUME)
- 5.1 Form
- 5.1.1 Biofungicides
- 5.1.2 Bioherbicides
- 5.1.3 Bioinsecticides
- 5.1.4 Other Biopesticides
- 5.2 Crop Type
- 5.2.1 Cash Crops
- 5.2.2 Horticultural Crops
- 5.2.3 Row Crops
- 5.3 Geography
- 5.3.1 Africa
- 5.3.1.1 By Country
- 5.3.1.1.1 Egypt
- 5.3.1.1.2 Nigeria
- 5.3.1.1.3 South Africa
- 5.3.1.1.4 Rest of Africa
- 5.3.1.1 By Country
- 5.3.2 Asia-Pacific
- 5.3.2.1 By Country
- 5.3.2.1.1 Australia
- 5.3.2.1.2 China
- 5.3.2.1.3 India
- 5.3.2.1.4 Indonesia
- 5.3.2.1.5 Japan
- 5.3.2.1.6 Philippines
- 5.3.2.1.7 Thailand
- 5.3.2.1.8 Vietnam
- 5.3.2.1.9 Rest of Asia-Pacific
- 5.3.2.1 By Country
- 5.3.3 Europe
- 5.3.3.1 By Country
- 5.3.3.1.1 France
- 5.3.3.1.2 Germany
- 5.3.3.1.3 Italy
- 5.3.3.1.4 Netherlands
- 5.3.3.1.5 Russia
- 5.3.3.1.6 Spain
- 5.3.3.1.7 Turkey
- 5.3.3.1.8 United Kingdom
- 5.3.3.1.9 Rest of Europe
- 5.3.3.1 By Country
- 5.3.4 Middle East
- 5.3.4.1 By Country
- 5.3.4.1.1 Iran
- 5.3.4.1.2 Saudi Arabia
- 5.3.4.1.3 Rest of Middle East
- 5.3.4.1 By Country
- 5.3.5 North America
- 5.3.5.1 By Country
- 5.3.5.1.1 Canada
- 5.3.5.1.2 Mexico
- 5.3.5.1.3 United States
- 5.3.5.1.4 Rest of North America
- 5.3.5.1 By Country
- 5.3.6 South America
- 5.3.6.1 By Country
- 5.3.6.1.1 Argentina
- 5.3.6.1.2 Brazil
- 5.3.6.1.3 Rest of South America
- 5.3.6.1 By Country
- 5.3.1 Africa
6 COMPETITIVE LANDSCAPE
- 6.1 Key Strategic Moves
- 6.2 Market Share Analysis
- 6.3 Company Landscape
- 6.4 Company Profiles (Includes Global-Level Overview, Market-Level Overview, Core Segments, Financials, Strategic Information, Market Rank/Share, Products and Services, and Recent Developments)
- 6.4.1 Bayer AG
- 6.4.2 BASF SE
- 6.4.3 Syngenta Group
- 6.4.4 Corteva Agriscience
- 6.4.5 FMC Corporation
- 6.4.6 Valent BioSciences LLC (Sumitomo Chemical Co., Ltd.)
- 6.4.7 Certis USA LLC (Mitsui and Co., Ltd.)
- 6.4.8 Koppert B.V.
- 6.4.9 Andermatt Group AG
- 6.4.10 Marrone Bio Innovations Inc. (Bioceres Crop Solutions Corp.)
- 6.4.11 Seipasa SA
- 6.4.12 T.Stanes and Company Limited
- 6.4.13 UPL Ltd.
- 6.4.14 Atlantica Agricola
- 6.4.15 Gujarat State Fertilizers and Chemicals Ltd.
