|
시장보고서
상품코드
1906992
폴리이미드(PI) : 시장 점유율 분석, 업계 동향과 통계, 성장 예측(2026-2031년)Polyimides (PI) - Market Share Analysis, Industry Trends & Statistics, Growth Forecasts (2026 - 2031) |
||||||
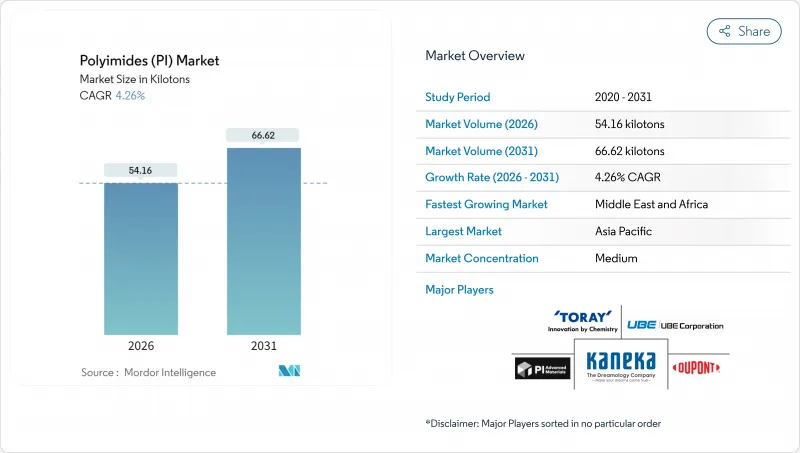
폴리이미드(PI) 시장은 2025년 51.95킬로톤에서 2026년에는 54.16킬로톤으로 성장할 것으로 보입니다. 2026-2031년에 걸쳐 CAGR 4.26%를 나타낼 것으로 예상되며, 2031년까지 66.62킬로톤에 이를 것으로 예측되고 있습니다.

고성능 응용 분야의 지속적인 수요가 이러한 성장세를 뒷받침하고 있습니다. 첨단 반도체 패키징, 특히 고대역폭 메모리 스택(HBMS) 및 이종 통합 기술은 폴리이미드 필름을 층간 절연체 및 응력 완충재 설계의 핵심 소재로 자리매김하게 합니다. 전기차 파워트레인의 전동화는 800V 시스템이 절연 안정성을 위해 폴리이미드 절연체를 선호함에 따라 고객 기반을 확대하고 있습니다. 5G 및 초기 6G 인프라의 채택이 가속화되고 있는데, 이는 저손실 탄젠트 값이 밀리미터파 주파수에서 신호 무결성을 유지하기 때문입니다. 우주 분야의 상용화는 또 다른 성장 동력을 추가하고 있는데, 경량 열 차폐재가 극한 온도의 내구성을 위해 폴리이미드를 지정하기 때문입니다. 글로벌 폴리이미드(PI) 시장 동향 및 인사이트
세계의 폴리이미드(PI) 시장 동향 및 인사이트
전자기기의 소형화와 폴더블 디스플레이의 급성장
더 얇고 가벼운 휴대용 기기에 대한 수요로 인해 폴리이미드 기판은 차세대 플렉서블 회로 및 폴더블 디스플레이에 필수 불가결한 소재가 되었다. 삼성 테스트 결과, 필름은 1.4mm 반경에서 20만 회 이상 접힘에도 광학 왜곡 없이 견뎌냈다. 자동차 콕핏은 -40°C에서 150°C 사이에서 안전하게 작동하는 곡면 OLED 패널을 채택하고 있으며, 이 역시 폴리이미드의 유연성에 의존합니다. 칩릿 기반 반도체 패키지도 마찬가지로 이 소재의 낮은 열팽창 계수가 취성 절연체를 균열시킬 수 있는 기계적 응력을 흡수하기 때문에 이점을 얻습니다. 폼 팩터 혁신이 지속됨에 따라, 열적 또는 치수 안정성을 타협할 수 없는 설계자들로부터 폴리이미드 시장은 탄력적인 수요를 얻고 있습니다.
EV 고전압 절연재 수요 급증
전기차 플랫폼은 이제 800V 이상에서 작동하여 기존 절연 재료를 안전 한계 이상으로 밀어붙입니다. 폴리이미드 필름은 250kV/mm 이상의 절연 강도를 제공하며, -40°C에서 200°C 사이의 1,000회 열 사이클 후에도 그 무결성을 유지합니다. 테슬라는 구동 모터의 부분 방전 고장을 완화하기 위해 폴리이미드로 감싼 구리 권선을 통합합니다. 실리콘보다 고온에서 작동하는 실리콘 카바이드 인버터로의 전환은 고온 폴리머 패키징의 필요성을 더욱 공고히 합니다. 배터리 용량이 확대됨에 따라 열폭주 억제 시스템도 폴리이미드 장벽을 지정하여 폴리이미드 시장의 장기 성장 전망을 높입니다.
용제 주조 VOC 배출 규제 대응 비용
유럽의 산업 배출 지침 기준과 캘리포니아 SCAQMD 규정은 휘발성 유기 화합물(VOC) 배출을 20 mg/m³로 제한합니다. 따라서 N-메틸-2-피롤리돈을 사용하는 용제 주조 폴리이미드 생산라인은 라인당 수백만 달러가 소요되는 재생식 열산화장치(RTO)를 설치해야 합니다. 회수 기간이 5년을 초과함에 따라 수성 이미드 화학 물질로의 전환이 촉진되고 있습니다. 그러나 생산 수율이 여전히 낮아 환경적 시급성에도 불구하고 신속한 채택이 제한되고 있습니다.
부문 분석
전기 및 전자 용도는 2025년 폴리이미드 시장 점유율의 36.42%를 차지하며, 이 소재가 유연 인쇄 회로 기판 및 반도체 패키징 분야에서 역사적으로 수행해 온 역할을 부각시켰습니다. 칩릿 아키텍처가 박막에 의존하는 상호 연결 레이어를 증대시키면서 해당 분야의 매출은 지속적으로 확대될 전망입니다. 자동차 분야가 그 뒤를 이으며, 전기차 모터 절연 및 배터리 열 차단재 수요가 견인하고 있습니다. 산업 기계는 고온 씰의 내화학성을 중시하는 반면, 항공우주 분야는 방사선 저항성 라미네이트에 의존합니다.
기타 최종 사용자 산업은 규모는 작지만 성장 속도가 더 빠른 부분을 차지하며, 5.18%의 연평균 복합 성장률(CAGR)을 기록해 2031년까지 폴리이미드 시장 규모 기여도를 15.6킬로톤 이상으로 끌어올릴 전망입니다. 난연성 외장 시스템을 규정하는 건축 규정과 멸균 내성 폴리머를 채택하는 의료기기 제조업체는 두 가지 주목할 만한 신흥 분야입니다. 이러한 응용 분야가 성숙해짐에 따라 소비자 전자제품에 대한 의존도는 희석되어 폴리이미드 시장 전반의 주기적 위험을 낮출 것입니다.
폴리이미드 시장 보고서는 최종 사용자 산업별(자동차, 전기 및 전자, 포장, 산업, 기계, 항공우주, 건축 및 건설, 기타), 형태별(필름, 수지, 섬유, 기타), 지역별(아시아태평양, 북미, 유럽, 남미, 중동 및 아프리카)으로 분류되고 있습니다. 시장 예측은 수량(톤) 및 금액(달러)으로 제공됩니다.
지역별 분석
아시아태평양 지역은 2025년 글로벌 수요의 40.55%를 차지하며, 여전히 플렉서블 PCB 제조 및 폴더블 디스플레이 조립의 중심지입니다. 중국은 규모를 제공하며, 일본은 반도체 백엔드 패키징 업체에 공급되는 초저결함 화학 기술을 완성하고 있습니다. 한국의 디스플레이 대기업들은 대규모 자체 소비를 유지하고 있습니다. 말레이시아 등 동남아시아 국가들은 다국적 전자 그룹의 이전 투자를 흡수하며 폴리이미드 시장을 뒷받침하는 지역 클러스터를 강화하고 있습니다.
북미는 꾸준하지만 눈에 띄지 않는 물량 성장을 보입니다. 이 지역은 항공우주 및 방위 프로젝트에서 탁월하며, 일반 제품 가격의 3배에 달하는 비행 인증 필름이 흔합니다. 고속 네트워크 구축은 현지 라미네이트 수요를 자극하고 있습니다. 국내 반도체 팹에 대한 연방 인센티브는 수지 추가 수요를 촉진할 것으로 예상되나, 특수 폴리머 가공 분야의 인력 부족으로 급속한 확장은 제한될 전망입니다.
유럽의 전망은 북미와 유사하다. 자동차 전기화와 해상 풍력 터빈 인버터에 폴리이미드 절연체가 채택되고 있으나, 에너지 가격과 엄격한 VOC 규제로 전환 비용이 상승 중입니다. 정책 입안자들은 신규 설비에 보조금을 지급할 수 있는 공급망 자율화 조치를 검토 중이지만, 단기적으로는 수입 의존도가 지속될 전망입니다.
중동 및 아프리카 지역은 현재 절대 톤수 기준 규모는 작으나, 걸프 국가들의 첨단 제조업 다각화로 연평균 6.05% 성장률을 기록 중입니다. 대규모 데이터센터와 5G 구축은 폴리이미드 코어를 선호하는 고주파 PCB 수요를 창출하며, 인프라 현대화로 케이블 제조사들은 고온 절연재 사용을 확대하고 있습니다. 투자 체계는 아직 초기 단계라 대부분의 소재가 수입되지만, 아시아 화학 그룹과의 합작 투자 논의가 진행 중입니다. 예측 기간 동안 폴리이미드 시장은 지역 수요를 충족하기 위한 파일럿 라인이 구축될 전망입니다.
기타 혜택 :
- 엑셀 형식 시장 예측(ME) 시트
- 3개월간의 애널리스트 지원
자주 묻는 질문
목차
제1장 서론
- 조사의 전제조건과 시장 정의
- 조사 범위
제2장 조사 방법
제3장 주요 요약
제4장 시장 상황
- 시장 개요
- 시장 성장 촉진요인
- 전자 기기의 소형화와 폴더블 디스플레이 붐
- 전기자동차용 고전압 절연재 수요 급증
- 5G/6G 고주파 프린트 기판의 채택
- 우주 산업 경량 열 차폐재 확대
- 중국 주도 생산 능력 증대로 인한 가격 장벽 완화
- 시장 성장 억제요인
- 변동성 있는 디안하이드라이드 및 디아민 원료 가격
- 용제 주입 공정의 VOC 배출 규제 준수 비용
- 동아시아 외 지역의 가공 기술 격차
- 밸류체인 분석
- Porter's Five Forces
- 신규 참가업체의 위협
- 공급기업의 협상력
- 구매자의 협상력
- 대체품의 위협
- 경쟁 기업간 경쟁 관계
- 규제 프레임워크
- 아르헨티나
- 호주
- 브라질
- 캐나다
- 중국
- EU
- 인도
- 일본
- 말레이시아
- 멕시코
- 나이지리아
- 러시아
- 사우디아라비아
- 남아프리카
- 한국
- 아랍에미리트(UAE)
- 영국
- 미국
- 최종 용도 부문 동향
- 항공우주(항공우주부품 생산수익)
- 자동차(자동차 생산)
- 건축 및 건설(신축 건축)
- 전기 및 전자 기기(전기 및 전자 기기 생산 수익)
- 포장(플라스틱 포장 수량)
제5장 시장 규모와 성장 예측(금액 및 수량)
- 최종 사용자 산업별
- 자동차
- 전기 및 전자
- 포장
- 산업, 기계
- 항공우주
- 건축 및 건설
- 기타 최종 사용자 산업
- 형태별
- 필름
- 수지
- 섬유
- 기타
- 지역별
- 아시아태평양
- 중국
- 일본
- 인도
- 한국
- 호주
- 말레이시아
- 기타 아시아태평양
- 북미
- 미국
- 캐나다
- 멕시코
- 유럽
- 독일
- 프랑스
- 이탈리아
- 영국
- 러시아
- 기타 유럽
- 남미
- 브라질
- 아르헨티나
- 기타 남미
- 중동 및 아프리카
- 사우디아라비아
- 아랍에미리트(UAE)
- 나이지리아
- 남아프리카
- 기타 중동 및 아프리카
- 아시아태평양
제6장 경쟁 구도
- 시장 집중도
- 전략적 동향
- 시장 점유율(%)/순위 분석
- 기업 프로파일
- Arakawa Chemical Industries,Ltd.
- Arkema
- China Wanda Group
- DUNMORE
- DuPont
- JIAOZUO TIANYI TECHNOLOGY CO.,LTD
- Kaneka Corporation
- Kolon Industries Inc.
- Mitsui Chemicals Inc.
- PI Advanced Materials Co., Ltd.
- Shenzhen Ruihuatai Film Technology Co., Ltd.
- SKC
- Taimide Tech. Inc.
- Toray Industries Inc
- UBE Corporation
제7장 시장 기회와 장래의 전망
제8장 CEO를 위한 주요 전략적 과제
HBR 26.02.04The Polyimides market is expected to grow from 51.95 kilotons in 2025 to 54.16 kilotons in 2026 and is forecast to reach 66.62 kilotons by 2031 at 4.26% CAGR over 2026-2031.

Persistent demand from high-performance applications underpins this trajectory. Advanced semiconductor packaging, notably high-bandwidth memory stacks and heterogeneous integration, keeps polyimide films at the center of interlayer dielectric and stress-buffer designs. Electric-vehicle power-train electrification is widening the customer base as 800 V systems favor polyimide dielectrics for insulation stability. Adoption in 5G and early 6G infrastructure is accelerating because low-loss tangent values preserve signal integrity at millimeter-wave frequencies. Space-sector commercialization adds another growth vector as lightweight thermal blankets specify polyimides for durability under extreme temperatures.
Global Polyimides (PI) Market Trends and Insights
Electronics Miniaturization and Foldable-Display Boom
Demand for thinner, lighter portable devices has made polyimide substrates indispensable for next-generation flexible circuits and foldable displays. Samsung testing shows films survive more than 200,000 folds at radii down to 1.4 mm without optical distortion. Automotive cockpits are adopting curved OLED panels that operate safely between -40 °C and 150 °C, again relying on polyimide flexibility. Chiplet-based semiconductor packages likewise benefit because the material's low coefficient of thermal expansion absorbs mechanical stresses that would crack brittle dielectrics. As form-factor innovation continues, the polyimides market gains resilient demand from designers that cannot compromise on thermal or dimensional stability.
EV High-Voltage Insulation Demand Surge
Electric-vehicle platforms now operate above 800 V, pushing traditional insulation materials beyond safe limits. Polyimide films provide dielectric strengths exceeding 250 kV mm-1 and retain that integrity after 1,000 thermal cycles between -40 °C and 200 °C. Tesla integrates polyimide-wrapped copper windings to mitigate partial-discharge failures in traction motors. The shift to silicon-carbide inverters, which run hotter than silicon, further entrenches the need for high-temperature polymer packaging. As battery capacities scale, thermal runaway containment systems also specify polyimide barriers, enhancing long-term growth prospects for the polyimides market.
VOC-Emission Compliance Costs for Solvent Casting
Industrial Emissions Directive thresholds in Europe and SCAQMD rules in California cap volatile organic compound emissions at 20 mg m-3. Solvent-cast polyimide lines using N-methyl-2-pyrrolidone must therefore install regenerative thermal oxidizers costing several million dollars per line. Payback stretches beyond five years, prompting a shift toward water-based imide chemistries. However, production yields remain lower, restraining rapid adoption despite environmental urgency.
Other drivers and restraints analyzed in the detailed report include:
- 5G/6G High-Frequency PCB Adoption
- Space-Sector Lightweight Thermal Shielding Expansion
- Processing Skill Gap Outside East Asia
For complete list of drivers and restraints, kindly check the Table Of Contents.
Segment Analysis
Electrical and electronics applications commanded 36.42% of the polyimides market share in 2025, underscoring the material's historical role in flexible printed circuits and semiconductor packaging. Revenues here will keep expanding as chiplet architectures multiply interconnect layers that rely on thin films. Automotive follows, propelled by electric-vehicle motor insulation and battery thermal barriers. Industrial machinery values chemical resistance in high-temperature seals, while aerospace relies on radiation-resistant laminates.
Other end-user industries accounted for a smaller but faster-growing slice, posting a 5.18% CAGR that will push their contribution to the polyimides market size above 15.6 kilotons by 2031. Building-construction codes specifying flame-retardant facade systems and medical-device makers adopting sterilization-resistant polymers are two visible frontiers. As these applications mature, dependency on consumer electronics will dilute, lowering cyclical risk for the wider polyimides market.
The Polyimides Report is Segmented by End User Industry (Automotive, Electrical and Electronics, Packaging, Industrial and Machinery, Aerospace, Building and Construction, and Other End-User Industries), Form (Film, Resin, Fiber, and Others), and Geography (Asia-Pacific, North America, Europe, South America, and Middle-East and Africa). The Market Forecasts are Provided in Terms of Volume (Tons) and Value (USD).
Geography Analysis
Asia-Pacific anchored 40.55% of global demand in 2025 and remains the epicenter of flexible-PCB fabrication and foldable-display assembly. China contributes scale, while Japan perfects ultra-low-defect chemistries that feed semiconductor back-end packaging houses. South Korea's display giants sustain large captive consumption. Southeast Asian nations such as Malaysia are absorbing relocation investment from multinational electronics groups, strengthening the regional cluster that underwrites the polyimides market.
North America shows steady but less spectacular volume growth. The region excels in aerospace and defense projects, where flight-qualified films priced at triple commodity levels are commonplace. High-speed network deployments are stimulating local laminate demand. Federal incentives for domestic semiconductor fabs should spur incremental resin off-take, yet talent shortages in specialty polymer processing temper rapid expansion.
Europe's outlook mirrors that of North America. Automotive electrification and offshore wind-turbine inverters adopt polyimide insulation, yet energy prices and stringent VOC rules raise conversion costs. Policymakers are weighing supply-chain autonomy measures that could subsidize new capacity, but near-term reliance on imports persists.
The Middle East and Africa, presently small in absolute tonnage, advances at a 6.05% CAGR as Gulf states diversify into high-tech manufacturing. Large-scale data centers and 5G rollouts demand high-frequency PCBs that favor polyimide cores, and infrastructure modernization pushes cable manufacturers to specify higher-temperature insulations. Investment frameworks remain nascent, so most material is imported, though joint ventures with Asian chemical groups are under negotiation. Over the forecast horizon, the polyimides market may see pilot lines established to tap regional demand.
- Arakawa Chemical Industries,Ltd.
- Arkema
- China Wanda Group
- DUNMORE
- DuPont
- JIAOZUO TIANYI TECHNOLOGY CO.,LTD
- Kaneka Corporation
- Kolon Industries Inc.
- Mitsui Chemicals Inc.
- PI Advanced Materials Co., Ltd.
- Shenzhen Ruihuatai Film Technology Co., Ltd.
- SKC
- Taimide Tech. Inc.
- Toray Industries Inc
- UBE Corporation
Additional Benefits:
- The market estimate (ME) sheet in Excel format
- 3 months of analyst support
TABLE OF CONTENTS
1 Introduction
- 1.1 Study Assumptions and Market Definition
- 1.2 Scope of the Study
2 Research Methodology
3 Executive Summary
4 Market Landscape
- 4.1 Market Overview
- 4.2 Market Drivers
- 4.2.1 Electronics miniaturisation and foldable-display boom
- 4.2.2 EV high-voltage insulation demand surge
- 4.2.3 5 G/6 G high-frequency PCB adoption
- 4.2.4 Space-sector lightweight thermal shielding expansion
- 4.2.5 China-led capacity additions lowering price barriers
- 4.3 Market Restraints
- 4.3.1 Volatile dianhydride and diamine feedstock pricing
- 4.3.2 VOC-emission compliance costs for solvent casting
- 4.3.3 Processing skill gap outside East Asia
- 4.4 Value Chain Analysis
- 4.5 Porter's Five Forces
- 4.5.1 Threat of New Entrants
- 4.5.2 Bargaining Power of Suppliers
- 4.5.3 Bargaining Power of Buyers
- 4.5.4 Threat of Substitutes
- 4.5.5 Competitive Rivalry
- 4.6 Regulatory Framework
- 4.6.1 Argentina
- 4.6.2 Australia
- 4.6.3 Brazil
- 4.6.4 Canada
- 4.6.5 China
- 4.6.6 European Union
- 4.6.7 India
- 4.6.8 Japan
- 4.6.9 Malaysia
- 4.6.10 Mexico
- 4.6.11 Nigeria
- 4.6.12 Russia
- 4.6.13 Saudi Arabia
- 4.6.14 South Africa
- 4.6.15 South Korea
- 4.6.16 United Arab Emirates
- 4.6.17 United Kingdom
- 4.6.18 United States
- 4.7 End-use Sector Trends
- 4.7.1 Aerospace (Aerospace Component Production Revenue)
- 4.7.2 Automotive (Automobile Production)
- 4.7.3 Building and Construction (New Construction Floor Area)
- 4.7.4 Electrical and Electronics (Electrical and Electronics Production Revenue)
- 4.7.5 Packaging(Plastic Packaging Volume)
5 Market Size and Growth Forecasts (Value and Volume)
- 5.1 By End User Industry
- 5.1.1 Automotive
- 5.1.2 Electrical and Electronics
- 5.1.3 Packaging
- 5.1.4 Industrial and Machinery
- 5.1.5 Aerospace
- 5.1.6 Building and Construction
- 5.1.7 Other End-user Industries
- 5.2 By Form
- 5.2.1 Film
- 5.2.2 Resin
- 5.2.3 Fiber
- 5.2.4 Others
- 5.3 By Geography
- 5.3.1 Asia-Pacific
- 5.3.1.1 China
- 5.3.1.2 Japan
- 5.3.1.3 India
- 5.3.1.4 South Korea
- 5.3.1.5 Australia
- 5.3.1.6 Malaysia
- 5.3.1.7 Rest of Asia-Pacific
- 5.3.2 North America
- 5.3.2.1 United States
- 5.3.2.2 Canada
- 5.3.2.3 Mexico
- 5.3.3 Europe
- 5.3.3.1 Germany
- 5.3.3.2 France
- 5.3.3.3 Italy
- 5.3.3.4 United Kingdom
- 5.3.3.5 Russia
- 5.3.3.6 Rest of Europe
- 5.3.4 South America
- 5.3.4.1 Brazil
- 5.3.4.2 Argentina
- 5.3.4.3 Rest of South America
- 5.3.5 Middle-East and Africa
- 5.3.5.1 Saudi Arabia
- 5.3.5.2 United Arab Emirates
- 5.3.5.3 Nigeria
- 5.3.5.4 South Africa
- 5.3.5.5 Rest of Middle-East and Africa
- 5.3.1 Asia-Pacific
6 Competitive Landscape
- 6.1 Market Concentration
- 6.2 Strategic Moves
- 6.3 Market Share (%)/Ranking Analysis
- 6.4 Company Profiles (includes Global level Overview, Market level overview, Core Segments, Financials as available, Strategic Information, Market Rank/Share for key companies, Products and Services, and Recent Developments)
- 6.4.1 Arakawa Chemical Industries,Ltd.
- 6.4.2 Arkema
- 6.4.3 China Wanda Group
- 6.4.4 DUNMORE
- 6.4.5 DuPont
- 6.4.6 JIAOZUO TIANYI TECHNOLOGY CO.,LTD
- 6.4.7 Kaneka Corporation
- 6.4.8 Kolon Industries Inc.
- 6.4.9 Mitsui Chemicals Inc.
- 6.4.10 PI Advanced Materials Co., Ltd.
- 6.4.11 Shenzhen Ruihuatai Film Technology Co., Ltd.
- 6.4.12 SKC
- 6.4.13 Taimide Tech. Inc.
- 6.4.14 Toray Industries Inc
- 6.4.15 UBE Corporation
7 Market Opportunities and Future Outlook
- 7.1 White-space and Unmet-Need Assessment


