
|
시장보고서
상품코드
1850372
합성 개구 레이더 : 시장 점유율 분석, 산업 동향, 통계, 성장 예측(2025-2030년)Synthetic Aperture Radar - Market Share Analysis, Industry Trends & Statistics, Growth Forecasts (2025 - 2030) |
||||||
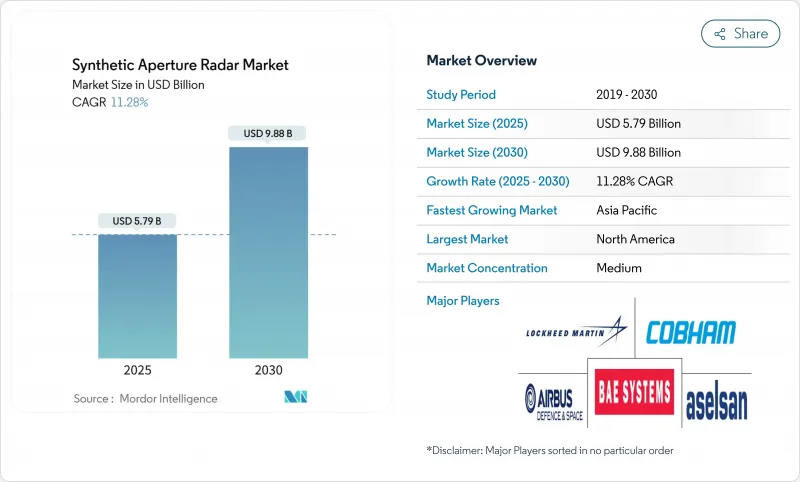
합성 개구 레이더 시장 규모는 2025년에 57억 9,000만 달러로 평가되었고 2030년에 98억 8,000만 달러에 이를 것으로 예측되며, CAGR은 11.28%를 보일 것으로 예측되고 있습니다.

상업적 수요가 증가하고 있으며, 해상 안전, 정밀 농업, 재난 대응을 위해 전천후 영상 촬영이 필수 요소가 되고 있습니다. 인공지능은 원시 레이더 데이터를 실시간 의사 결정 지원으로 전환하고 있으며, 500kg 미만의 소형 위성 군집은 재방문 주기를 30분 미만으로 단축하고 배치 비용을 절감합니다. Ka-대역으로의 주파수 다각화는 X-대역 스펙트럼 혼잡을 완화하고 대용량 데이터 다운링크를 가속화하며, 소프트웨어 정의 페이로드는 운영자가 궤도상에서 영상 모드를 전환할 수 있게 합니다.
세계의 합성 개구 레이더 시장 동향 및 인사이트
방위 분야 모니터링 예산 증가
군사비 지출 증가는 지속적이고 고해상도 커버리지에 대한 수요를 견인합니다. 미국 우주군은 2024 회계연도 우주 조달 예산으로 47억 달러를 배정하여 레이더 기반 대우주 자산에 자금을 투입했습니다. 중국의 방공 레이더 기지는 2022년까지 60억 달러 규모로 확장되어 다영역 작전을 위한 전략적 깊이를 확보했습니다. 폴란드의 ICEYE와의 2억 유로(2억 1,600만 달러) 규모 다년 계약 등 유럽 프로그램은 꾸준한 조달 파이프라인을 확인시켜 줍니다. 이러한 지출은 종합적으로 플랫폼 제조사와 분석 서비스 제공업체에 기본 물량을 보장합니다.
소형 위성 SAR 군집의 보급
500kg 미만의 분산형 군집은 제조 주기를 단축하고 발사 비용을 대폭 절감하여 30분 재방문 주기를 경제적으로 실현 가능하게 합니다. 아이세이의 40개 위성 군집은 단일 위성에서 확장 가능한 클러스터로의 전환을 보여줍니다. 총 임무 비용은 기존 위성의 1억 달러에서 뉴스페이스 단위의 1,500만 달러 미만으로 하락하며 상업적 진입을 촉진했습니다. 일본의 신스펙티브는 2025-2027년 로켓랩과의 10회 발사 계약을 체결하며 신속한 배치에 대한 투자자 신뢰를 입증했습니다.
높은 SAR 개발 및 발사 비용
재사용 발사체를 사용하더라도 정밀 레이더 페이로드에 대한 자본 요구는 여전히 높습니다. 방사선 내성 부품, 열 제어, 위상 배열 안테나가 비용을 상승시켜 항공우주 분야 경험이 부족한 신규 진입자를 제한합니다. 수출 통제 승인 및 국경 간 주파수 신고는 프로젝트 일정을 연장시켜 현금 흐름 유연성을 저해합니다.
부문 분석
항공 자산은 방위 기관이 유연한 비행 프로필과 실시간 유인 해석에 의존하기 때문에 54%의 합성 개구 레이더 시장 점유율 중 가장 높은 비중을 차지합니다. 서비스 제공업체는 제한 구역 상공의 긴급 임무를 위해 유인 항공기와 무인 항공기를 결합합니다.
그러나 우주 기반 시스템은 소수의 다톤급 자산에서 확산된 클러스터로 전환되어 중장비 인프라 없이도 더 빠른 커버리지를 가능하게 합니다. 우주 기반 시스템은 13.3%의 연평균 복합 성장률(CAGR)을 기록하며, 향후 합성개구레이더 시장 규모에 가장 두드러진 기여를 할 것으로 예상됩니다. ICEYE의 1,200MHz 대역폭을 가진 4세대 장치는 25cm 해상도를 달성하여, 훨씬 저렴한 비용으로 대형 항공기와 동등한 성능을 제공합니다. 또한 다수의 저비용 우주선에 위험을 분산함으로써 궤도 잔해 및 위성 파괴 위협에 대한 군집의 복원력을 향상시킵니다.
X-밴드는 41%의 매출 점유율을 유지하며, 다양한 기상 조건에서 정밀 측량을 위해 군에서 선호합니다. 확립된 공급망은 페이로드 조달을 간소화하여 기존 업체의 입지를 강화합니다. C-밴드는 센티넬-1 함대를 통한 농업 및 기후 모니터링 분야에서 여전히 핵심적입니다.
Ka-밴드의 13.6% CAGR은 일일 26Tb 데이터 전송 능력으로 실시간 분석을 지원해 합성개구레이더 시장을 확장함을 반영합니다. 고주파는 스펙트럼 혼잡을 줄이지만 고급 열 설계와 가변형 안테나가 필수입니다. 신흥 Ku-밴드 플랫폼은 상업용 이미징을 위한 중간 비용의 고처리량 링크를 약속합니다.
합성 개구 레이더 시장은 플랫폼별(항공 SAR, 우주 SAR, 지상 SAR 등), 주파수 대역별(X-밴드, L-밴드, C-밴드 등), 컴포넌트별(안테나, 송신기, 수신기 등), 모드별(스트립 맵, 스포트라이트 등), 용도별(군 및 방위, 석유 및 가스 등), 지역별로 분류되어 있습니다. 시장 예측은 금액(달러)으로 제공됩니다.
지역별 분석
북미는 NASA 기술 예산과 방위 조달 확대에 힘입어 2024년 합성개구레이더 시장에서 35%의 매출 점유율로 선두를 차지했습니다. 2026 회계연도 요청안은 NISAR 임무에 7,210만 달러를 배정하여 페이로드 통합업체 및 분석 기업에 대한 국내 수요를 보장합니다. Capella Space 및 Umbra Space와 같은 상업적 공급업체는 강력한 벤처 캐피털 생태계의 혜택을 받는 반면, 캐나다는 북극 및 자원 모니터링를 위해 RADARSAT 파생 제품을 활용합니다.
아시아태평양 지역은 12.4%의 가장 빠른 연평균 성장률(CAGR)을 보이며, 중국의 260억 위안 규모 주문량에 힘입어 2030년까지 북미 지역 규모를 추월할 전망입니다. 베이징 소재 위나스타(Weina Star)의 80억 4천만 위안 규모 위성군 계약은 SAR 제조의 장기적 산업화를 시사합니다. 일본의 신스펙티브(Synspective)는 시리즈 C 투자로 70억 엔(4,700만 달러)을 조달하고 미쓰비시전기, 토요다고세이, IHI와 협력해 페이로드 공동 개발에 나서 현지 공급망을 강화했습니다. 인도의 국내 전자제품 생산액은 95조 2천억 루피(1,150억 달러)에 달해 자국산 부품 조달 기반을 마련했습니다. 한국의 ASIC 로드맵은 수출 계약 확보를 위해 방사선 내성 칩셋을 목표로 합니다.
유럽은 코페르니쿠스 프로그램과 방위 협력을 통해 꾸준한 추진력을 유지하고 있습니다. 센티넬-1C의 2024년 발사는 C-밴드 데이터의 지속성을 보장하며, ICEYE의 독일 합작 투자는 라인메탈을 통해 주권적 생산 역량을 확보했습니다. ICEYE는 또한 그리스에 지역 허브를 개설하여 EU 정부들이 전략적 자율성 목표를 준수할 수 있도록 지원합니다.
중동 및 아프리카는 초기 단계이지만 활발히 움직이고 있습니다. UAE 최초의 SAR 위성 포어사이트-1과 스페이스42의 아이시이 제조 파트너십은 위성 수입에서 현지 제작 능력으로의 지역적 전환을 보여줍니다. 아프리카 국가들은 천연자원 모니터링 및 국경 안보를 위해 SAR을 검토 중이지만, 예산 제약으로 단기 도입은 제한될 전망입니다.
기타 혜택 :
- 엑셀 형식 시장 예측(ME) 시트
- 3개월간의 애널리스트 지원
목차
제1장 서론
- 조사의 전제조건과 시장의 정의
- 조사 범위
제2장 조사 방법
제3장 주요 요약
제4장 시장 상황
- 시장 개요
- 시장 성장 촉진요인
- 방위 부문 모니터링 예산 증가
- 소형 위성 SAR 군집 보급
- 전천후 재난 대응 영상 수요
- AI 기반 SAR 분석 서비스 모델
- 멀티 스태틱 SAR 군집(재방 30분 미만)
- 시장 성장 억제요인
- 우주 SAR 개발과 발사 비용 상승
- 소형 위성 플랫폼의 전력과 다운링크 제한
- X/C 밴드의 RF 스펙트럼 혼잡
- 가치/공급망 분석
- 규제 상황
- 기술의 전망
- Porter's Five Forces
- 공급기업의 협상력
- 구매자의 협상력
- 신규 참가업체의 위협
- 대체품의 위협
- 경쟁 기업간 경쟁 관계
제5장 시장 규모와 성장 예측
- 플랫폼별
- 항공 SAR
- 유인 항공기
- 무인 항공기
- 우주 SAR
- 소형 위성(500kg 이하)
- 대형 위성(500kg 이상)
- 지상 기반 SAR
- 해상 기반 SAR
- 항공 SAR
- 주파수 대역별
- X-밴드
- L-밴드
- C-밴드
- S-밴드
- Ku-밴드
- Ka-밴드
- 기타(P, VHF, UHF)
- 컴포넌트별
- 안테나
- 송신기
- 수신기
- 데이터 프로세서 및 소프트웨어
- 전원
- 기타
- 모드별
- 스트립 맵
- 스포트라이트
- ScanSAR(광역)
- 간섭 SAR(InSAR)
- 편파 SAR(PolSAR)
- 용도별
- 군사와 방위
- 지구관측과 환경 모니터링
- 석유 및 가스 탐사
- 인프라 모니터링
- 해상 모니터링
- 재해 관리와 농업
- 기타 용도
- 지역별
- 북미
- 미국
- 캐나다
- 멕시코
- 남미
- 브라질
- 아르헨티나
- 기타 남미
- 유럽
- 독일
- 영국
- 프랑스
- 이탈리아
- 스페인
- 러시아
- 기타 유럽
- 아시아태평양
- 중국
- 일본
- 인도
- 한국
- 호주 및 뉴질랜드
- 동남아시아
- 기타 아시아태평양
- 중동 및 아프리카
- 중동
- 사우디아라비아
- 아랍에미리트(UAE)
- 튀르키예
- 이스라엘
- 기타 중동
- 아프리카
- 남아프리카
- 나이지리아
- 이집트
- 기타 아프리카
- 북미
제6장 경쟁 구도
- 시장 집중도
- 전략적 움직임과 전개
- 시장 점유율 분석
- 기업 프로파일
- Lockheed Martin Corporation
- Airbus SE
- Aselsan AS
- BAE Systems plc
- Cobham Plc
- General Atomics Aeronautical Systems Inc.
- L3Harris Technologies
- IMSAR LLC
- Israel Aerospace Industries Ltd
- Leonardo SpA
- Maxar Technologies Ltd
- MetaSensing Group
- Northrop Grumman Corporation
- RTX Corporation(Raytheon)
- Saab AB
- SAR AERO
- SRC Inc.
- Thales Group
- Capella Space
- ICEYE
- OHB SE
- Indra Sistemas
- Mitsubishi Electric Corporation
- Terma A/S
제7장 시장 기회와 장래의 전망
HBR 25.11.19The synthetic aperture radar market size stands at USD 5.79 billion in 2025 and is projected to reach USD 9.88 billion by 2030, registering an 11.28% CAGR.
Commercial demand is rising as all-weather imaging becomes essential for maritime safety, precision agriculture, and disaster response. Artificial intelligence is turning raw radar data into real-time decision support, while small-satellite constellations under 500 kg shorten revisit intervals to sub-30 minutes and cut deployment costs. Frequency diversification toward Ka-band mitigates X-band spectrum congestion and accelerates high-volume data downlinks, and software-defined payloads allow operators to switch imaging modes in orbit.
Global Synthetic Aperture Radar Market Trends and Insights
Increased Defence-Sector Surveillance Budgets
Escalating military expenditure anchors demand for persistent, high-resolution coverage. The U.S. Space Force set aside USD 4.7 billion for space procurement in fiscal 2024, channeling funds toward radar-enabled counterspace assets.China's air-defence radar base reached USD 6 billion by 2022, extending strategic depth for multi-domain operations. European programs such as Poland's EUR 200 million (USD 216 million) multiyear order with ICEYE confirm steady procurement pipelines. Combined, these outlays guarantee baseline volumes for platform manufacturers and analytic service providers.
Proliferation of Small-Satellite SAR Constellations
Distributed fleets below 500 kg compress manufacturing cycles and slash launch charges, making revisit rates of 30 minutes economically viable. ICEYE's 40-satellite fleet exemplifies the shift from monolithic spacecraft to scalable clusters. Total mission costs have fallen from USD 100 million for legacy birds to under USD 15 million for NewSpace units, catalyzing commercial entry.Japan's Synspective secured a 10-launch agreement with Rocket Lab for 2025-2027, underscoring investor confidence in rapid-cadence deployment.
High Spaceborne SAR Development & Launch Costs
Even with reusable launchers, capital requirements stay steep for precision radar payloads. Radiation-tolerant components, thermal control, and phased-array antennas drive bills upward, limiting new entrants that lack aerospace pedigree. Export-control approvals and cross-border frequency filings elongate project timelines, dampening cash-flow flexibility.
Other drivers and restraints analyzed in the detailed report include:
- All-Weather Disaster-Response Imaging Demand
- AI-Driven SAR Analytics Service Models
- RF-Spectrum Congestion in X/C Bands
For complete list of drivers and restraints, kindly check the Table Of Contents.
Segment Analysis
Airborne assets capture highest share of 54% synthetic aperture radar market because defence agencies rely on flexible flight profiles and real-time crewed interpretation. Service providers combine manned aircraft with unmanned aerial vehicles for short-notice missions over restricted zones.
However, Spaceborne systems have shifted from a handful of multiton assets to proliferated clusters, enabling faster coverage without heavy infrastructure. Spaceborne systems record a 13.3% CAGR, making them the standout contributor to future synthetic aperture radar market size. ICEYE's Gen-4 units with 1 200 MHz bandwidth achieve 25 cm resolution, matching larger craft at a fraction of cost. Distributed risk across many low-cost spacecraft also improves constellation resiliency against orbital debris and anti-satellite threats.
X-band maintains 41% revenue share, favored by militaries for fine-scale mapping in varied weather. Established supply chains streamline payload procurement, reinforcing incumbency. C-band remains central for agriculture and climate surveillance through the Sentinel-1 fleet.
Ka-band's 13.6% CAGR reflects its ability to transmit 26 Tb of daily data, supporting real-time analytics that expand the synthetic aperture radar market. Higher frequencies reduce spectrum congestion but obligate advanced thermal designs and steerable antennas. Emerging Ku-band platforms promise mid-cost, high-throughput links for commercial imaging.
Synthetic Aperture Radar Market is Segmented by Platform (Airborne SAR, Spaceborne SAR, Ground-Based SAR, and More), Frequency Band (X-Band, L-Band, C-Band, and More), Component (Antenna, Transmitter, Receiver, and More), Mode (Stripmap, Spotlight, and More), Application (Military and Defense, Oil and Gas and More) and by Geography. The Market Forecasts are Provided in Terms of Value (USD).
Geography Analysis
North America led the synthetic aperture radar market in 2024 with 35% revenue, underpinned by NASA technology budgets and deep defence procurement. The FY 2026 request allocates USD 72.1 million to the NISAR mission, ensuring domestic demand for payload integrators and analytics firms. Commercial vendors such as Capella Space and Umbra Space benefit from a robust venture-capital ecosystem, while Canada uses RADARSAT derivatives for Arctic and resource surveillance.
Asia-Pacific exhibits the fastest 12.4% CAGR, driven by China's 26-billion-yuan order book that positions the region to eclipse North American volume by 2030. Beijing-based Weina Star's RMB 8.04 billion constellation contract signals long-term industrialization of SAR manufacturing. Japan's Synspective raised JPY 7 billion (USD 47 million) in Series C and aligned with Mitsubishi Electric, Toyoda Gosei, and IHI to co-develop payloads, reinforcing local supply chains. India's domestic electronics output touched INR 9.52 lakh crore (USD 115 billion), laying the groundwork for indigenous component sourcing. South Korea's ASIC roadmap targets radiation-hardened chipsets to secure export contracts.
Europe retains steady momentum via the Copernicus program and defence collaboration. Sentinel-1C's 2024 launch guarantees continuity of C-band data, while ICEYE's German joint venture with anchors sovereign production capacity Rheinmetall. ICEYE has also opened regional hubs in Greece, enabling EU governments to comply with strategic autonomy objectives.
The Middle East and Africa are nascent but active. UAE's first SAR satellite, Foresight-1, coupled with Space42's manufacturing partnership with ICEYE, illustrates a regional pivot from satellite import to local build-to-print capability. African states evaluate SAR for natural-resource oversight and border security, although budget limits will temper short-term uptake.
- Lockheed Martin Corporation
- Airbus SE
- Aselsan A.S.
- BAE Systems plc
- Cobham Plc
- General Atomics Aeronautical Systems Inc.
- L3Harris Technologies
- IMSAR LLC
- Israel Aerospace Industries Ltd
- Leonardo SpA
- Maxar Technologies Ltd
- MetaSensing Group
- Northrop Grumman Corporation
- RTX Corporation (Raytheon)
- Saab AB
- SAR AERO
- SRC Inc.
- Thales Group
- Capella Space
- ICEYE
- OHB SE
- Indra Sistemas
- Mitsubishi Electric Corporation
- Terma A/S
Additional Benefits:
- The market estimate (ME) sheet in Excel format
- 3 months of analyst support
TABLE OF CONTENTS
1 INTRODUCTION
- 1.1 Study Assumptions and Market Definition
- 1.2 Scope of the Study
2 RESEARCH METHODOLOGY
3 EXECUTIVE SUMMARY
4 MARKET LANDSCAPE
- 4.1 Market Overview
- 4.2 Market Drivers
- 4.2.1 Increased defence-sector surveillance budgets
- 4.2.2 Proliferation of small-satellite SAR constellations
- 4.2.3 All-weather disaster-response imaging demand
- 4.2.4 AI-driven SAR analytics service models
- 4.2.5 Multi-static SAR constellations (<30-min revisit)
- 4.3 Market Restraints
- 4.3.1 High spaceborne SAR development and launch costs
- 4.3.2 Power and down-link limits in small-sat platforms
- 4.3.3 RF-spectrum congestion in X/C bands
- 4.4 Value / Supply-Chain Analysis
- 4.5 Regulatory Landscape
- 4.6 Technological Outlook
- 4.7 Porter's Five Forces
- 4.7.1 Bargaining Power of Suppliers
- 4.7.2 Bargaining Power of Buyers
- 4.7.3 Threat of New Entrants
- 4.7.4 Threat of Substitute Products
- 4.7.5 Intensity of Competitive Rivalry
5 MARKET SIZE AND GROWTH FORECASTS (VALUE)
- 5.1 By Platform
- 5.1.1 Airborne SAR
- 5.1.1.1 Manned Aircraft
- 5.1.1.2 UAV
- 5.1.2 Spaceborne SAR
- 5.1.2.1 Small Satellites (<=500 kg)
- 5.1.2.2 Large Satellites (>500 kg)
- 5.1.3 Ground-based SAR
- 5.1.4 Maritime-based SAR
- 5.1.1 Airborne SAR
- 5.2 By Frequency Band
- 5.2.1 X-Band
- 5.2.2 L-Band
- 5.2.3 C-Band
- 5.2.4 S-Band
- 5.2.5 Ku-Band
- 5.2.6 Ka-Band
- 5.2.7 Others (P, VHF, UHF)
- 5.3 By Component
- 5.3.1 Antenna
- 5.3.2 Transmitter
- 5.3.3 Receiver
- 5.3.4 Data Processor and Software
- 5.3.5 Power Supply
- 5.3.6 Others
- 5.4 By Mode
- 5.4.1 Stripmap
- 5.4.2 Spotlight
- 5.4.3 ScanSAR (Wide-Swath)
- 5.4.4 Interferometric SAR (InSAR)
- 5.4.5 Polarimetric SAR (PolSAR)
- 5.5 By Application
- 5.5.1 Military and Defence
- 5.5.2 Earth Observation and Environmental Monitoring
- 5.5.3 Oil and Gas Exploration
- 5.5.4 Infrastructure Monitoring
- 5.5.5 Maritime Surveillance
- 5.5.6 Disaster Management and Agriculture
- 5.5.7 Other Applications
- 5.6 By Geography
- 5.6.1 North America
- 5.6.1.1 United States
- 5.6.1.2 Canada
- 5.6.1.3 Mexico
- 5.6.2 South America
- 5.6.2.1 Brazil
- 5.6.2.2 Argentina
- 5.6.2.3 Rest of South America
- 5.6.3 Europe
- 5.6.3.1 Germany
- 5.6.3.2 United Kingdom
- 5.6.3.3 France
- 5.6.3.4 Italy
- 5.6.3.5 Spain
- 5.6.3.6 Russia
- 5.6.3.7 Rest of Europe
- 5.6.4 APAC
- 5.6.4.1 China
- 5.6.4.2 Japan
- 5.6.4.3 India
- 5.6.4.4 South Korea
- 5.6.4.5 Australia and New Zealand
- 5.6.4.6 Southeast Asia
- 5.6.4.7 Rest of APAC
- 5.6.5 Middle East and Africa
- 5.6.5.1 Middle East
- 5.6.5.1.1 Saudi Arabia
- 5.6.5.1.2 UAE
- 5.6.5.1.3 Turkey
- 5.6.5.1.4 Israel
- 5.6.5.1.5 Rest of Middle East
- 5.6.5.2 Africa
- 5.6.5.2.1 South Africa
- 5.6.5.2.2 Nigeria
- 5.6.5.2.3 Egypt
- 5.6.5.2.4 Rest of Africa
- 5.6.1 North America
6 COMPETITIVE LANDSCAPE
- 6.1 Market Concentration
- 6.2 Strategic Moves and Developments
- 6.3 Market Share Analysis
- 6.4 Company Profiles (includes Global level Overview, Market level overview, Core Segments, Financials as available, Strategic Information, Market Rank/Share for key companies, Products and Services, and Recent Developments)
- 6.4.1 Lockheed Martin Corporation
- 6.4.2 Airbus SE
- 6.4.3 Aselsan A.S.
- 6.4.4 BAE Systems plc
- 6.4.5 Cobham Plc
- 6.4.6 General Atomics Aeronautical Systems Inc.
- 6.4.7 L3Harris Technologies
- 6.4.8 IMSAR LLC
- 6.4.9 Israel Aerospace Industries Ltd
- 6.4.10 Leonardo SpA
- 6.4.11 Maxar Technologies Ltd
- 6.4.12 MetaSensing Group
- 6.4.13 Northrop Grumman Corporation
- 6.4.14 RTX Corporation (Raytheon)
- 6.4.15 Saab AB
- 6.4.16 SAR AERO
- 6.4.17 SRC Inc.
- 6.4.18 Thales Group
- 6.4.19 Capella Space
- 6.4.20 ICEYE
- 6.4.21 OHB SE
- 6.4.22 Indra Sistemas
- 6.4.23 Mitsubishi Electric Corporation
- 6.4.24 Terma A/S
7 MARKET OPPORTUNITIES AND FUTURE OUTLOOK
- 7.1 White-space and Unmet-Need Assessment

