
|
시장보고서
상품코드
1536906
온쇼어 석유 및 가스 파이프라인 시장 : 점유율 분석, 산업 동향, 성장 예측(2024-2029년)Onshore Oil And Gas Pipeline - Market Share Analysis, Industry Trends & Statistics, Growth Forecasts (2024 - 2029) |
||||||
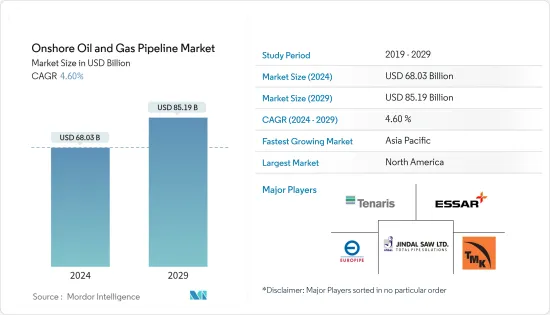
온쇼어 석유 및 가스 파이프라인 시장 규모는 2024년 680억 3,000만 달러로 추정되고, 2029년 851억 9,000만 달러에 이를 전망이며, 예측 기간 중(2024-2029년) CAGR 4.60%로 성장할 것으로 예측됩니다.
주요 하이라이트
- 풍부한 천연가스 매장량과 다른 화석연료에 비해 저렴하다는 점이 발전을 포함한 여러 최종 사용자의 천연가스 수요를 보완할 것으로 예상됩니다. 이것은 예측 기간 동안 가스 파이프라인 분야를 밀어 올릴 것으로 예상됩니다.
- 그러나 발전을 위한 신재생 에너지원으로의 세계적인 변화는 석유 및 가스 수요에 큰 위협을 가하고 있으며, 이는 예측기간 동안 온쇼어 석유 및 가스 파이프라인 설비의 성장에 큰 과제가 될 것 같습니다.
- 하지만 온쇼어 탐사 및 생산 프로젝트 증가는 파이프라인 산업이 보다 성장하기 위한 길을 열고 있기 때문에 향후 수년간은 시장 관계자에게 절호의 기회를 가져올 것으로 예상됩니다.
- 예측 기간 동안 아시아태평양은 큰 성장을 이룰 것으로 예상되며, 대부분 수요는 중국, 인도 등의 국가에서 파생됩니다.
온쇼어 석유 및 가스 파이프라인 시장 동향
시장을 독점하는 천연가스 파이프라인 유형
*온쇼어 파이프라인은 국가의 내륙 지역과 지역에 설치됩니다. 온쇼어 파이프라인에는 본관, 횡단관, 피더관, 송전관, 지선, 지상관, 지하관 등 다양한 유형이 있습니다.
*기존 온쇼어 파이프라인 프로젝트의 확장은 수요 증가에 대응하기 위해 각국에서 이루어지고 있습니다. 미국 에너지 정보국(EIA)에 따르면 미국에서는 2023년에 약 52억 입방 피트/일(Bcf/d)의 천연 가스 주내 파이프라인 용량이 추가되었습니다. 이 파이프라인 확장의 대부분은 미국 멕시코 걸프 시장의 천연 가스 수요를 충족시키기 위해 텍사스와 루이지애나에서 이루어졌습니다.
*또한 가스 배급 시스템의 주요 주행 거리는 최근 몇 년동안 증가하고 있습니다. 미국 운수부에 따르면 2023년 배급간선 주행거리는 1,367,244마일로 전년대비 1% 증가했습니다. 최종 소비자의 가스 이용이 증가하고 있다는 점을 감안할 때, 가스 분배 시스템의 주 주행 거리의 점진적인 성장은 즉시 지속될 것으로 보입니다.
*마찬가지로 2030년까지 중동, 아프리카, 아시아태평양 등 지역의 환경적 이점과 에너지 안보 추구 등의 요인으로 인해 천연가스 수요는 모든 연료유형 중 큰 성장으로 성장할 것으로 예상됩니다.
*이란은 2024년 7월 부셰르, 팔루스, 야즈드, 이스파한 등 주 천연가스 수요를 충족하기 위해 전장 1200km의 파이프라인 '이란가스 트렁크라인-IGAT XI' 개발을 시작했습니다. 이란 국영가스공사가 소유한 이 프로젝트는 2027년까지 완성될 전망입니다. 이러한 신흥국 시장의 개척은 석유 및 가스 파이프라인 시장 예측기간 중 성장을 뒷받침할 것으로 보입니다.
*셰일가스 광상과 같은 새로운 천연가스원의 개발과 이에 따른 가격압력은 천연가스의 국제거래를 증가시키고 있습니다. 따라서 이러한 개발은 예측 기간 동안 파이프라인 네트워크의 확장 수요가 증가할 것으로 예상했습니다.
아시아태평양이 큰 수요가 될 전망
*아시아태평양의 에너지 소비는 2050년까지 최대 48% 증가할 것으로 예상됩니다. 국제에너지기구(IEA)에 따르면 중국은 2025년까지 세계 에너지 증가의 30%에 기여할 것으로 예상됩니다. 원유 및 천연가스의 소비량은 주로 인도나 중국 등 신흥 경제국 수요 증가에 따라 최근 이 지역에서 현저한 성장을 보이고 있습니다.
*2024년 1월 현재 호주 석유 및 가스 메이저인 산토스는 바로사 가스전과 호주 북부의 도시 다윈의 처리 공장을 연결하는 약 43억 달러의 가스 파이프라인 프로젝트의 건설을 개시하기로 결정합니다. 이 프로젝트는 호주에서 천연 가스의 가용성을 미래에 높일 것으로 보입니다.
*인도는 또한 수요 증가에 대응하기 위해 가스 파이프라인의 인프라 정비를 진행하고 있습니다. 이 나라는 에너지 바구니에서 차지하는 천연가스의 비율을 15%까지 높이는 것을 목표로 하고 있습니다. 2030년까지 온쇼어 가스 파이프라인, CGD, LNG 재가스화 터미널을 포함한 가스 인프라 건설에 660억 달러의 투자를 기대하고 있습니다. 또한 인도 정부는 2020년 12월 주로 온쇼어 가스 파이프라인 인프라 구축을 위해 600억 달러를 투자할 것이라고 발표했습니다. 이는 2024년까지 전국 232개 지역에서 압축 천연가스 파이프라인 네트워크(CGD)를 확대하는 것을 목표로 하고 있습니다.
*아시아태평양의 석유 소비량은 최근 증가 추세에 있습니다. 세계 에너지 통계에 따르면 2022년 석유 소비량은 16억 1,500만 톤으로 전년 대비 0.5% 증가했습니다. 예측 기간 동안 석유 소비량은 더욱 증가할 것으로 보입니다.
*따라서 아시아태평양의 원유 및 천연가스 수요 증가와 새로운 파이프라인 및 인프라 등의 중요한 요인이 세계 온쇼어 석유 및 가스 파이프라인 시장의 성장을 가속할 것으로 예상됩니다.
온쇼어 석유 및 가스 파이프라인 산업 개요
온쇼어 석유 및 가스 파이프라인 시장은 단편화되고 있습니다. 이 시장의 주요 기업으로는 Tenaris SA, Essar Group, Jindal SAW Ltd, Europipe GmbH, TMK Group 등이 있습니다(순부동).
기타 혜택 :
- 엑셀 형식 시장 예측(ME) 시트
- 3개월간의 애널리스트 서포트
목차
제1장 서론
- 조사 범위
- 시장의 정의
- 조사의 전제
제2장 조사 방법
제3장 주요 요약
제4장 시장 개요
- 서문
- 시장 규모 및 수요 예측(-2029년)
- 파이프라인의 역사적 설치 용량과 예측(킬로미터 단위)(-2029년)
- 지역간 파이프라인 수입용량(BSCM)(-2029년)
- 지역간 파이프라인의 수출 용량(BSCM)(-2029년)
- 브렌트 원유 및 헨리 허브 스팟 가격의 전망(-2029년)
- 육상 CAPEX 예측(-2029년)
- 최근의 동향 및 전개
- 정부의 규제 및 정책
- 시장 역학
- 성장 촉진요인
- 풍부한 천연가스 매장량과 다른 화석연료에 비해 저비용
- 세계 수요를 충족시키기 위한 증산 투자 증가
- 억제요인
- 세계의 신재생 에너지로의 시프트
- 성장 촉진요인
- 공급망 분석
- Porter's Five Forces 분석
- 공급기업의 협상력
- 소비자의 협상력
- 신규 진입업자의 위협
- 대체품의 위협
- 경쟁 기업간 경쟁 관계
제5장 시장 세분화
- 유형별
- 석유 파이프라인
- 가스 파이프라인
- 지역별
- 북미
- 미국
- 캐나다
- 기타 북미
- 유럽
- 노르웨이
- 영국
- 프랑스
- 스페인
- 노르딕
- 러시아
- 기타 유럽
- 아시아태평양
- 중국
- 인도
- 인도네시아
- 말레이시아
- 베트남
- 태국
- 기타 아시아태평양
- 남미
- 브라질
- 아르헨티나
- 콜롬비아
- 기타 남아프리카
- 중동 및 아프리카
- 아랍에미리트(UAE)
- 사우디아라비아
- 남아프리카
- 이집트
- 나이지리아
- 카타르
- 기타 중동 및 아프리카
- 북미
제6장 경쟁 구도
- M&A, 합작사업, 제휴 및 협정
- 주요 기업의 전략
- 기업 프로파일
- Essar Group
- Jindal SAW Ltd
- Tenaris SA
- Europipe GmbH
- CPW America Co.
- TMK Group
- Baoshan Iron & Steel Co. Ltd
- TC Energy Corporation
- WorleyParsons Limited
- Mastec Inc.
- 시장 랭킹 분석
제7장 시장 기회 및 향후 동향
AJY 24.09.03The Onshore Oil And Gas Pipeline Market size is estimated at USD 68.03 billion in 2024, and is expected to reach USD 85.19 billion by 2029, growing at a CAGR of 4.60% during the forecast period (2024-2029).
Key Highlights
- Factors such as the availability of abundant natural gas reserves and the lower cost compared to other fossil fuel types are expected to supplement the demand for natural gas from multiple end-users, including power generation. This, in turn, is expected to boost the gas pipeline segment during the forecast period.
- However, the global shift toward renewable sources for electricity generation poses a huge threat to the oil and gas demand, which is likely to be a major challenge for the growth of onshore oil and gas pipeline installations during the forecast period.
- Nevertheless, the rise in onshore exploration and production projects is expected to create excellent opportunities for the market players in the years to come, as these projects are paving the way for the pipeline industry to grow more.
- Asia-Pacific is expected to witness significant growth during the forecast period, with the majority of the demand coming from countries like China, India, etc.
Onshore Oil & Gas Pipeline Market Trends
Natural Gas Pipeline Type to Dominate the Market
* Onshore pipelines are laid in the country's inland areas or a region. Onshore pipelines are of different types: mains, crossings, feeder lines, transmissions, spur lines, and above-ground and underground pipelines.
* The expansion of existing onshore pipeline projects is being done in countries to cater to growing demand. As per the US Energy Information Administration (EIA), about 5.2 billion cubic feet per day (Bcf/d) of natural gas intrastate pipeline capacity was added in the United States of America in 2023. Most of the intrastate pipeline additions were made in Texas and Louisiana to fulfill natural gas demand in the United States Gulf Coast Markets.
* Moreover, the main mileage of gas distribution systems has grown in recent years. As per the United States of Transportation, in 2023, the distribution main mileage stood at 1,367,244 miles, an increase of 1% from the previous year. Considering the increase in the utilization of gas from end-consumers, the gradual growth of main mileage for gas distribution systems is likely to persist soon.
* Likewise, By 2030, owing to factors such as environmental benefits and the quest for energy security in regions such as the Middle East, Africa, and Asia-Pacific, the demand for natural gas is expected to witness significant growth among all fuel types.
* In July 2024, Iran commenced the development of the Iranian Gas Trunk Line-IGAT XI pipeline of 1200 kilometers to fulfill the natural gas demand of its provinces, such as Bushehr, Fars, Yazd, and Isfahan. The project owned by National Iranian Gas Co. is likely to be completed by 2027. Such developments are likely to help the oil and gas pipeline market grow in the forecast period.
* The development of new natural gas sources, such as shale gas deposits, and the resulting price pressure are increasing the international trade of natural gas. Hence, these developments are expected to increase the demand for pipeline network expansion during the forecast period.
Asia-Pacific Expected to Witness Significant Demand
* The energy consumption in Asia-Pacific is expected to increase by up to 48% by 2050. According to the International Energy Agency (IEA), China is expected to contribute 30% of the world's energy increase until 2025. Crude oil and natural gas consumption has witnessed significant growth in the region in recent years, mainly due to increasing demand from emerging economies like India and China.
* As of January 2024, Santos - Australia's oil & gas major, decided to commence the construction of a gas pipeline project worth about USD 4.3 billion that would connect the Barossa gas field to a processing plant in the northern Australian city of Darwin. The project will likely increase natural gas availability in Australia in the future.
* India is also modifying its gas pipeline infrastructure to meet the growing demand. The nation aims to increase the natural gas share to 15% in the energy basket. It expects USD 66 billion investment in building the gas infrastructure, including onshore gas pipeline, CGD, and LNG regasification terminals by 2030. Moreover, in December 2020, the Indian government announced a USD 60 billion investment for creating gas pipeline infrastructure, primarily onshore, which covers expanding Compressed Natural Gas pipeline networks (CGD) in 232 geographical areas across the country by 2024.
* Oil consumption in the Asia-Pacific has witnessed an increasing trend in recent years. As per the Statistical Review of World Energy, oil consumption stood at 1615 million tonnes in 2022, an increase of 0.5 % from the previous year. It is likely to grow more in the forecast period.
* Therefore, significant factors like the increasing demand for crude oil and natural gas and new pipeline infrastructure in the Asia-Pacific are expected to drive growth in the global onshore oil and gas pipeline market.
Onshore Oil And Gas Pipeline Industry Overview
The onshore oil and gas pipeline market is fragmented. Some of the key players in this market include (in no particular order) Tenaris SA, Essar Group, Jindal SAW Ltd, Europipe GmbH, and TMK Group.
Additional Benefits:
- The market estimate (ME) sheet in Excel format
- 3 months of analyst support
TABLE OF CONTENTS
1 INTRODUCTION
- 1.1 Scope of the Study
- 1.2 Market Definition
- 1.3 Study Assumptions
2 RESEARCH METHODOLOGY
3 EXECUTIVE SUMMARY
4 MARKET OVERVIEW
- 4.1 Introduction
- 4.2 Market Size and Demand Forecast in USD billion, till 2029
- 4.3 Installed Pipeline Historic Capacity and Forecast in Kilometers, till 2029
- 4.4 Inter-Regional Pipeline Import Capacity in BSCM, till 2029
- 4.5 Inter-Regional Pipeline Export Capacity in BSCM, till 2029
- 4.6 Brent Crude Oil and Henry Hub Spot Prices Forecast, till 2029
- 4.7 Onshore CAPEX Forecast in USD billion, till 2029
- 4.8 Recent Trends and Developments
- 4.9 Government Policies and Regulations
- 4.10 Market Dynamics
- 4.10.1 Drivers
- 4.10.1.1 Availability of abundant natural gas reserves and the lower cost compared to other fossil fuel types
- 4.10.1.2 Growing investments to increase production to fulfill global demand
- 4.10.2 Restraints
- 4.10.2.1 The global shift toward renewable sources for electricity generation
- 4.10.1 Drivers
- 4.11 Supply Chain Analysis
- 4.12 Porter's Five Forces Analysis
- 4.12.1 Bargaining Power of Suppliers
- 4.12.2 Bargaining Power of Consumers
- 4.12.3 Threat of New Entrants
- 4.12.4 Threat of Substitutes Products and Services
- 4.12.5 Intensity of Competitive Rivalry
5 MARKET SEGMENTATION
- 5.1 Type
- 5.1.1 Oil Pipeline
- 5.1.2 Gas Pipeline
- 5.2 Geography
- 5.2.1 North America
- 5.2.1.1 United States
- 5.2.1.2 Canada
- 5.2.1.3 Rest of North America
- 5.2.2 Europe
- 5.2.2.1 Norway
- 5.2.2.2 United Kingdom
- 5.2.2.3 France
- 5.2.2.4 Spain
- 5.2.2.5 NORDIC
- 5.2.2.6 Russia
- 5.2.2.7 Rest of Europe
- 5.2.3 Asia Pacific
- 5.2.3.1 China
- 5.2.3.2 India
- 5.2.3.3 Indonesia
- 5.2.3.4 Malaysia
- 5.2.3.5 Vietnam
- 5.2.3.6 Thailand
- 5.2.3.7 Rest of Asia Pacific
- 5.2.4 South America
- 5.2.4.1 Brazil
- 5.2.4.2 Argentina
- 5.2.4.3 Colombia
- 5.2.4.4 Rest of South Africa
- 5.2.5 Middle East and Africa
- 5.2.5.1 United Arab Emirates
- 5.2.5.2 Saudi Arabia
- 5.2.5.3 South Africa
- 5.2.5.4 Egypt
- 5.2.5.5 Nigeria
- 5.2.5.6 Qatar
- 5.2.5.7 Rest of Middle East and Africa
- 5.2.1 North America
6 COMPETITIVE LANDSCAPE
- 6.1 Mergers and Acquisitions, Joint Ventures, Collaborations, and Agreements
- 6.2 Strategies Adopted by Leading Players
- 6.3 Company Profiles
- 6.3.1 Essar Group
- 6.3.2 Jindal SAW Ltd
- 6.3.3 Tenaris SA
- 6.3.4 Europipe GmbH
- 6.3.5 CPW America Co.
- 6.3.6 TMK Group
- 6.3.7 Baoshan Iron & Steel Co. Ltd
- 6.3.8 TC Energy Corporation
- 6.3.9 WorleyParsons Limited
- 6.3.10 Mastec Inc.
- 6.4 Market Ranking Analysis

