


|
시장보고서
상품코드
1628751
인도네시아의 지열 에너지 - 시장 점유율 분석, 산업 동향 및 통계, 성장 전망(2025-2030년)Indonesia Geothermal Energy - Market Share Analysis, Industry Trends & Statistics, Growth Forecasts (2025 - 2030) |
||||||
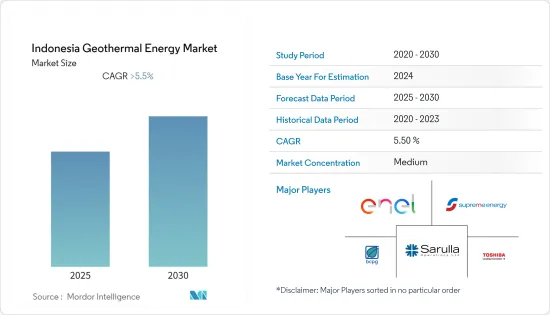
인도네시아의 지열 에너지 시장은 예측 기간 동안 5.5% 이상의 CAGR을 나타낼 것으로 예상됩니다.
코로나19는 시장에 악영향을 미쳤습니다. 현재 시장은 전염병 이전 수준에 도달했습니다.
주요 하이라이트
- 장기적으로 화석 연료에 대한 의존도를 낮추어 CO2 배출량을 줄이려는 정부의 이니셔티브는 시장의 주요 동인이 될 것입니다. 예측 기간 동안 전력 수요 증가가 시장을 견인할 것으로 보입니다.
- 반면, 지열 에너지는 화석연료에 의한 전력보다 비싸고 태양광, 풍력 등 다른 재생에너지와의 경쟁도 심해 예측 기간 동안 시장 성장이 둔화될 것으로 예상됩니다.
추정 인구가 2억 9,600만 명으로 2030년까지 도시화율이 71%까지 상승할 것으로 예상됨에 따라 전력 수요는 증가할 것으로 예상됩니다. 인도네시아 정부는 2030년까지 CO2 배출량을 29% 감축하고자 합니다. 이는 증가하는 전력 수요에 대응하기 위해 재생에너지의 활용을 늘림으로써 실현될 가능성이 높습니다. 이는 가까운 미래에 지열 시장에 성장 기회를 제공할 것으로 보입니다.
인도네시아 지열에너지 시장 동향
전력 수요 증가가 시장을 주도할 가능성이 높음
- 인도네시아의 인구와 도시 성장에 따라 전력 수요는 해마다 증가하고 있으며, 2021년 인도네시아의 전력 소비량은 1억 6,838만 BOE(석유환산배럴)에 달할 것으로 예상됩니다.
- 2021년 인도네시아 가정 부문의 총 전력 소비량은 약 7,028만 9,000BOE였습니다. 가정용 전력 소비가 가장 많으며 전체 전력 소비량의 약 41.7%를 차지합니다.
- 인도네시아의 가정용 전력 수요는 350 TWh까지 증가할 것으로 추정됩니다. 반면, 산업 및 상업 부문 수요는 각각 약 80TWh와 70TWh로 증가할 것으로 예상됩니다.
- 가정 부문에서의 가전제품 사용이 전력 소비 증가의 주요 요인이 될 것으로 예상됩니다. 반면, 금속 산업, 화학 산업, 식품 산업, 섬유 산업은 산업용 전력 소비의 주요 원동력이 될 것으로 예상됩니다.
인구 증가에 따라 인도네시아의 가구 수는 2050년까지 8,000만 가구에 육박할 것으로 예상됩니다. 따라서 향후 몇 년동안 전력 사용량이 증가할 가능성이 높습니다. 정부가 재생 가능 에너지로 인한 전력량을 늘리려고 노력하고 있기 때문에 지열 에너지는 향후 몇 년동안 전력 공급원이 될 수 있는 지열 에너지가 성장할 것으로 예상됩니다.
향후 석탄화력발전소가 시장 성장을 제한할 가능성이 높음
- 2021년 인도네시아의 발전소 설비용량은 약 7만 4,532.94MW로 2020년 대비 약 7만 2,750.73MW로 증가했습니다. 총 설비용량은 약 51.8%로 증기 발전소가 2021년 발전소 산업을 주도했습니다.
- 2021년 연료별 1차 에너지 소비량은 8.31 엑사쥴로 석탄 39%, 천연가스 16%, 석유 34%, 재생에너지 7.5%로 나타났습니다.
- 석탄을 연료로 하는 발전소에 대한 의존도가 높기 때문에 기존 석탄 발전소를 가동하면서 새로운 석탄 발전소를 건설할 계획이며, 2021년 석탄 에너지 소비량은 8,782만 BOE(석유환산배럴)에 달할 전망입니다.
- 지난 11월 인도네시아 정부는 이미 입찰이 진행 중이던 총 발전용량 13기가와트 규모의 석탄발전소 건설을 허가했습니다. 인도네시아의 2021-2030년 10개년 에너지 계획은 이 전략을 명시하고 있습니다. 주목할 만한 것은 조코 위도도 대통령이 2022년 "포로 석탄 발전소"의 개발을 허용하는 법에 서명했다는 점입니다.
- 석탄화력 발전소의 용량을 늘리는 것이 전력 생산 방식의 큰 부분을 차지할 것으로 예상됩니다. 향후 몇 년동안 증가하는 전력 수요의 대부분을 충족시킬 것으로 보입니다. 따라서 인도네시아의 지열 에너지 및 기타 재생 가능 에너지원의 성장은 둔화될 것으로 예상됩니다.
인도네시아의 지열 에너지 산업 개요
인도네시아의 지열 에너지 시장은 비교적 통합되어 있습니다. 이 시장의 주요 참여자(순서는 무관)로는 Enal SpA, Toshiba Energy Systems & Solutions Corporation, BCPG Public Company Limited, PT Supreme Energy, Sarulla Operations Ltd. 등이 있습니다.
기타 혜택
- 엑셀 형식 시장 예측(ME) 시트
- 3개월간의 애널리스트 지원
목차
제1장 서론
- 조사 범위
- 시장의 정의
- 조사 전제
제2장 주요 요약
제3장 조사 방법
제4장 시장 개요
- 서론
- 2027년까지 설치용량과 예측(단위 : MW)
- 최근 동향과 개발
- 정부 규제와 시책
- 시장 역학
- 성장 촉진요인
- 성장 억제요인
- 공급망 분석
- PESTLE 분석
제5장 경쟁 구도
- 인수합병(M&A)/합작투자(JV)/협업/협정
- 주요 기업의 전략
- 기업 개요
- Enal SpA
- Toshiba Energy Systems & Solutions Corporation
- BCPG Public Company Limited
- PT Supreme Energy
- Sarulla Operations Ltd.
제6장 시장 기회와 향후 동향
LSH 25.01.21The Indonesia Geothermal Energy Market is expected to register a CAGR of greater than 5.5% during the forecast period.

COVID-19 had a detrimental effect on the market. Presently, the market has reached pre-pandemic levels.
Key Highlights
- Over the long term, the primary driver for the market will be the government's efforts to reduce the country's dependency on fossil fuels and thereby reduce CO2 emissions. Increasing electricity demand is likely to drive the market during the forecast period.
- On the other hand, geothermal energy is more expensive than power from fossil fuels, and there is more competition from other renewable energy sources, like solar and wind, which is expected to slow market growth during the forecast period.
Nevertheless, with an estimated population of 296 million and an increased urbanization rate of 71% by 2030, electricity demand is expected to grow. The Indonesian government wants to cut CO2 emissions by 29% by 2030. This is most likely to be done by increasing the use of renewable energy to meet the growing electricity demand. This is likely to give the geothermal market a chance to grow in the near future.
Indonesia Geothermal Energy Market Trends
Increasing Demand for Electricity is Likely to Drive the Market
- Indonesia's need for electricity has grown over the years as the country's population and cities have grown. In 2021, the electricity consumption in Indonesia accounted for 168.38 million BOE (barrel oil equivalent).
- In 2021, the total electricity consumption of the household sector in Indonesia was nearly 70,289 thousand BOE. Households consumed the highest percentage of electricity, with almost 41.7% of the total electricity consumed.
- It is estimated that the household electricity demand in Indonesia is likely to increase to 350 TWh. In contrast, demand in the industrial and commercial sectors is expected to rise to about 80 TWh and 70 TWh, respectively.
- The use of electronic appliances in the household sector is expected to be the primary driver of the increase in electricity consumption. In contrast, the metal, chemical, food, and textile industries are expected to be the major drivers for industrial electricity consumption.
With a growing population, Indonesian households will likely grow to almost 80 million by 2050. This will likely increase the amount of electricity used in the coming years. Geothermal energy as a possible source of electricity is expected to grow over the next few years because the government is trying to increase the amount of electricity made from renewable energy.
Upcoming Coal Fired Power Plant is Likely to Restrict the Market Growth
- In 2021, Indonesia's power plant installed capacity increased to nearly 74,532.94 MW, which was around 72,750.73 MW compared to the capacity in 2020. With a total installed capacity of about 51.8%, steam power plants dominated the power plant industry in 2021.
- In 2021, primary energy consumption by fuel accounted for 8.31 exajoules, which were generated from 39% coal, 16% natural gas, 34% oil, and 7.5% renewables.
- The country has a high reliance on coal-based power plants; thus, there are plans to build new coal power plants with existing coal power plants in operation. In 2021, energy consumption from coal accounted for 87.82 million BOE (barrel oil equivalent).
- In November 2022, the Indonesian government permitted the building new coal plants that had already been bid out and had a total capacity of 13 gigawatts. The country's 10-year energy plan for 2021-2030 lays out the strategy. Notably, President Joko Widodo signed legislation into law in 2022, allowing the development of "captive coal plants."
- Increasing the capacity of coal-fired power plants is expected to make up a big part of how electricity is made. It will likely meet most of the growing demand for electricity over the next few years. This is expected to slow the growth of the country's geothermal energy and other renewable sources.
Indonesia Geothermal Energy Industry Overview
The Indonesia geothermal energy market is moderately consolidated. Some of the key players in the market ( not in particular order ) include Enal SpA, Toshiba Energy Systems & Solutions Corporation, BCPG Public Company Limited, PT Supreme Energy, and Sarulla Operations Ltd.
Additional Benefits:
- The market estimate (ME) sheet in Excel format
- 3 months of analyst support
TABLE OF CONTENTS
1 INTRODUCTION
- 1.1 Scope of the Study
- 1.2 Market Definition
- 1.3 Study Assumptions
2 EXECUTIVE SUMMARY
3 RESEARCH METHODOLOGY
4 MARKET OVERVIEW
- 4.1 Introduction
- 4.2 Installed Capacity and Forecast in MW, till 2027
- 4.3 Recent Trends and Developments
- 4.4 Government Policies and Regulations
- 4.5 Market Dynamics
- 4.5.1 Drivers
- 4.5.2 Restraints
- 4.6 Supply Chain Analysis
- 4.7 PESTLE Analysis
5 COMPETITIVE LANDSCAPE
- 5.1 Mergers and Acquisitions, Joint Ventures, Collaborations, and Agreements
- 5.2 Strategies Adopted by Leading Players
- 5.3 Company Profiles
- 5.3.1 Enal SpA
- 5.3.2 Toshiba Energy Systems & Solutions Corporation
- 5.3.3 BCPG Public Company Limited
- 5.3.4 PT Supreme Energy
- 5.3.5 Sarulla Operations Ltd.
