


|
시장보고서
상품코드
1850084
유틸리티 및 에너지 분석 : 시장 점유율 분석, 산업 동향, 통계, 성장 예측(2025-2030년)Utility And Energy Analytics - Market Share Analysis, Industry Trends & Statistics, Growth Forecasts (2025 - 2030) |
||||||
유틸리티 및 에너지 분석 시장 규모는 2025년에 51억 달러, 2030년에는 114억 8,000만 달러에 이를 것으로 예측되며, CAGR은 17.68%를 기록합니다.

성장의 원동력이 되고 있는 것은 전기율의 상승, 탈탄소 목표의 선명화, 복잡화하는 송전망의 최적화의 필요성입니다. 한편, 전력 부하는 2025년 23GW에서 2030년 128GW로 5배로 급증할 것으로 예측되고 있으며, 사업자는 데이터 인프라와 의사결정 프로세스의 현대화를 강요받고 있습니다. 도매 가격 변동이 치열해지고 스마트 미터의 보급이 가속화되고 클라우드 도입이 확대됨에 따라 첨단 솔루션의 대응 가능 영역이 더욱 확대되고 있습니다. 기존의 운영 기술 벤더가 인수와 제휴를 통해 애널리틱스 포트폴리오를 충실히 하는 한편, 하이퍼스케일 클라우드 기업이 업계 특화형의 AI 서비스를 공익 기업에 제공하기 때문에 경쟁의 격렬함이 증가하고 있습니다.
세계의 유틸리티 및 에너지 분석 시장 동향과 통찰
신재생에너지의무화와 탈탄소화 지출
세계 이산화탄소 배출량 감소 노력을 통해 첨단 예측 및 최적화 도구에 대한 투자가 가속화되고 있습니다. 신재생에너지는 2025년 초까지 세계 전력의 3분의 1을 발전시킬 것으로 예상되며, 송전망에 전례 없는 변동을 가져옵니다. 미국 에너지부는 유틸리티 기업이 분산형 자원을 실시간으로 조정할 수 있다면 2030년까지 집약형 가상 발전소에서 피크 수요의 10-20%를 공급할 수 있을 것으로 추정하고 있습니다. 이러한 개발을 통해 사업자는 높은 빈도의 텔레메트리를 처리하고, 날씨에 좌우되는 출력 변동을 모델화하고, 전일 시장과 당일 시장 전체에서 입찰 전략을 최적화할 수 있는 분석 플랫폼을 도입할 필요에 육박되고 있습니다.
AMI 2.0 배포 및 에지 애널리틱스 채택
차세대 스마트 미터 프로젝트는 레거시 처리 도구를 능가하는 지속적인 데이터 스트림을 생성합니다. 세계 스마트 미터 수익은 2024년 266억 5,000만 달러에서 2025년 292억 9,000만 달러로 증가할 것으로 예측되며, 유틸리티 기업이 에지에서 분석할 수 있는 세분화된 간격 데이터가 생성됩니다. 템스 워터의 네트워크는 미터에 분석을 통합하여 이미 매일 80,000개 이상의 누수를 감지하고 5,700만 리터의 물 손실을 방지합니다. 로컬에서 알고리즘을 실행하면 대기 시간을 최소화하고 백홀 대역폭을 줄이고 배전 운영자가 신속한 전압 및 압력 조정을 트리거할 수 있으며 비용을 줄이면서 그리드의 탄력성을 향상시킵니다.
레거시 OT-IT의 통합 비용 및 데이터 사일로화
많은 유틸리티 회사들은 상호 연결을 위해 설계되지 않은 수십년전의 SCADA, 정전 및 요금 청구 시스템을 여전히 운영하고 있습니다. 이러한 자산을 클라우드 게이트웨이 및 최신 데이터 레이크와 통합하면 초기 분석 예산이 2배, 3배가 되고 프로젝트 일정이 지연되는 경우가 많습니다. 첨단 사업자는 데이터 모델을 표준화하고, API 게이트웨이를 도입하고, 업그레이드를 순차적으로 수행함으로써 미래 분석 레이어를 위한 개방형 아키텍처의 기반을 구축하면서 지출을 억제하고 있습니다.
부문 분석
클라우드 플랫폼은 2025년 지출 증가의 41%를 차지했지만 엄격한 컴플라이언스 요건으로 인해 On-Premise 모델은 59% 시장 점유율을 유지했습니다. 그러나 탄력적인 컴퓨팅, 관리형 AI 서비스 및 종량 과금의 경제성으로 인해 비용 이익의 방정식이 바뀌고 있습니다. 클라우드 구축 유틸리티 및 에너지 분석 시장 규모는 2030년까지 24.10%의 연평균 복합 성장률(CAGR)을 보일 것으로 예측되며, 수평 확장 가능한 아키텍처를 필요로 하는 그린필드의 AMI, 수요 반응, DERMS 배포가 견인합니다. IBM의 SaaS(Software-as-a-Service) 제품군은 그리드에 특화된 템플릿으로 하드화된 감사 가능 환경을 강조하는 공급업체 증가를 보여줍니다. 하이브리드 전략은 일반적이며 민감한 비즈니스 데이터 세트는 데이터센터에 남아 있으며 예측 파이프라인과 고객용 대시보드는 클라우드에서 실행됩니다.
탄력성과 함께 공익 기업은 클라우드의 신속한 혁신주기를 높이 평가합니다. 지리 공간 시각화, what-if 디스패치 시뮬레이터, 고객 셀프 서비스 포털 등의 새로운 기능은 하드웨어 새로 고침에 시간을 들이지 않고도 도입할 수 있습니다. 공급자는 유틸리티자 특유의 컴플라이언스 로드맵을 발표하고 위험 관리 책임자가 이사회의 승인을 보장하는 데 도움이 됩니다. 신뢰가 높아짐에 따라 송전 사업자는 클라우드 네이티브의 역사적인 대체 시스템을 시험적으로 도입하여 5년간 총 소유 비용의 50% 절감을 목표로 하고 있습니다.
공급업체가 제공하는 미터 데이터 관리, 정전 분석 및 예측 도구에 대한 의존도가 근본적임을 반영하여 2024년 수익에서 차지하는 소프트웨어 라이선스의 비율은 여전히 69%입니다. 그러나 서비스 수익은 CAGR 20.80%로 가속화되었으며 유틸리티 기업이 통합 지원, 데이터 품질 개선 및 지속적인 모델 튜닝이 필요함을 보여줍니다. 특히 레거시 감시 제어 및 데이터 수집 플랫폼에 미들웨어 어댑터가 필요한 경우 전문 서비스의 지출이 여러 해에 걸친 배포의 소프트웨어 지출과 동일한 금액이 될 수 있음이 현장에서 입증되었습니다. Cognizant의 2024년 4분기 매출은 전년 동기 대비 6.8% 증가했지만, 이는 유틸리티 분석 수요에 추진되었기 때문에 부가가치 계약으로의 전환을 뒷받침하고 있습니다.
유틸리티 기업이 변전소의 위상 측정 유닛과 피더 레벨 센서를 도입하고 있기 때문에 에지 하드웨어의 도입도 증가하고 있습니다. 이러한 장치는 대량의 파형을 전처리하고 이벤트 기반 요약만 중앙 저장소로 전송합니다. 에지는 거의 순간에 고장 지점을 식별하고 전압 제어를 가능하게 하고, 장비의 수명을 연장하고, 전력 품질을 향상시킵니다.
유틸리티 및 에너지 분석 시장은 배포(On-Premise, 클라우드, 하이브리드), 구성요소(소프트웨어, 서비스 등), 용도(미터 운영 및 데이터 관리, 부하 및 발전 예측 등), 최종 사용자(발전 사업자, 송배전 사업자 등), 유틸리티 유형(전기, 가스, 기타), 지역별로 구분됩니다. 시장 예측은 금액(달러)으로 제공됩니다.
지역별 분석
북미는 성숙한 디지털 인프라, 70% 이상의 AMI 보급률, 실적에 따른 요금 결정에 보답하는 지지적인 규제 구조에 힘입어 2024년 38%의 매출 점유율을 유지했습니다. 주 수준의 탄력성 프로그램은 정전 분석, 식생 침식 모델링, 산불 위험 점수에 자금을 돌리고 있습니다. 텍사스는 2025년에 유연한 로드 소비량이 540억 kWh에 이르는 수요 증가를 보여주는 예이며, 전력 회사는 부하 예측의 정확성을 높이고 송전망의 자동화를 강화할 필요가 있습니다. 유틸리티 기업은 고주파 검침 및 변전소 파형을 처리하기 위해 탄력적인 컴퓨팅을 활용하므로 클라우드 배포가 On-Premise(On-premise) 추가를 능가합니다.
아시아태평양은 2025-2030년의 CAGR이 21.30%로 가장 급속히 확대되고 있는 지역입니다. 중국에서는 태양광 발전과 축전지의 급속한 보급이, 인도에서는 농촌의 전기 프로젝트가 애널리틱스가 해방할 수 있는 대규모 데이터 과제를 만들어 냈습니다. 일본과 호주의 기존 기업은 고객 참여와 DER 오케스트레이션을 중시하고 있지만, 신흥국은 기존의 디스패치 시스템을 뛰어넘어 처음부터 스마트 그리드 기술을 도입하고 있습니다. 정부가 지원하는 스마트 시티 구상은 교통, 환경 센서, 마이크로그리드 등의 데이터 스트림을 추가하고 유틸리티 기업의 데이터 세트와 융합시킴으로써 분석 플랫폼의 범위를 확대하고 있습니다.
유럽에서는 야심적인 탈탄소화 의무로 전력회사가 변동하는 재생가능에너지의 통합과 히트펌프와 전기자동차 등의 전동화 수요를 최적화하기 위해 많은 지출이 계속되고 있습니다. 엄격한 사이버 보안 규정과 GDPR(EU 개인정보보호규정) 준수는 데이터 주권 요구 사항을 높여 아키텍처 옵션을 지역 클라우드 영역과 현지화된 데이터 호수로 향하고 있습니다. 유럽 위원회의 국경을 넘어 시장 결합의 추진은 회원국 간의 스케줄링, 혼잡 관리, 에너지 불균형 결제를 조정하는 분석에 대한 수요를 자극합니다. 북유럽 사업자는 배전 수준의 용량이 거의 실시간으로 거래되는 첨단 유연성 시장을 선보이고 있으며, 고해상도 원격 측정과 AI 기반 디스패치 엔진이 필요합니다.
기타 혜택 :
- 엑셀 형식 시장 예측(ME) 시트
- 3개월간의 애널리스트 서포트
목차
제1장 서론
- 조사의 전제조건과 시장의 정의
- 조사 범위
제2장 조사 방법
제3장 주요 요약
제4장 시장 상황
- 시장 개요
- 시장 성장 촉진요인
- 재생에너지의 의무화와 탈탄소화에의 지출
- AMI 2.0의 전개와 엣지 분석의 도입
- 도매 가격 변동성으로 인한 부하 예측 정확도
- 클라우드 네이티브 유틸리티 분석 프레임워크
- EU/미국 사이버 레지리언스 컴플라이언스 요건
- 시장 성장 억제요인
- 기존의 OT-IT 통합 비용과 데이터 사일로
- 전력 분야에서의 데이터 사이언스 인력 부족
- 사이버 보안 및 데이터 주권에 대한 우려
- 디지털 예산을 제한하는 요금 사례 조사
- 가치/공급망 분석
- 규제 상황
- 기술의 전망
- Porter's Five Forces 분석
- 공급기업의 협상력
- 구매자의 협상력
- 신규 참가업체의 위협
- 대체품의 위협
- 경쟁 기업간 경쟁 관계
제5장 시장 규모와 성장 예측
- 전개별
- On-Premise
- 클라우드
- 하이브리드
- 구성요소별
- 소프트웨어
- 서비스
- 하드웨어/엣지 디바이스
- 용도별
- 미터 조작 및 데이터 관리
- 부하와 발전의 예측
- 수요 반응과 유연성
- 유통계획과 최적화
- 자산 성능 관리
- 정전 관리와 신뢰성
- 유틸리티 유형별
- 전기
- 가스
- 물
- 다기능
- 최종 사용자별
- 발전설비
- 송배전 사업자
- 소매 에너지 공급업체
- 독립 발전 사업자
- 지역별
- 북미
- 미국
- 캐나다
- 멕시코
- 남미
- 브라질
- 아르헨티나
- 기타 남미
- 유럽
- 영국
- 독일
- 프랑스
- 이탈리아
- 스페인
- 북유럽 국가
- 러시아
- 기타 유럽
- 아시아태평양
- 중국
- 일본
- 인도
- 한국
- 호주 및 뉴질랜드
- ASEAN
- 기타 아시아태평양
- 중동 및 아프리카
- 중동
- 사우디아라비아
- 아랍에미리트(UAE)
- 이스라엘
- 튀르키예
- 기타 중동
- 아프리카
- 남아프리카
- 이집트
- 나이지리아
- 기타 아프리카
- 북미
제6장 경쟁 구도
- 시장 집중도
- 전략적 움직임과 자금조달
- 시장 점유율 분석
- 기업 프로파일
- Oracle Corporation
- IBM Corporation
- Siemens AG
- Schneider Electric SE
- ABB Ltd
- General Electric Company
- SAS Institute Inc.
- SAP SE
- Capgemini SE
- Teradata Corporation
- Hitachi Energy Ltd.
- Landis Gyr AG
- Itron Inc.
- AutoGrid Systems Inc.
- Wipro Ltd.
- Accenture plc
- Amazon Web Services(AWS) Utilities
- Microsoft Azure Energy
- Enel X
- Nexant Inc.
- OSIsoft(AVEVA)
- Uptake Technologies
- Bidgely Inc.
- Smarter Grid Solutions
제7장 시장 기회와 장래의 전망
SHW 25.11.17The utility and energy analytics market size stands at USD 5.1 billion in 2025 and is forecast to reach USD 11.48 billion by 2030, registering a 17.68% CAGR.
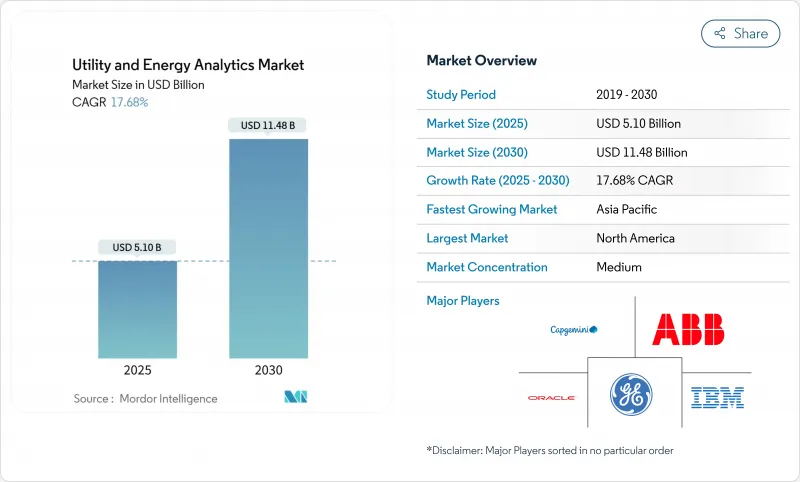
Growth is fuelled by rising electrification, sharper decarbonisation targets and the need to optimise increasingly complex grids. More than 55% of utilities now apply near-real-time analytics to monitor grid assets and customer usage, while a projected five-fold jump in electricity load-from 23 GW in 2025 to 128 GW in 2030-keeps pressure on operators to modernise data infrastructure and decision-making processes. Intensifying wholesale-price volatility accelerated smart-meter rollouts and widening cloud adoption further widen the addressable space for advanced solutions. Competitive intensity is rising as hyperscale cloud firms court utilities with industry-specific AI services, even as traditional operational-technology vendors deepen their analytics portfolios through acquisitions and partnerships.
Global Utility And Energy Analytics Market Trends and Insights
Mandatory Renewable Mandates & Decarbonisation Spend
Global commitments to cut carbon emissions are accelerating investment in sophisticated forecasting and optimisation tools. Renewables are projected to generate one-third of global electricity by early 2025, placing unprecedented variability on grids. Government incentives amplify the trend; the U.S. Department of Energy estimates that aggregated virtual power plants could supply 10-20% of peak demand by 2030, provided utilities can orchestrate distributed resources in real time. These developments compel operators to deploy analytics platforms capable of processing high-frequency telemetry, modelling weather-driven output swings and optimising bid strategies across day-ahead and intra-day markets.
AMI 2.0 Roll-out & Edge Analytics Adoption
Next-generation smart-meter projects create continuous data streams that outstrip legacy processing tools. Global smart-meter revenues are projected to climb from USD 26.65 billion in 2024 to USD 29.29 billion in 2025, producing granular interval data that utilities can analyse at the edge. Thames Water's network already detects more than 80,000 leaks daily and avoids 57 million litres of water losses by embedding analytics inside meters. Running algorithms locally minimises latency, reduces back-haul bandwidth and enables distribution operators to trigger rapid voltage or pressure adjustments, reinforcing grid resilience while containing costs.
Legacy OT-IT Integration Costs & Data Silos
Many utilities still run decades-old SCADA, outage and billing systems that were never designed to interconnect. Integrating these assets with cloud gateways and modern data-lakes often doubles or triples the original analytics budget, delaying project timelines. Forward-thinking operators are standardising data models, deploying API gateways and sequencing upgrades to contain spend while laying an open architecture foundation for future analytics layers.
Other drivers and restraints analyzed in the detailed report include:
- Wholesale-Price Volatility Driving Load-Forecast Accuracy
- Cloud-Native Utility-Analytics Frameworks
- Data-Science Talent Shortage in Power Domain
For complete list of drivers and restraints, kindly check the Table Of Contents.
Segment Analysis
Cloud platforms captured 41% of incremental spend in 2025, yet the on-premises model retained 59% utility and energy analytics market share due to strict compliance requirements. Operators historically kept mission-critical apps within firewalls; however, elastic compute, managed AI services and pay-as-you-go economics are shifting cost-benefit equations. The utility and energy analytics market size for cloud deployments is expected to grow at 24.10% CAGR to 2030, driven by greenfield AMI, demand-response and DERMS rollouts that need horizontally scalable architectures. IBM's sector-focused Software-as-a-Service suite illustrates rising vendor emphasis on hardened, audit-ready environments with grid-specific templates. Hybrid strategies are common: sensitive operational datasets remain in data centres while prediction pipelines and customer-facing dashboards run in the cloud, allowing utilities to stage migration while mitigating sovereignty concerns.
Alongside resilience, utilities value the cloud's rapid innovation cycle. New features-geospatial visualisation, what-if dispatch simulators or customer self-service portals-can be deployed without lengthy hardware refreshes. Providers publish utilities-specific compliance roadmaps, helping risk officers secure board approvals. As confidence rises, transmission operators are piloting cloud-native historian replacements, targeting 50% lower total cost of ownership over a five-year horizon.
Software licences still accounted for 69% of 2024 revenues, reflecting entrenched reliance on vendor-supplied meter-data management, outage analytics and forecasting tools. Yet services revenue is accelerating at 20.80% CAGR, signalling utilities' need for integration support, data-quality remediation and continuous model tuning. Field evidence shows professional-services outlays can equal software spend during multiyear deployments, especially where legacy supervisory control and data acquisition platforms require middleware adaptors. Cognizant's 6.8% year-over-year revenue uptick in Q4 2024, partly propelled by utility analytics mandates, underlines the shift toward value-added engagements.
Edge-hardware uptake is also climbing as utilities deploy substation phasor-measurement units and feeder-level sensors. These devices preprocess high-volume waveforms, forwarding only event-based summaries to central repositories. Edge enables near-instant fault localisation and voltage-control actions, extending equipment life and improving power quality.
Utility and Energy Analytics Market Segmented by Deployment (On-Premises, Cloud and Hybrid), Component (Software, Services and More), Application (Meter Operations and Data Management, Load and Generation Forecasting and More), End-User (Generation Utilities, Transmission and Distribution Operators and More) Utility Type (Electric, Gas and More), and Geography. The Market Forecasts are Provided in Terms of Value (USD).
Geography Analysis
North America retained a 38% revenue share in 2024, backed by mature digital infrastructure, AMI penetration above 70% and supportive regulatory constructs that reward performance-based ratemaking. State-level resilience programmes channel funds toward outage analytics, vegetation-encroachment modelling and wildfire-risk scoring. Texas exemplifies demand growth, with flexible-load consumption set to reach 54 billion kWh in 2025, forcing utilities to refine load-forecast accuracy and bolster grid automation. Cloud deployments outpace on-premises adds as utilities capitalise on elastic compute to process high-frequency meter reads and substation waveforms.
Asia-Pacific represents the fastest expanding pocket with a 21.30% CAGR for 2025-2030. China's rapid solar and storage build-out and India's rural electrification projects create large-scale data challenges that analytics can unlock. Established players in Japan and Australia emphasise customer engagement and DER orchestration, whereas emerging economies leapfrog legacy dispatch systems, installing smart-grid technologies from the outset. Government-backed smart-city initiatives pile on additional data streams-traffic, environmental sensors and microgrids-that converge with utility datasets, increasing analytics platform scope.
Europe sustains significant spend as ambitious decarbonisation obligations drive utilities to optimise variable renewable integration and electrified demand such as heat pumps and EVs. Tight cyber-security rules and GDPR compliance elevate data-sovereignty requirements, shaping architecture choices toward regional cloud zones and localised data-lakes. The European Commission's push for cross-border market coupling stimulates demand for analytics that align scheduling, congestion management and energy imbalance settlements across member states. Nordic operators showcase advanced flexibility markets where distribution-level capacity trades in near-real time, necessitating high-resolution telemetry and AI-based dispatch engines.
- Oracle Corporation
- IBM Corporation
- Siemens AG
- Schneider Electric SE
- ABB Ltd
- General Electric Company
- SAS Institute Inc.
- SAP SE
- Capgemini SE
- Teradata Corporation
- Hitachi Energy Ltd.
- Landis+Gyr AG
- Itron Inc.
- AutoGrid Systems Inc.
- Wipro Ltd.
- Accenture plc
- Amazon Web Services (AWS) Utilities
- Microsoft Azure Energy
- Enel X
- Nexant Inc.
- OSIsoft (AVEVA)
- Uptake Technologies
- Bidgely Inc.
- Smarter Grid Solutions
Additional Benefits:
- The market estimate (ME) sheet in Excel format
- 3 months of analyst support
TABLE OF CONTENTS
1 INTRODUCTION
- 1.1 Study Assumptions and Market Definition
- 1.2 Scope of the Study
2 RESEARCH METHODOLOGY
3 EXECUTIVE SUMMARY
4 MARKET LANDSCAPE
- 4.1 Market Overview
- 4.2 Market Drivers
- 4.2.1 Mandatory renewable mandates and decarbonisation spend
- 4.2.2 AMI 2.0 roll-out and edge analytics adoption
- 4.2.3 Wholesale-price volatility driving load-forecast accuracy
- 4.2.4 Cloud-native utility-analytics frameworks
- 4.2.5 EU/US cyber-resilience compliance requirements
- 4.3 Market Restraints
- 4.3.1 Legacy OT-IT integration costs and data silos
- 4.3.2 Data-science talent shortage in power domain
- 4.3.3 Cyber-security and data-sovereignty concerns
- 4.3.4 Rate-case scrutiny limiting digital budgets
- 4.4 Value / Supply-Chain Analysis
- 4.5 Regulatory Landscape
- 4.6 Technological Outlook
- 4.7 Porter's Five Forces Analysis
- 4.7.1 Bargaining Power of Suppliers
- 4.7.2 Bargaining Power of Buyers
- 4.7.3 Threat of New Entrants
- 4.7.4 Threat of Substitute Products
- 4.7.5 Intensity of Competitive Rivalry
5 MARKET SIZE AND GROWTH FORECASTS (VALUE)
- 5.1 By Deployment
- 5.1.1 On-premise
- 5.1.2 Cloud
- 5.1.3 Hybrid
- 5.2 By Component
- 5.2.1 Software
- 5.2.2 Services
- 5.2.3 Hardware / Edge Devices
- 5.3 By Application
- 5.3.1 Meter Operations and Data Management
- 5.3.2 Load and Generation Forecasting
- 5.3.3 Demand Response and Flexibility
- 5.3.4 Distribution Planning and Optimisation
- 5.3.5 Asset Performance Management
- 5.3.6 Outage Management and Reliability
- 5.4 By Utility Type
- 5.4.1 Electric
- 5.4.2 Gas
- 5.4.3 Water
- 5.4.4 Multi-utility
- 5.5 By End-user
- 5.5.1 Generation Utilities
- 5.5.2 Transmission and Distribution Operators
- 5.5.3 Retail Energy Suppliers
- 5.5.4 Independent Power Producers
- 5.6 By Geography
- 5.6.1 North America
- 5.6.1.1 United States
- 5.6.1.2 Canada
- 5.6.1.3 Mexico
- 5.6.2 South America
- 5.6.2.1 Brazil
- 5.6.2.2 Argentina
- 5.6.2.3 Rest of South America
- 5.6.3 Europe
- 5.6.3.1 United Kingdom
- 5.6.3.2 Germany
- 5.6.3.3 France
- 5.6.3.4 Italy
- 5.6.3.5 Spain
- 5.6.3.6 Nordics
- 5.6.3.7 Russia
- 5.6.3.8 Rest of Europe
- 5.6.4 Asia-Pacific
- 5.6.4.1 China
- 5.6.4.2 Japan
- 5.6.4.3 India
- 5.6.4.4 South Korea
- 5.6.4.5 Australia and New Zealand
- 5.6.4.6 ASEAN
- 5.6.4.7 Rest of Asia-Pacific
- 5.6.5 Middle East and Africa
- 5.6.5.1 Middle East
- 5.6.5.1.1 Saudi Arabia
- 5.6.5.1.2 United Arab Emirates
- 5.6.5.1.3 Israel
- 5.6.5.1.4 Turkey
- 5.6.5.1.5 Rest of Middle East
- 5.6.5.2 Africa
- 5.6.5.2.1 South Africa
- 5.6.5.2.2 Egypt
- 5.6.5.2.3 Nigeria
- 5.6.5.2.4 Rest of Africa
- 5.6.1 North America
6 COMPETITIVE LANDSCAPE
- 6.1 Market Concentration
- 6.2 Strategic Moves and Funding
- 6.3 Market Share Analysis
- 6.4 Company Profiles (includes Global level Overview, Market level overview, Core Segments, Financials as available, Strategic Information, Market Rank/Share for key companies, Products and Services, and Recent Developments)
- 6.4.1 Oracle Corporation
- 6.4.2 IBM Corporation
- 6.4.3 Siemens AG
- 6.4.4 Schneider Electric SE
- 6.4.5 ABB Ltd
- 6.4.6 General Electric Company
- 6.4.7 SAS Institute Inc.
- 6.4.8 SAP SE
- 6.4.9 Capgemini SE
- 6.4.10 Teradata Corporation
- 6.4.11 Hitachi Energy Ltd.
- 6.4.12 Landis+Gyr AG
- 6.4.13 Itron Inc.
- 6.4.14 AutoGrid Systems Inc.
- 6.4.15 Wipro Ltd.
- 6.4.16 Accenture plc
- 6.4.17 Amazon Web Services (AWS) Utilities
- 6.4.18 Microsoft Azure Energy
- 6.4.19 Enel X
- 6.4.20 Nexant Inc.
- 6.4.21 OSIsoft (AVEVA)
- 6.4.22 Uptake Technologies
- 6.4.23 Bidgely Inc.
- 6.4.24 Smarter Grid Solutions
7 MARKET OPPORTUNITIES AND FUTURE OUTLOOK
- 7.1 White-space and Unmet-need Assessment
- 7.2 AI-driven predictive maintenance for DER-rich grids
- 7.3 Grid-edge analytics marketplaces
- 7.4 Green hydrogen and storage optimisation analytics


