|
시장보고서
상품코드
1629796
데이터 시각화 : 시장 점유율 분석, 산업 동향, 통계, 성장 예측(2025-2030년)Data Visualization - Market Share Analysis, Industry Trends & Statistics, Growth Forecasts (2025 - 2030) |
||||||
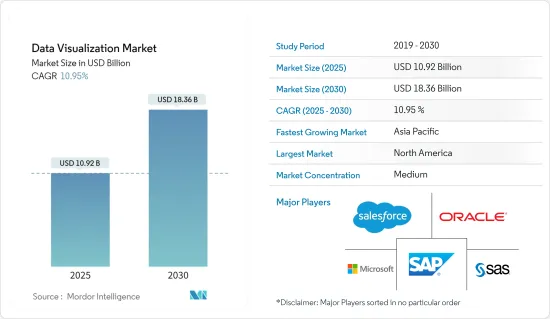
데이터 시각화 시장 규모는 2025년 109억 2,000만 달러로 추정되며, 예측 기간(2025-2030년) 동안 10.95%의 연평균 복합 성장률(CAGR)로 성장을 지속하여 2030년에는 183억 6,000만 달러에 달할 것으로 예상됩니다.
데이터 시각화의 새로운 특성은 분석 중심의 비즈니스로의 전환을 촉진하고, 사용자는 처음에는 표 형식으로만 제공되던 데이터를 다양한 형태의 그래프 표현으로 탐색할 수 있게 됩니다.
주요 하이라이트
- 많은 산업 분야에서 기업들은 데이터 기반 의사결정의 이점을 실감하고 있습니다. 방대하고 복잡한 데이터베이스에서 유용한 정보를 추출하는 것이 점점 더 중요해지고 있습니다. 데이터 시각화는 복잡한 정보를 이해하기 쉽고 분석하기 쉬운 시각적으로 매력적인 방식으로 표현하는 데 필수적입니다. 기업들이 데이터에서 가치 있는 인사이트를 도출하는 방법을 모색함에 따라 데이터 시각화 도구 시장은 계속 확대될 것으로 보입니다. 의사결정자들은 데이터를 효율적으로 시각화함으로써 패턴, 트렌드, 상관관계를 찾아내어 보다 나은 정보에 입각한 전략적 의사결정을 내릴 수 있게 됩니다.
- "증강현실"이라는 용어는 시각화와 같은 디지털 데이터를 물리적 환경에 겹쳐서 보여주는 기술을 의미합니다. 증강현실(AR)은 데이터 시각화 도구에 증강현실(AR)을 통합하는 것으로, 현실 세계의 사물이나 환경에 데이터 시각화를 겹쳐서 소비자에게 새로운 방식으로 데이터를 탐색하고 분석할 수 있는 몰입감 있고 매력적인 경험을 제공할 수 있습니다. 이 기술은 제조, 의료, 소매 등 여러 분야에서 사용될 수 있으며, 지리적 맥락에서 실시간 데이터 시각화를 통해 판단, 교육, 소비자 상호작용을 개선할 수 있습니다.
- 자연어 처리와 대화형 인터페이스의 조합은 데이터 시각화의 또 다른 특징적인 시장 성장 촉진요인입니다. 자연어 처리를 통해 컴퓨터가 인간의 언어를 이해하고, 번역하고, 생성할 수 있기 때문에 사용자는 자연어 지시와 쿼리를 사용하여 데이터 시각화 도구와 소통할 수 있습니다. 시스템과의 상호 작용을 통해 사용자는 질문을 하고, 특정 시각화를 요청하고, NLP를 활용하여 데이터를 조사할 수 있습니다. 기존의 그래픽 사용자 인터페이스에 비해 학습 곡선이 낮기 때문에 더 많은 사람들이 데이터 시각화에 친숙하게 다가갈 수 있습니다. 또한, 스마트 스피커나 가상 비서 같은 음성 지원 가젯을 통해 데이터 기반 의사결정을 내릴 수 있는 가능성도 생깁니다.
- 데이터의 프라이버시와 보안은 생성 및 분석되는 데이터의 양이 계속 증가함에 따라 큰 관심사가 되고 있습니다. 조직과 개인은 데이터 침해 및 기밀 정보에 대한 무단 액세스와 관련된 잠재적 위험에 대한 인식이 높아졌습니다는 추론이 있습니다. 이러한 인식 증가는 유럽연합(EU)의 일반 데이터 보호 규정(GDPR(EU 개인정보보호규정)(EU 개인정보보호규정))과 미국 캘리포니아주 소비자 프라이버시법(CCPA)과 같은 규제 강화로 이어지고 있습니다. 이러한 규제는 조직이 개인 데이터를 수집, 저장, 처리하는 방식에 제한을 가하고 있습니다.
- 코로나19는 전례 없는 도전을 가져왔고, 조직은 위기 관리와 비즈니스 연속성에 집중해야 했습니다. 데이터 시각화는 기업이 주요 지표를 모니터링하고, 잠재적 위험을 식별하고, 전염병의 영향을 완화하기 위한 전략을 수립하는 데 중요한 역할을 했습니다. 시각화를 통해 기업은 공급망 중단을 추적하고, 고객 행동 변화를 분석하며, 비즈니스 재무 상태를 모니터링할 수 있었습니다. 이러한 중요한 통찰력을 시각화함으로써 조직은 위기에 보다 효과적으로 대응하고 비즈니스 연속성을 보장하기 위해 업무를 조정할 수 있었습니다. 또한, 러시아-우크라이나 전쟁이 전체 패키징 생태계에 미친 영향도 있습니다.
데이터 시각화 시장 동향
소매 부문이 큰 폭의 성장세를 기록합니다.
- 데이터 시각화를 통해 소매업체는 고객의 행동, 선호도 및 구매 패턴에 대한 더 깊은 통찰력을 얻을 수 있게 되었습니다. 고객 데이터를 시각화함으로써 소매업체는 트렌드를 파악하고, 고객 세분화를 이해하고, 마케팅 전략을 개인화할 수 있습니다. 데이터를 시각적으로 표현함으로써 소매업체는 데이터에 기반한 의사결정을 내리고, 재고 관리를 최적화하고, 고객 수요에 맞는 상품을 제공할 수 있습니다. 이러한 고객 분석의 개선은 보다 타겟팅된 마케팅 캠페인, 더 나은 고객 경험, 매출 증가로 이어지고 있습니다.
- 데이터 시각화는 소매업체공급망 관리를 강화하는 데 중요한 역할을 합니다. 재고 수준, 물류, 주문 처리와 같은 공급망 데이터를 시각화함으로써 소매업체는 병목 현상을 파악하고, 프로세스를 최적화하며, 전반적인 효율성을 향상시킬 수 있습니다. 공급망 데이터에 대한 실시간 가시성을 통해 소매업체는 재고 이동을 추적하고, 상품 공급을 모니터링하고, 잠재적인 혼란을 파악할 수 있습니다. 이는 재고 관리 개선, 품절 감소, 예측 정확도 향상으로 이어집니다.
- 데이터 시각화 툴을 통해 소매업체는 판매 실적을 실시간으로 모니터링할 수 있습니다. 대화형 대시보드를 통해 판매 수익, 전환율, 평균 거래액 등 주요 성과지표(KPI)를 추적할 수 있습니다. 판매 데이터에 대한 실시간 가시성을 통해 소매업체는 판매 동향을 파악하고, 가격 책정 및 프로모션을 적시에 조정하고, 문제나 기회가 발생했을 때 대응할 수 있습니다. 이를 통해 소매업체는 경쟁 시장에서 민첩하게 대응하고 판매 실적을 향상시킬 수 있습니다.
- 데이터 시각화를 통해 소매업체는 개인의 취향과 행동을 이해함으로써 개인화된 고객 경험을 창출할 수 있습니다. 소매업체는 구매 내역, 검색 패턴, 인구통계학적 정보와 같은 고객 데이터를 시각화하여 타겟팅된 추천, 개인화된 제안, 맞춤형 마케팅 캠페인을 제공할 수 있습니다. 데이터 기반 개인화는 고객 만족도를 높이고, 충성도를 높이며, 재구매를 유도할 수 있습니다.
북미가 가장 큰 시장 점유율을 차지합니다.
- 북미는 이 지역의 최종 사용자 산업에서 첨단 기술 채택이 확대되고 있기 때문에 북미가 두드러진 시장으로 부상하고 있습니다. 또한, 이 지역은 탄탄한 벤더 기반을 갖추고 있어 시장 성장에 기여하고 있습니다. 북미의 데이터 시각화 용도는 빅데이터 증가와 소매 업계의 분석 필요성 등의 요인에 의해 주도되고 있습니다.
- 미국 데이터 시각화 시장은 중소기업에서 생성되는 데이터 양 증가로 인해 건전한 성장세를 보이고 있습니다. 예를 들어, IBM Corporation에 따르면 매일 25억 바이트의 데이터가 디지털 정보 플랫폼에서 생성되고 있으며, 매일 2.5억 바이트의 데이터가 생성되고 있다고 합니다.
- 2021년 7월 미국 해안경비대는 코로나19 데이터 시각화 도구를 도입하여 백신 배포부터 작전 준비태세까지 지휘관이 정보에 입각한 의사결정을 내릴 수 있도록 지원하며, 새로운 기술이 경비원들의 프라이버시와 보안을 해치지 않도록 예방 조치를 취했습니다. 이 프로그램은 상황 인식과 전망을 가르치는 것을 목표로하며 개인에게 직접적인 영향을 미치지 않아야합니다.
- 캐나다 시장에서도 다양한 분야에서 데이터 기반 의사결정 도입이 증가하고 있습니다. 클라우드 비즈니스 관리 솔루션 업체인 Sage는 2021년 3월 미국과 캐나다 시장에서 Sage 300과 Sage 100을 위한 클라우드 최초의 Sage Data and Analytics 서비스 통합을 시작했습니다. 비즈니스 인텔리전스 툴킷은 AI와 머신러닝 알고리즘의 도움으로 사용자에게 실시간 영업 대시보드와 상세한 손익계산서를 제공할 수 있습니다. 이러한 기술 혁신은 조사 대상 시장을 주도할 것으로 예상됩니다.
- 북미는 기술 기반 솔루션의 중요한 시장이기 때문에 다양한 소스의 데이터를 추적하고 다양한 데이터 표현으로 통합하여 중요한 비즈니스 의사결정을 내릴 필요성이 증가하고 있습니다.
데이터 시각화 산업의 개요
데이터 시각화 시장은 경쟁이 치열합니다. 이 시장의 기업들은 시장에서의 입지와 고객 기반을 확대하기 위해 전략적 솔루션을 제공함으로써 혁신을 꾀하고 있습니다. 이를 통해 새로운 계약을 체결하고 새로운 시장을 개척할 수 있습니다.
- 2023년 4월 - Jira 및 Confluence용 커스텀 차트(Custom Charts for Jira 및 Custom Charts for Confluence) 용도으로 유명한 Atlassian 마켓플레이스 파트너인 Amovos SRO는 Jira 및 Confluence를 간소화하는 제품 개발 조직을 위한 포트폴리오 관리 솔루션 제공업체인 Tempo Software가 Amovos SRO를 인수하기로 합의했습니다. 이번 인수를 통해 Tempo의 Atlassian 기반 제품군은 사용하기 쉽고 사용자 정의 가능한 Jira 데이터 시각화를 통해 성장하고, 팀원들이 복잡한 기업 보고 도구에 신경 쓰지 않고 신속하게 작업을 완료하는 데 집중할 수 있도록 지원할 예정입니다.
- 2022년 9월: Grafana를 Azure 클라우드 플랫폼과 네이티브하게 호환되도록 하기 위해 Microsoft와 Grafana Labs는 전략적 계약을 체결했습니다. 새로운 Azure Managed Grafana 서비스가 네이티브 연결을 제공하는 두 가지 클라우드 서비스에 불과하며, Microsoft의 Azure Managed Grafana 버전 9.0에는 IT 관리자에게 잠재적인 기술적 어려움을 알리는 더 나은 경고 기능이 포함되어 있습니다. 기능이 포함되어 있습니다. 영역 이중화 및 API 키에 대한 지원도 이번 버전에 포함됐습니다.
기타 혜택 :
- 엑셀 형식 시장 예측(ME) 시트
- 3개월간의 애널리스트 지원
목차
제1장 서론
- 조사 성과
- 조사 전제
- 조사 범위
제2장 조사 방법
제3장 주요 요약
제4장 시장 역학
- 시장 개요
- 업계의 매력 - Porter의 Five Forces 분석
- 신규 진출업체의 위협
- 구매자/소비자의 교섭력
- 공급 기업의 교섭력
- 대체품의 위협
- 경쟁 기업간 경쟁 관계
- 밸류체인 분석
- 시장 성장 촉진요인과 시장 성장 억제요인 서론
- 시장 성장 촉진요인
- 시장 성장 억제요인
제5장 기술 로드맵
제6장 시장 세분화
- 조직 부문별
- 경영 임원
- 마케팅
- 오퍼레이션
- 재무
- 영업 부문
- 기타 조직 부문
- 전개 형태별
- 온프레미스
- 클라우드/온디맨드
- 최종사용자별
- 은행/금융서비스/보험(BFSI)
- IT 및 통신
- 소매/E-Commerce
- 교육
- 제조업
- 정부기관
- 기타 최종사용자
- 지역별
- 북미
- 유럽
- 아시아태평양
- 라틴아메리카
- 중동 및 아프리카
제7장 경쟁 구도
- 기업 개요
- Salesforce.com Inc.(Tableau Software Inc.)
- SAP SE
- SAS Institute Inc.
- Microsoft Corporation
- Oracle Corporation
- TIBCO Software Inc.
- IBM Corporation
- Information Builders
- Dundas Data Visualization Inc.
- Pentaho Corporation
- InetSoft Technology Corporation
- MicroStrategy Inc.
제8장 투자 분석
제9장 시장 기회와 향후 동향
LSH 25.01.22
The Data Visualization Market size is estimated at USD 10.92 billion in 2025, and is expected to reach USD 18.36 billion by 2030, at a CAGR of 10.95% during the forecast period (2025-2030).

The emerging nature of data visualization encourages a shift toward analytically driven businesses, where users can explore data in various forms of graphical representation, initially only available in tabular reports.
Key Highlights
- Across many industries, businesses are realizing the benefits of data-driven decision-making. Extracting useful information from big, complicated databases is becoming increasingly important. Data visualization is essential for demystifying complex information and presenting it in a visually appealing manner that is simple to comprehend and analyze. As companies look for ways to extract valuable insights from their data, inference implies that the market for data visualization tools will keep growing. Decision-makers may find patterns, trends, and correlations by efficiently visualizing data, which helps them make more well-informed strategic decisions.
- The term "augmented reality" refers to a technology that overlays digital data, such as visualizations, on the physical environment. A new development that has the potential to change the market completely is the incorporation of AR with data visualization tools. AR can give consumers an immersive and engaging experience that enables them to explore and analyze data in novel ways by superimposing data visualizations onto real-world objects or environments. This technology can be used in several fields, including manufacturing, healthcare, and retail, where real-time data visualization in a geographical context can improve judgment, training, and consumer interaction.
- The combination of natural language processing and conversational interfaces is another distinctive market driver for data visualization. NLP enables computers to comprehend, translate, and produce human language, allowing users to communicate with data visualization tools using natural language instructions or queries. Through dialogues with the system, users can ask questions, request certain visualizations, or examine data by utilizing NLP. Due to its lower learning curve than conventional graphical user interfaces, this driver may make data visualization more approachable to a wider audience. Additionally, it creates possibilities for data-driven decision-making via voice-enabled gadgets like smart speakers and virtual assistants.
- Data privacy and security have become major concerns as the volume of data being generated and analyzed continues to increase. Inference suggests that organizations and individuals are becoming more aware of the potential risks associated with data breaches and unauthorized access to sensitive information. This heightened awareness has led to stricter regulations, such as the General Data Protection Regulation (GDPR) in the European Union and the California Consumer Privacy Act (CCPA) in the United States. These regulations impose limitations on how organizations collect, store, and process personal data.
- COVID-19 brought about unprecedented challenges, requiring organizations to focus on crisis management and business continuity. Data visualization played a vital role in helping businesses monitor key metrics, identify potential risks, and develop strategies to mitigate the impact of the pandemic. Visualizations enabled organizations to track supply chain disruptions, analyze customer behavior shifts, and monitor the financial health of their businesses. By visualizing these critical insights, organizations could respond more effectively to the crisis and adapt their operations to ensure business continuity. There has also been an impact of the Russia-Ukraine war on the overall packaging ecosystem.
Data Visualization Market Trends
Retail Segment to Witness Significant Growth
- Data visualization has enabled retailers to gain deeper insights into customer behavior, preferences, and purchasing patterns. By visualizing customer data, retailers can identify trends, understand customer segmentation, and personalize their marketing strategies. Visual representations of data help retailers make data-driven decisions, optimize inventory management, and tailor their product offerings to meet customer demands. This improved customer analytics has resulted in more targeted marketing campaigns, better customer experiences, and increased sales.
- Data visualization plays a crucial role in enhancing supply chain management for retailers. By visualizing supply chain data, including inventory levels, logistics, and order fulfillment, retailers can identify bottlenecks, optimize processes, and improve overall efficiency. Real-time visualization of supply chain data enables retailers to track inventory movement, monitor product availability, and identify potential disruptions. This leads to improved inventory management, reduced stockouts, and better forecasting accuracy.
- With the help of data visualization tools, retailers can monitor sales performance in real time. Through interactive dashboards, they can track key performance indicators (KPIs), such as sales revenue, conversion rates, and average transaction value. Real-time visualization of sales data enables retailers to identify sales trends, make timely adjustments to pricing and promotions, and address issues or opportunities as they arise. This helps retailers stay agile and responsive in a competitive market, improving sales performance.
- Data visualization empowers retailers to create personalized customer experiences by understanding individual preferences and behavior. Retailers can deliver targeted recommendations, personalized offers, and customized marketing campaigns by visualizing customer data, such as purchase history, browsing patterns, and demographic information. Data-driven personalization enhances customer satisfaction, increases loyalty, and drives repeat purchases.
North America to Hold Largest Market Share
- North America is a prominent market owing to the growing adoption of advanced technologies by end-user industries across the region. Moreover, the area has a strong foothold of vendors, contributing to the market's growth. Data visualization applications in North America are driven by factors such as growth in big data and the need for analytics in the retail sector.
- The United States data visualization market is witnessing healthy growth due to the increasing amount of data generated in small- and medium-scale firms. For instance, a massive amount of data is being developed on digital information platforms every day. According to IBM Corporation, 2.5 quintillion bytes of data are generated daily.
- In July 2021, the United States Coast Guard adopted COVID-19 data visualization tools to assist commanders in making informed decisions on everything from vaccine distribution to operational readiness and has taken precautions to guarantee that the new technologies do not compromise guardsmen's privacy and security. The program aims to teach situational awareness and perspective, and it should not directly impact individuals.
- The implementation of data-driven decision-making is also rising in Canadian markets across various sectors. Cloud business management solutions vendor Sage launched its cloud-first Sage Data and Analytics service integration for Sage 300 and Sage 100 in the US and Canadian markets in March 2021. Its business intelligence toolkit can provide users with live sales dashboards and detailed P&L reports with the help of AI and machine learning algorithms. Such innovations are expected to drive the studied market.
- An increasing need to track data from various sources and compile it into different data representations to make critical business decisions can be observed in North America, as this region is a significant market for technology-based solutions.
Data Visualization Industry Overview
The data visualization market is moderately competitive. The players in the market are innovating in providing strategic solutions to increase their market presence and customer base. This enables them to secure new contracts and tap new markets.
- April 2023 - Amovos SRO, an Atlassian Marketplace Partner that simplifies Jira and Confluence with its well-known Custom Charts for Jira and Custom Charts for Confluence apps, had agreed to be acquired by Tempo Software, a leading provider of portfolio management solutions for product development organizations. With Jira data visualizations that are simple to use and customizable thanks to the purchase, Tempo's Atlassian-based product suite will grow, allowing teams to concentrate on finishing tasks swiftly rather than fumbling with cumbersome corporate reporting tools.
- September 2022: To make Grafana natively compatible with the Azure cloud platform, Microsoft and Grafana Labs established a strategic agreement. Azure Monitor and Azure Data Explorer are just two cloud services that Microsoft's new Azure Managed Grafana service offers native connections. Version 9.0 of Microsoft's Azure Managed Grafana includes a better alerting feature to inform IT administrators of potential technical difficulties. Zone redundancy and support for an API key are also included in this edition.
Additional Benefits:
- The market estimate (ME) sheet in Excel format
- 3 months of analyst support
TABLE OF CONTENTS
1 INTRODUCTION
- 1.1 Study Deliverables
- 1.2 Study Assumptions
- 1.3 Scope of the Study
2 RESEARCH METHODOLOGY
3 EXECUTIVE SUMMARY
4 MARKET DYNAMICS
- 4.1 Market Overview
- 4.2 Industry Attractiveness - Porter's Five Forces Analysis
- 4.2.1 Threat of New Entrants
- 4.2.2 Bargaining Power of Buyers/Consumers
- 4.2.3 Bargaining Power of Suppliers
- 4.2.4 Threat of Substitute Products
- 4.2.5 Intensity of Competitive Rivalry
- 4.3 Value Chain Analysis
- 4.4 Introduction to Market Drivers and Restraints
- 4.5 Market Drivers
- 4.5.1 Cloud Deployment of Data Visualization Solutions
- 4.5.2 Increasing Need for Quick Decision Making
- 4.6 Market Restraints
- 4.6.1 Lack of Tech Savvy and Skilled Workforce/Inability
5 TECHNOLOGY ROADMAP
6 MARKET SEGMENTATION
- 6.1 Organizational Department
- 6.1.1 Executive Management
- 6.1.2 Marketing
- 6.1.3 Operations
- 6.1.4 Finance
- 6.1.5 Sales
- 6.1.6 Other Organizational Departments
- 6.2 Deployment Mode
- 6.2.1 On-premise
- 6.2.2 Cloud/On-demand
- 6.3 End User
- 6.3.1 BFSI
- 6.3.2 IT and Telecommunication
- 6.3.3 Retail/E-commerce
- 6.3.4 Education
- 6.3.5 Manufacturing
- 6.3.6 Government
- 6.3.7 Other End Users
- 6.4 Geography
- 6.4.1 North America
- 6.4.2 Europe
- 6.4.3 Asia-Pacific
- 6.4.4 Latin America
- 6.4.5 Middle East and Africa
7 COMPETITIVE LANDSCAPE
- 7.1 Company Profiles
- 7.1.1 Salesforce.com Inc. (Tableau Software Inc.)
- 7.1.2 SAP SE
- 7.1.3 SAS Institute Inc.
- 7.1.4 Microsoft Corporation
- 7.1.5 Oracle Corporation
- 7.1.6 TIBCO Software Inc.
- 7.1.7 IBM Corporation
- 7.1.8 Information Builders
- 7.1.9 Dundas Data Visualization Inc.
- 7.1.10 Pentaho Corporation
- 7.1.11 InetSoft Technology Corporation
- 7.1.12 MicroStrategy Inc.
8 INVESTMENT ANALYSIS
9 MARKET OPPORTUNITIES AND FUTURE TRENDS
- 신규 진출업체의 위협
- 구매자/소비자의 교섭력
- 공급 기업의 교섭력
- 대체품의 위협
- 경쟁 기업간 경쟁 관계
- 경영 임원
- 마케팅
- 오퍼레이션
- 재무
- 영업 부문
- 기타 조직 부문
- 온프레미스
- 클라우드/온디맨드
- 은행/금융서비스/보험(BFSI)
- IT 및 통신
- 소매/E-Commerce
- 교육
- 제조업
- 정부기관
- 기타 최종사용자
- 북미
- 유럽
- 아시아태평양
- 라틴아메리카
- 중동 및 아프리카
- Salesforce.com Inc.(Tableau Software Inc.)
- SAP SE
- SAS Institute Inc.
- Microsoft Corporation
- Oracle Corporation
- TIBCO Software Inc.
- IBM Corporation
- Information Builders
- Dundas Data Visualization Inc.
- Pentaho Corporation
- InetSoft Technology Corporation
- MicroStrategy Inc.
The Data Visualization Market size is estimated at USD 10.92 billion in 2025, and is expected to reach USD 18.36 billion by 2030, at a CAGR of 10.95% during the forecast period (2025-2030).
The emerging nature of data visualization encourages a shift toward analytically driven businesses, where users can explore data in various forms of graphical representation, initially only available in tabular reports.
Key Highlights
- Across many industries, businesses are realizing the benefits of data-driven decision-making. Extracting useful information from big, complicated databases is becoming increasingly important. Data visualization is essential for demystifying complex information and presenting it in a visually appealing manner that is simple to comprehend and analyze. As companies look for ways to extract valuable insights from their data, inference implies that the market for data visualization tools will keep growing. Decision-makers may find patterns, trends, and correlations by efficiently visualizing data, which helps them make more well-informed strategic decisions.
- The term "augmented reality" refers to a technology that overlays digital data, such as visualizations, on the physical environment. A new development that has the potential to change the market completely is the incorporation of AR with data visualization tools. AR can give consumers an immersive and engaging experience that enables them to explore and analyze data in novel ways by superimposing data visualizations onto real-world objects or environments. This technology can be used in several fields, including manufacturing, healthcare, and retail, where real-time data visualization in a geographical context can improve judgment, training, and consumer interaction.
- The combination of natural language processing and conversational interfaces is another distinctive market driver for data visualization. NLP enables computers to comprehend, translate, and produce human language, allowing users to communicate with data visualization tools using natural language instructions or queries. Through dialogues with the system, users can ask questions, request certain visualizations, or examine data by utilizing NLP. Due to its lower learning curve than conventional graphical user interfaces, this driver may make data visualization more approachable to a wider audience. Additionally, it creates possibilities for data-driven decision-making via voice-enabled gadgets like smart speakers and virtual assistants.
- Data privacy and security have become major concerns as the volume of data being generated and analyzed continues to increase. Inference suggests that organizations and individuals are becoming more aware of the potential risks associated with data breaches and unauthorized access to sensitive information. This heightened awareness has led to stricter regulations, such as the General Data Protection Regulation (GDPR) in the European Union and the California Consumer Privacy Act (CCPA) in the United States. These regulations impose limitations on how organizations collect, store, and process personal data.
- COVID-19 brought about unprecedented challenges, requiring organizations to focus on crisis management and business continuity. Data visualization played a vital role in helping businesses monitor key metrics, identify potential risks, and develop strategies to mitigate the impact of the pandemic. Visualizations enabled organizations to track supply chain disruptions, analyze customer behavior shifts, and monitor the financial health of their businesses. By visualizing these critical insights, organizations could respond more effectively to the crisis and adapt their operations to ensure business continuity. There has also been an impact of the Russia-Ukraine war on the overall packaging ecosystem.
Data Visualization Market Trends
Retail Segment to Witness Significant Growth
- Data visualization has enabled retailers to gain deeper insights into customer behavior, preferences, and purchasing patterns. By visualizing customer data, retailers can identify trends, understand customer segmentation, and personalize their marketing strategies. Visual representations of data help retailers make data-driven decisions, optimize inventory management, and tailor their product offerings to meet customer demands. This improved customer analytics has resulted in more targeted marketing campaigns, better customer experiences, and increased sales.
- Data visualization plays a crucial role in enhancing supply chain management for retailers. By visualizing supply chain data, including inventory levels, logistics, and order fulfillment, retailers can identify bottlenecks, optimize processes, and improve overall efficiency. Real-time visualization of supply chain data enables retailers to track inventory movement, monitor product availability, and identify potential disruptions. This leads to improved inventory management, reduced stockouts, and better forecasting accuracy.
- With the help of data visualization tools, retailers can monitor sales performance in real time. Through interactive dashboards, they can track key performance indicators (KPIs), such as sales revenue, conversion rates, and average transaction value. Real-time visualization of sales data enables retailers to identify sales trends, make timely adjustments to pricing and promotions, and address issues or opportunities as they arise. This helps retailers stay agile and responsive in a competitive market, improving sales performance.
- Data visualization empowers retailers to create personalized customer experiences by understanding individual preferences and behavior. Retailers can deliver targeted recommendations, personalized offers, and customized marketing campaigns by visualizing customer data, such as purchase history, browsing patterns, and demographic information. Data-driven personalization enhances customer satisfaction, increases loyalty, and drives repeat purchases.
North America to Hold Largest Market Share
- North America is a prominent market owing to the growing adoption of advanced technologies by end-user industries across the region. Moreover, the area has a strong foothold of vendors, contributing to the market's growth. Data visualization applications in North America are driven by factors such as growth in big data and the need for analytics in the retail sector.
- The United States data visualization market is witnessing healthy growth due to the increasing amount of data generated in small- and medium-scale firms. For instance, a massive amount of data is being developed on digital information platforms every day. According to IBM Corporation, 2.5 quintillion bytes of data are generated daily.
- In July 2021, the United States Coast Guard adopted COVID-19 data visualization tools to assist commanders in making informed decisions on everything from vaccine distribution to operational readiness and has taken precautions to guarantee that the new technologies do not compromise guardsmen's privacy and security. The program aims to teach situational awareness and perspective, and it should not directly impact individuals.
- The implementation of data-driven decision-making is also rising in Canadian markets across various sectors. Cloud business management solutions vendor Sage launched its cloud-first Sage Data and Analytics service integration for Sage 300 and Sage 100 in the US and Canadian markets in March 2021. Its business intelligence toolkit can provide users with live sales dashboards and detailed P&L reports with the help of AI and machine learning algorithms. Such innovations are expected to drive the studied market.
- An increasing need to track data from various sources and compile it into different data representations to make critical business decisions can be observed in North America, as this region is a significant market for technology-based solutions.
Data Visualization Industry Overview
The data visualization market is moderately competitive. The players in the market are innovating in providing strategic solutions to increase their market presence and customer base. This enables them to secure new contracts and tap new markets.
- April 2023 - Amovos SRO, an Atlassian Marketplace Partner that simplifies Jira and Confluence with its well-known Custom Charts for Jira and Custom Charts for Confluence apps, had agreed to be acquired by Tempo Software, a leading provider of portfolio management solutions for product development organizations. With Jira data visualizations that are simple to use and customizable thanks to the purchase, Tempo's Atlassian-based product suite will grow, allowing teams to concentrate on finishing tasks swiftly rather than fumbling with cumbersome corporate reporting tools.
- September 2022: To make Grafana natively compatible with the Azure cloud platform, Microsoft and Grafana Labs established a strategic agreement. Azure Monitor and Azure Data Explorer are just two cloud services that Microsoft's new Azure Managed Grafana service offers native connections. Version 9.0 of Microsoft's Azure Managed Grafana includes a better alerting feature to inform IT administrators of potential technical difficulties. Zone redundancy and support for an API key are also included in this edition.
Additional Benefits:
- The market estimate (ME) sheet in Excel format
- 3 months of analyst support
TABLE OF CONTENTS
1 INTRODUCTION
- 1.1 Study Deliverables
- 1.2 Study Assumptions
- 1.3 Scope of the Study
2 RESEARCH METHODOLOGY
3 EXECUTIVE SUMMARY
4 MARKET DYNAMICS
- 4.1 Market Overview
- 4.2 Industry Attractiveness - Porter's Five Forces Analysis
- 4.2.1 Threat of New Entrants
- 4.2.2 Bargaining Power of Buyers/Consumers
- 4.2.3 Bargaining Power of Suppliers
- 4.2.4 Threat of Substitute Products
- 4.2.5 Intensity of Competitive Rivalry
- 4.3 Value Chain Analysis
- 4.4 Introduction to Market Drivers and Restraints
- 4.5 Market Drivers
- 4.5.1 Cloud Deployment of Data Visualization Solutions
- 4.5.2 Increasing Need for Quick Decision Making
- 4.6 Market Restraints
- 4.6.1 Lack of Tech Savvy and Skilled Workforce/Inability
5 TECHNOLOGY ROADMAP
6 MARKET SEGMENTATION
- 6.1 Organizational Department
- 6.1.1 Executive Management
- 6.1.2 Marketing
- 6.1.3 Operations
- 6.1.4 Finance
- 6.1.5 Sales
- 6.1.6 Other Organizational Departments
- 6.2 Deployment Mode
- 6.2.1 On-premise
- 6.2.2 Cloud/On-demand
- 6.3 End User
- 6.3.1 BFSI
- 6.3.2 IT and Telecommunication
- 6.3.3 Retail/E-commerce
- 6.3.4 Education
- 6.3.5 Manufacturing
- 6.3.6 Government
- 6.3.7 Other End Users
- 6.4 Geography
- 6.4.1 North America
- 6.4.2 Europe
- 6.4.3 Asia-Pacific
- 6.4.4 Latin America
- 6.4.5 Middle East and Africa
7 COMPETITIVE LANDSCAPE
- 7.1 Company Profiles
- 7.1.1 Salesforce.com Inc. (Tableau Software Inc.)
- 7.1.2 SAP SE
- 7.1.3 SAS Institute Inc.
- 7.1.4 Microsoft Corporation
- 7.1.5 Oracle Corporation
- 7.1.6 TIBCO Software Inc.
- 7.1.7 IBM Corporation
- 7.1.8 Information Builders
- 7.1.9 Dundas Data Visualization Inc.
- 7.1.10 Pentaho Corporation
- 7.1.11 InetSoft Technology Corporation
- 7.1.12 MicroStrategy Inc.