


|
시장보고서
상품코드
1629802
북미의 전력 : 시장 점유율 분석, 산업 동향 및 통계, 성장 예측(2025-2030년)North America Power - Market Share Analysis, Industry Trends & Statistics, Growth Forecasts (2025 - 2030) |
||||||
■ 보고서에 따라 최신 정보로 업데이트하여 보내드립니다. 배송일정은 문의해 주시기 바랍니다.
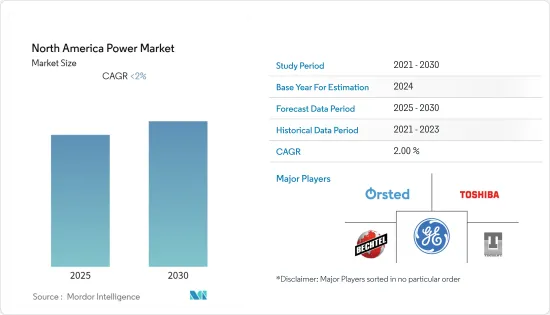
북미의 전력 시장의 예측 기간 동안 CAGR은 2% 이하로 예상됩니다.

시장은 COVID-19로 인해 부정적인 영향을 받았습니다. 현재 시장은 전염병이 발생하기 전의 수준에 도달했습니다.
주요 하이라이트
- 멕시코 등에서는 산업화와 도시화가 진행 중이며, 북미 전력 시장을 견인할 것으로 예상됩니다.
- 그러나 이러한 발전소 업그레이드는 정치적 혼란과 비용 관련 문제로 인해 어렵습니다. 이러한 요인들은 북미 전력 시장에 부정적인 영향을 미칠 것으로 예상됩니다.
- 미국, 캐나다 등 각국의 이산화탄소 배출량 감축을 위한 가이드라인은 북미의 재생에너지 발전소 설치를 촉진했습니다. 이러한 요인은 향후 북미 전력 시장에 몇 가지 기회를 창출할 것으로 예상됩니다.
- 미국은 에너지 소비 증가로 인해 예측 기간 동안 시장을 독점할 것으로 예상됩니다.
북미의 전력 시장 동향
재래식 화력이 시장을 독점할 가능성이 높음
- 재래식 화력발전은 석탄, 천연가스, 석유 등 다양한 전원으로 발전되며, 2021년 북미에서 생산된 전력의 약 57%가 재래식 화력발전에 의해 생산되었습니다.
- 2021년 재래식 화력발전의 다양한 발전원 중 천연가스에 의한 에너지가 대부분을 차지하였습니다. 천연가스는 재래식 화력 발전량의 약 64%를 차지합니다.
- 지난 7월, 미시간주 남서부에는 키위트가 건설하고 GE의 기계를 사용하는 11억 달러 규모의 천연가스 화력 발전소가 신설됐습니다. 인디애나주 사우스벤드(South Bend) 바로 북쪽에 위치한 나일스(Niles)에 위치한 Indeck Niles Energy Center의 발전 용량은 1,100MW에 달합니다.
- 한편, 국제에너지기구(IEA)는 천연가스와 석탄을 이용한 발전의 연료비가 2021년에 증가했지만 향후 몇 년 동안 감소세로 돌아설 것으로 전망하고 있습니다. 지난해 석탄 화력 발전의 9% 증가는 천연가스 가격 상승으로 인한 가스에서 석탄으로의 전환에 기인합니다. 가스에서 석탄으로 전환하면서 미국의 온실가스 배출량도 크게 증가했습니다.
- 따라서 예측 기간 동안 기존 화력발전 부문이 북미 전력 시장을 독점할 것으로 예상됩니다.
시장을 독점하고 있는 미국
- 2021년 미국의 총 발전량은 4,406.4테라와트시(TWh)입니다. 2021년 미국은 북미 전체 발전량의 81%를 생산했습니다.
- 2021년 미국 재생에너지 총 소비량의 약 59%를 전력 부문이 차지했으며, 미국 총 발전량의 약 20%가 재생에너지 발전이었습니다. 재생에너지 발전은 향후 증가할 가능성이 높으며, 미국 전력 시장은 예측 기간 동안 성장할 것으로 예상됩니다.
- 2021년에는 약 815TWh의 전력이 재생에너지 발전으로 생산될 것이며, 풍력발전이 약 378TWh로 가장 많았고, 그 뒤를 이어 기존 수력발전이 총 251TWh, 태양광발전이 164TWh를 차지할 것으로 예상됩니다.
- 미국 풍력 산업은 2021년에 1,275만kW의 신규 풍력발전 용량을 추가하여 괌과 푸에르토리코를 포함한 43개 주에서 운영되는 총 설비용량은 1억 3,400만kW에 달할 것으로 예상됩니다. 풍력발전은 지난 10년간 3배 이상 증가하여 미국 최대의 재생에너지원이 되었습니다.
- 정부는 주로 환경적 이점 때문에 풍력발전 용량의 증가를 강조해 왔습니다. 따라서 향후 풍력발전 용량이 증가하고 프로젝트가 확대됨에 따라 미국의 재생에너지 시장이 강화될 가능성이 높습니다.
- 이상으로 볼 때, 예측 기간 동안 미국이 북미 전력 시장을 독점할 것으로 예상됩니다.
북미의 전력 산업 개요
북미의 전력 시장은 적당히 통합되어 있습니다. 이 시장의 주요 기업으로는 General Electric Company, Oersted AS, Toshiba Corp, Bechtel Corporation, Techint Group 등이 있습니다.
기타 혜택
- 엑셀 형식의 시장 예측(ME) 시트
- 3개월간의 애널리스트 지원
목차
제1장 소개
- 조사 범위
- 시장 정의
- 조사 가정
제2장 주요 요약
제3장 조사 방법
제4장 시장 개요
- 소개
- 북미의 발전용량 예측(단위 : 메가와트, 2027년)
- 최근 동향과 개발
- 정부 규제와 시책
- 시장 역학
- 성장 촉진요인
- 성장 억제요인
- 공급망 분석
- Porter's Five Forces 분석
- 공급 기업의 교섭력
- 소비자의 협상력
- 신규 참여업체의 위협
- 대체품의 위협
- 경쟁 기업 간의 경쟁 관계
제5장 시장 세분화
- 발전
- 기존 화력
- 수력
- 원자력
- 비수력 재생에너지
- 송전과 배전
- 지역
- 미국
- 캐나다
- 기타 북미
제6장 경쟁 상황
- 합병, 인수, 제휴, 합작투자
- 주요 기업의 전략
- 기업 개요
- General Electric Company
- Novi Energy LLC
- Abengoa SA
- Techint Group
- Toshiba Corp.
- Oersted AS
- Allete Inc.
- Bechtel Corporation
- NuScale Power LLC
제7장 시장 기회와 향후 동향
ksm 25.01.23The North America Power Market is expected to register a CAGR of less than 2% during the forecast period.
The market was negatively impacted by COVID-19. Presently the market has now reached pre-pandemic levels.
Key Highlights
- Increasing industrialization and urbanization in countries, such as Mexico, are expected to drive the North American power market.
- However, the upgradation of these power plants is difficult, owing to political disturbances and cost-related issues. These factors are expected to have a negative impact on the North American power market.
- The guidelines for decreasing carbon footprint by countries, such as the United States and Canada, boosted the installation of renewable plants in North America. This factor is expected to create several opportunities for the North American power market in the future.
- The United States, due to its increasing energy consumption, is expected to dominate the market during the forecast period.
North America Power Market Trends
Conventional Thermal is Likely Dominate the Market
- Conventional thermal power is generated through various sources, such as coal, natural gas, and oil. In 2021, about 57% of the electricity generated in North America was from conventional thermal power.
- Out of the various sources of generating conventional thermal power, the majority of energy came from natural gas, in 2021. Natural gas contributed approximately 64% to the conventional thermal power electricity generation.
- In July 2022, Southwest Michigan has a new USD 1.1 billion natural gas-fired power station that was constructed by Kiewit and uses GE machinery. The Indeck Niles Energy Center in Niles, a community just north of South Bend, Indiana, will provide 1,100 MW of generation capacity.
- Whereas, The International Energy Agency (IEA) forecast that while fuel costs for producing electricity using natural gas and coal increased in 2021, they should start to decline in the years to come. The 9% increase in coal-fired power generation last year was fueled by gas-to-coal switching brought on by high natural gas costs. Switching from gas to coal has also significantly increased greenhouse gas emissions in the United States.
- Therefore, owing to the aforementioned, the conventional thermal segment is expected to dominate the North American power market during the forecast period.
The United States to Dominate the Market
- In 2021, the total electricity generation in the United States was 4406.4 terawatts-hour (TWh). In 2021, the United States generated 81% of the total electricity in North America.
- The electric power sector accounted for about 59% of total United States renewable energy consumption in 2021, and about 20% of total United States electricity generation was from renewable energy sources. As renewable energy generation is likely to increase in the future, the united states power market is expected to grow in the forecast period.
- In 2021, approximately 815 TWh of electricity was generated from the renewable energy source, with wind energy accounting for the highest with almost 378 TWh, followed by conventional hydro generating a total of 251 TWh, and further solar energy generating 164 TWh.
- The United States wind power industry added 12.75 GW of new wind capacity in 2021, which was the third-strongest year in its history in terms of installations taking the country's total installed capacity to 134 GW operating across 43 states, including Guam and Puerto Rico. Wind power has more than tripled during the past decade and is the largest renewable energy source in the country.
- The government has been emphasizing increasing the wind capacity, primarily due to environmental benefits. Therefore, with the increase in capacities and expansion of projects in the future, the wind power installed capacity is likely to increase, in turn, bolstering the renewable energy market in the United States.
- Hence, owing to the aforementioned points, the United States is expected to dominate the North American power market during the forecast period.
North America Power Industry Overview
The North American power market is moderately consolidated. Some of the key players in this market ( not in a particular order ) include General Electric Company, Oersted AS, Toshiba Corp., Bechtel Corporation, and Techint Group.
Additional Benefits:
- The market estimate (ME) sheet in Excel format
- 3 months of analyst support
TABLE OF CONTENTS
1 INTRODUCTION
- 1.1 Scope of the Study
- 1.2 Market Definition
- 1.3 Study Assumptions
2 EXECUTIVE SUMMARY
3 RESEARCH METHODOLOGY
4 MARKET OVERVIEW
- 4.1 Introduction
- 4.2 North America Power Generating Capacity Forecast, in Megawatt (MW), till 2027
- 4.3 Recent Trends and Developments
- 4.4 Government Policies and Regulations
- 4.5 Market Dynamics
- 4.5.1 Drivers
- 4.5.2 Restraints
- 4.6 Supply Chain Analysis
- 4.7 Porter's Five Forces Analysis
- 4.7.1 Bargaining Power of Suppliers
- 4.7.2 Bargaining Power of Consumers
- 4.7.3 Threat of New Entrants
- 4.7.4 Threat of Substitutes Products and Services
- 4.7.5 Intensity of Competitive Rivalry
5 MARKET SEGEMENTATION
- 5.1 Generation
- 5.1.1 Conventional Thermal
- 5.1.2 Hydro
- 5.1.3 Nuclear
- 5.1.4 Non-hydro Renewable
- 5.2 Transmission and Distribution
- 5.3 Geography
- 5.3.1 United States
- 5.3.2 Canada
- 5.3.3 Rest of North America
6 COMPETITIVE LANDSCAPE
- 6.1 Mergers, Acquisitions, Collaboration and Joint Ventures
- 6.2 Strategies Adopted by Key Players
- 6.3 Company Profiles
- 6.3.1 General Electric Company
- 6.3.2 Novi Energy LLC
- 6.3.3 Abengoa SA
- 6.3.4 Techint Group
- 6.3.5 Toshiba Corp.
- 6.3.6 Oersted AS
- 6.3.7 Allete Inc.
- 6.3.8 Bechtel Corporation
- 6.3.9 NuScale Power LLC
7 MARKET OPPORTUNITIES AND FUTURE TRENDS


샘플 요청 목록