
|
시장보고서
상품코드
1630309
셰일가스 : 시장 점유율 분석, 산업 동향 및 통계, 성장 예측(2025-2030년)Shale Gas - Market Share Analysis, Industry Trends & Statistics, Growth Forecasts (2025 - 2030) |
||||||
■ 보고서에 따라 최신 정보로 업데이트하여 보내드립니다. 배송일정은 문의해 주시기 바랍니다.
가격
※ 부가세 별도
한글목차
영문목차
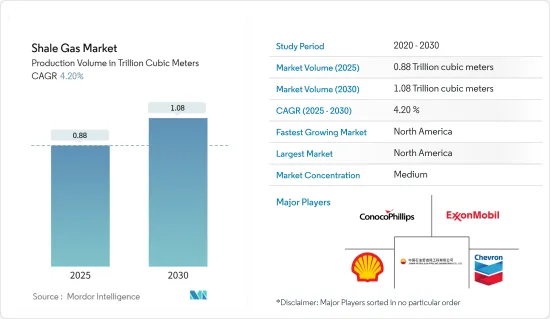
생산량 기준 셰일가스 시장 규모는 2025년 8,800억 입방미터에서 2030년 1조 800억 입방미터로 확대될 것이며, 예측 기간(2025-2030년) 동안 4.2%의 CAGR을 기록할 것으로 예상됩니다.

주요 하이라이트
- 중기적으로는 입증된 셰일가스 매장량, 수평 시추 및 수압파쇄의 최근 기술 개입 등의 요인이 장기적으로 시장을 견인할 것으로 예상됩니다.
- 한편, 가격이 셰일가스 생산원가보다 낮은 석유시장의 불안정성과 높은 탐사비용은 시장의 두 가지 중요한 억제요인입니다.
- 새로운 셰일가스 매장량이 발견되면 향후 시장에 몇 가지 기회가 생길 것으로 예상됩니다.
- 북미는 셰일가스의 대규모 생산으로 인해 예측 기간 동안 가장 큰 시장이 될 것으로 예상됩니다. 미국이 이 지역의 셰일가스 생산을 주도할 것으로 예상됩니다.
셰일가스 시장 동향
환경문제의 증가로 시장 억제
- 시추 과정에서 메탄가스 배출은 잠재적인 대기오염 위험을 초래할 수 있습니다. 또한, 수압파쇄 작업에 사용되는 다량의 화학처리수를 부적절하게 폐기하면 심각한 지표수 오염을 유발할 수 있습니다. 이는 전 세계 환경 보호 단체와 NGO로부터 비판을 받고 있습니다. 건강과 농업에 미치는 영향 때문에 지역 농업 종사자와 주민들은 수압파쇄에 대해 지속적으로 반대해 왔습니다.
- 또한, 일반적인 수압파쇄 우물에서는 수압파쇄 작업 시 약 200만-1,000만 갤런의 물이 필요하기 때문에 특히 가뭄에 취약한 지역에서는 물 공급에 더 많은 부담을 줍니다.
- 2022년, 북미와 아시아태평양은 세계에서 가장 많은 이산화탄소 배출량을 배출하는 지역이 되었습니다. 반면 유럽, 중동 및 아프리카의 이산화탄소 배출량은 가장 적습니다. 화석연료와 산업에서 배출되는 세계 이산화탄소 배출량은 2022년 총 371억 5,000만 톤, 2023년 배출량은 1.1% 증가하여 사상 최고치인 375억 5,000만 톤에 달할 것으로 예상되며, 1990년 이후 세계 이산화탄소 배출량은 60% 이상 증가하였습니다.
- 최근 미국 서부 텍사스 주에 위치한 파미안 분지(미국 내 셰일가스 성장을 견인할 것으로 기대되는 지역)에서 셰일가스 회사들은 물 부족으로 인한 농업 종사자들의 반대와 비판에 직면했습니다.
- 미국 지질조사국(USGS)은 석유와 가스 채굴로 유명한 미국 중동 일부 지역에서 최근 지진이 증가하고 있는 것은 셰일가스 활동 때문이라고 비난했습니다.
- 이렇게 환경 문제에 대한 우려가 높아지면서 예측 기간 동안 시장을 억제할 것으로 예상됩니다.
북미 시장 독식하는 북미
- 미국은 세계 최대의 셰일가스 생산국입니다. 브라질, 캐나다, 중국, 아르헨티나 등 여러 나라가 미국의 셰일 붐을 모방하려고 노력했지만 성공하지 못했습니다. 그러나 중국에서는 큰 진전이 있었지만, 불안정한 저류층으로 인한 어려움으로 인해 셰일가스 생산량은 예측 기간 동안 소폭 증가에 그칠 수 있습니다.
- 미국 에너지정보국(EIA)에 따르면, 2022년 미국 셰일층에서 생산되는 건조 천연가스 생산량은 약 28조 5,000억 입방피트(Tcf)로 미국 전체 건조 천연가스 생산량의 약 80%에 달할 것으로 예상됩니다.
- 캐나다는 풍부한 천연가스 매장량으로 유명하며, 최근 셰일 붐이 일어나기 전까지 수십 년 동안 미국에 천연가스를 공급하는 주요 공급국이었습니다. 그러나 재래식 천연가스 공급원이 감소함에 따라 캐나다 산업계는 셰일가스를 포함한 비재래식 천연가스 공급원으로 눈을 돌리고 있습니다. 현재 많은 석유 및 가스 회사들이 앨버타, 브리티시컬럼비아, 퀘벡, 뉴브런즈윅 주에서 셰일가스 자원의 탐사 및 개발을 진행하고 있으며, 가까운 미래에 셰일가스 생산량의 차이가 균형을 이룰 수 있습니다.
- 미국 에너지정보국(EIA)의 추정 예측에 따르면, 이 지역의 현재 시나리오는 예측 기간 동안 더 많은 천연가스 공급을 필요로 할 수 있으며, 이는 셰일가스 탐사 및 생산에 대한 투자를 불러일으킬 수 있습니다.
- 따라서 북미 대륙의 압도적인 셰일가스 생산량으로 인해 북미가 시장을 독점할 것으로 예상됩니다.
셰일가스 산업 개요
셰일가스 시장은 반세분화되어 있습니다. 이 시장의 주요 기업으로는 Chesapeake Energy Corporation, Shell PLC, Exxon Mobil Corporation, PetroChina Company Limited, ConocoPhillips Company 등이 있습니다(무순서).
기타 혜택
- 엑셀 형식의 시장 예측(ME) 시트
- 3개월간의 애널리스트 지원
목차
제1장 소개
- 조사 범위
- 시장 정의
- 조사 가정
제2장 조사 방법
제3장 주요 요약
제4장 시장 개요
- 소개
- 2029년까지 셰일가스 생산량과 예측
- 최근 동향과 개발
- 정부 규제와 시책
- 시장 역학
- 성장 촉진요인
- 실적 있는 셰일가스 매장량
- 수평 굴착과 수압파쇄 기술 진보
- 성장 억제요인
- 높은 탐사 비용
- 성장 촉진요인
- 공급망 분석
- Porter’s Five Forces
- 공급 기업의 교섭력
- 소비자의 협상력
- 신규 참여업체의 위협
- 대체품의 위협
- 경쟁 기업 간의 경쟁 강도
제5장 시장 세분화
- 지역
- 북미
- 미국
- 캐나다
- 기타 북미
- 남미
- 브라질
- 아르헨티나
- 칠레
- 콜롬비아
- 기타 남미
- 아시아태평양
- 중국
- 인도
- 일본
- 호주
- 말레이시아
- 태국
- 인도네시아
- 베트남
- 기타 아시아태평양
- 유럽
- 독일
- 프랑스
- 영국
- 이탈리아
- 스페인
- 노르딕
- 터키
- 러시아
- 기타 유럽
- 중동 및 아프리카
- 아랍에미리트
- 사우디아라비아
- 카타르
- 남아프리카공화국
- 나이지리아
- 이집트
- 북미
제6장 경쟁 구도
- M&A, 합작투자, 제휴, 협정
- 주요 기업의 전략
- 기업 개요
- Antero Resources Corp.
- Southwestern Energy Company
- EQT Corporation
- Equinor ASA
- Repsol SA
- China Petroleum & Chemical Corporation(SINOPEC)
- Chesapeake Energy Corporation
- Shell PLC
- Exxon Mobil Corporation
- Chevron Corporation
- PetroChina Company Limited
- ConocoPhillips Company
- Pioneer Natural Resources
- Market Player Ranking
제7장 시장 기회와 향후 동향
- 새로운 셰일가스 매장량 발견
The Shale Gas Market size in terms of production volume is expected to grow from 0.88 trillion cubic meters in 2025 to 1.08 trillion cubic meters by 2030, at a CAGR of 4.2% during the forecast period (2025-2030).
Key Highlights
- Over the medium term, factors such as proved shale gas reserves and the recent technological interventions in horizontal drilling and hydraulic fracturing are expected to drive the market in the long term.
- On the other hand, volatility in the oil market with prices below the shale gas production cost and high exploration cost are two critical restraints in the market.
- Nevertheless, the discovery of new shale gas reserves are expected to create several opportunities for the market in the future.
- North America is expected to be the largest market in the forecast period, owing to its large-scale production of shale gas in the region. The United States is expected to lead shale gas production in the area.
Shale Gas Market Trends
Increasing Environmental Concerns to Restrain the Market
- Methane gas emissions during the drilling process pose potential air pollution risks. Additionally, incorrect disposal of large volumes of chemically treated water used in hydraulic fracturing operations can potentially cause severe surface water contamination. This has attracted criticism from environmental protection bodies and NGOs around the world. Due to its impact on health and farming, local farmers and residents have repeatedly opposed hydraulic fracturing.
- Additionally, a typical fracking well requires approximately 2-10 million gallons of water during fracking operations, which puts additional strain on the water supply, particularly in drought-prone regions.
- In 2022, North America and Asia-Pacific recorded the world's highest carbon dioxide emissions. While Europe, the Middle East, and Africa tend to have the lowest emission. The global carbon dioxide emissions from fossil fuels and industry totaled 37.15 billion metric tons in 2022. Emissions are projected to increase by 1.1 percent in 2023 to reach a record high of 37.55 billion metric tons. Since 1990, global CO2 emissions have increased by more than 60 percent.
- Recently in West Texas of the United States, where the Permian Basin (expected to drive the growth of shale gas activities in the United States) is located, shale gas companies faced opposition and criticism from the farmers due to the water shortage.
- The United States Geological Survey (USGS) blamed shale gas activities for the increase in earthquakes in recent times in certain parts of the Central and Eastern United States that are well-known for oil and gas extraction.
- Thus, the increasing environmental concerns are expected to restrain the market during the forecast period.
North America to Dominate the Market
- The United States is the largest producer of shale gas in the world. Different countries, such as Brazil, Canada, China, and Argentina, have tried to emulate the American shale boom but have not been able to succeed. However, large progress has been made in China, but due to the difficulties posed by the unstable reservoirs, shale gas production may only rise slightly in the forecast period.
- According to U.S. Energy Information Administration (EIA) in 2022, U.S. dry natural gas production from shale formations was about 28.5 trillion cubic feet (Tcf) and equal to about 80% of total U.S. dry natural gas production in 2022.Shale gas production may increase further due to new wells being drilled across the country.
- While Canada is known to have significant conventional gas reserves, and the country was a key supplier of natural gas to the United States for decades until the recent shale boom in the country. However, with conventional natural gas sources in decline, Canada's industry is turning to unconventional sources, including shale gas. Many oil and gas companies are now exploring and developing shale gas resources in Alberta, British Columbia, Quebec, and New Brunswick, which may balance the difference in shale gas production in the coming future.
- An Energy Information Agency (EIA) estimation shows that the current scenario of the region may demand more natural gas supply during the forecast period, which may attract investment in the exploration and production of shale gas.
- Hence, North America is expected to dominate the market due to the overwhelming production of shale on the continent.
Shale Gas Industry Overview
The shale gas market is semi fragmented. Some of the key players in this market (in no particular order) includes Chesapeake Energy Corporation, Shell PLC, Exxon Mobil Corporation, PetroChina Company Limited, and ConocoPhillips Company, among others.
Additional Benefits:
- The market estimate (ME) sheet in Excel format
- 3 months of analyst support
TABLE OF CONTENTS
1 INTRODUCTION
- 1.1 Scope of the Study
- 1.2 Market Definition
- 1.3 Study Assumptions
2 RESEARCH METHODOLOGY
3 EXECUTIVE SUMMARY
4 MARKET OVERVIEW
- 4.1 Introduction
- 4.2 Shale Gas Production and Forecast, until 2029
- 4.3 Recent Trends and Developments
- 4.4 Government Policies and Regulations
- 4.5 Market Dynamics
- 4.5.1 Drivers
- 4.5.1.1 Proven Shale Gas Reserves
- 4.5.1.2 Technological Advancement in Horizontal Drilling and Hydraulic Fracturing
- 4.5.2 Restraints
- 4.5.2.1 High Exploration Cost
- 4.5.1 Drivers
- 4.6 Supply Chain Analysis
- 4.7 Porter Five Forces
- 4.7.1 Bargaining Power of Suppliers
- 4.7.2 Bargaining Power of Consumers
- 4.7.3 Threat of New Entrants
- 4.7.4 Threat of Substitutes Products and Services
- 4.7.5 Intensity of Competitive Rivalry
5 MARKET SEGMENTATION
- 5.1 Geography
- 5.1.1 North America
- 5.1.1.1 United States
- 5.1.1.2 Canada
- 5.1.1.3 Rest of North America
- 5.1.2 South America
- 5.1.2.1 Brazil
- 5.1.2.2 Argentina
- 5.1.2.3 Chile
- 5.1.2.4 Colombia
- 5.1.2.5 Rest of South America
- 5.1.3 Asia-Pacific
- 5.1.3.1 China
- 5.1.3.2 India
- 5.1.3.3 Japan
- 5.1.3.4 Australia
- 5.1.3.5 Malaysia
- 5.1.3.6 Thailand
- 5.1.3.7 Indonesia
- 5.1.3.8 Vietnam
- 5.1.3.9 Rest of Asia-Pacific
- 5.1.4 Europe
- 5.1.4.1 Germany
- 5.1.4.2 France
- 5.1.4.3 United Kingdom
- 5.1.4.4 Italy
- 5.1.4.5 Spain
- 5.1.4.6 NORDIC
- 5.1.4.7 Turkey
- 5.1.4.8 Russia
- 5.1.4.9 Rest of Europe
- 5.1.5 Middle-East and Africa
- 5.1.5.1 United Arab Emirates
- 5.1.5.2 Saudi Arabia
- 5.1.5.3 Qatar
- 5.1.5.4 South Africa
- 5.1.5.5 Nigeria
- 5.1.5.6 Egypt
- 5.1.1 North America
6 COMPETITIVE LANDSCAPE
- 6.1 Mergers and Acquisitions, Joint Ventures, Collaborations, and Agreements
- 6.2 Strategies Adopted by Leading Players
- 6.3 Company Profiles
- 6.3.1 Antero Resources Corp.
- 6.3.2 Southwestern Energy Company
- 6.3.3 EQT Corporation
- 6.3.4 Equinor ASA
- 6.3.5 Repsol SA
- 6.3.6 China Petroleum & Chemical Corporation (SINOPEC)
- 6.3.7 Chesapeake Energy Corporation
- 6.3.8 Shell PLC
- 6.3.9 Exxon Mobil Corporation
- 6.3.10 Chevron Corporation
- 6.3.11 PetroChina Company Limited
- 6.3.12 ConocoPhillips Company
- 6.3.13 Pioneer Natural Resources
- 6.4 Market Player Ranking
7 MARKET OPPORTUNITIES AND FUTURE TRENDS
- 7.1 Discovery of New Shale Gas Reserves

