
|
시장보고서
상품코드
1630362
데이터센터용 현장 태양광발전 : 시장 점유율 분석, 산업 동향 및 통계, 성장 예측(2025-2030년)On-Site Photovoltaic Solar Power For Data Centers - Market Share Analysis, Industry Trends & Statistics, Growth Forecasts (2025 - 2030) |
||||||
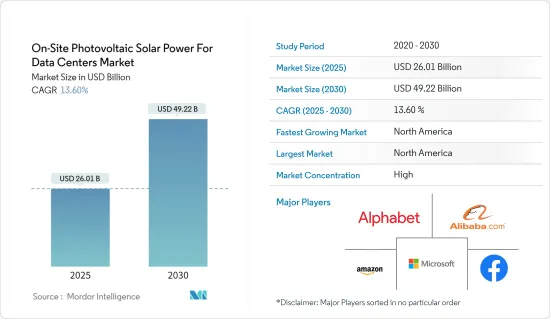
데이터센터용 현장 태양광발전 시장 규모는 2025년 260억 1,000만 달러로 추정되며, 예측 기간(2025-2030년) 동안 13.6%의 CAGR로 2030년에는 492억 2,000만 달러에 달할 것으로 예상됩니다.
주요 하이라이트
- 중기적으로는 태양광발전 설치 비용의 하락과 지속가능한 비즈니스 관행의 도입에 대한 관심이 높아지면서 데이터센터용 현장 태양광발전 시장을 견인할 것으로 예상됩니다.
- 반면, 소규모 데이터센터에서는 태양광 패널을 설치할 공간이 부족하여 예측 기간 동안 데이터센터 현장 태양광발전 시장의 성장을 저해할 것으로 예상됩니다.
- 소규모 데이터센터에 대한 건물 일체형 태양광발전 기술의 대규모 상용화는 예측 기간 동안 데이터센터용 현장 태양광발전 시장에 큰 비즈니스 기회가 될 것으로 예상됩니다.
- 북미가 시장을 주도하며 예측 기간 동안 가장 높은 CAGR을 기록할 것으로 예상됩니다. 이러한 성장의 배경에는 미국, 캐나다를 비롯한 이 지역의 데이터센터에 전력을 공급하기 위한 태양광발전 시스템 설치에 대한 정부 지원과 투자 증가가 있습니다.
데이터센터 현장 태양광발전 시장 동향
태양광발전 도입 비용의 하락이 시장을 주도
- 데이터센터는 컴퓨터 시스템, 스토리지 시스템, 통신 시스템 및 기타 모든 관련 구성요소를 수용하는 전용 건물의 일부, 건물 자체 또는 건물 그룹으로 정의됩니다. 데이터센터에서는 데이터 캡처를 위해 백업 전원을 통한 무정전 전원 공급이 가장 중요합니다.
- 일반적인 데이터센터는 수 킬로와트에서 수십 메가 와트의 전력을 소비합니다. 전력 공급에 대한 높은 의존도는 데이터센터의 높은 운영 비용 중 하나입니다.
- 일부 데이터센터는 운영 비용을 절감하고 환경에 미치는 영향을 줄이기 위해 태양광발전과 같은 온사이트 재생 가능 전원을 선택하고 있습니다. 2015년 0.129달러/kW에서 2022년 약 0.049달러/kW로 낮아진 세계 가중평균 태양광발전 균등화 에너지 비용(LCOE)으로 인해 여러 사업체들이 태양광을 채택하기 시작했습니다.
- 또한, 마이크로소프트는 2025년 말까지 데이터센터를 100% 재생에너지로 운영할 계획입니다. 이처럼 설치 비용의 감소로 인해 현장 태양광발전 시설은 매년 증가할 것으로 예상됩니다.
- 따라서 태양광발전의 설치 비용 감소는 예측 기간 동안 데이터센터용 현장 태양광발전 시장의 성장을 견인할 것으로 예상됩니다.
북미 시장 독식하는 북미
- Cloudcene에 따르면, 2022년 현재 미국은 세계 최대 데이터센터 시장 중 하나이며, 5375개에 가까운 데이터센터가 존재한다고 합니다. 또한 캐나다(335개)도 세계 데이터센터 시장에서 큰 비중을 차지하고 있습니다.
- 미주리 주에 위치한 에머슨 데이터센터는 미국 내 주요 데이터센터 중 하나이며, 데이터센터의 전력 공급원으로 캠퍼스 내 태양광발전 기술을 사용하고 있습니다. 이 센터에는 약 5,000만 달러가 투입된 100킬로와트 규모의 태양광 패널 설비가 설치되어 있습니다. 캘리포니아의 Aiso.net, 애리조나의 i/o Data Centers 등은 부지 내에 태양광발전 설비를 설치한 몇 안 되는 데이터센터입니다.
- 데이터센터 사업자가 예약한 재생 가능 전력의 양은 1년 동안 50% 증가했으며, 현재 이 부문은 미국 기업이 사용할 수 있는 재생 가능 전력의 3분의 2를 소비하고 있습니다.
- 2023년 3월, Meta는 재생에너지 도입이 매년 30%씩 증가하고 있으며, Meta는 이미 356만kW의 태양광발전 용량을 배치했고, 장기 개발 파이프라인에 900만kW 이상의 태양광발전 용량을 배치했으며, Meta는 미국 최대의 상업용 및 산업용 태양광발전 구매자입니다.
- 데이터센터 에너지 수요에 재생에너지를 활용해 프로젝트와 사업의 지속가능성을 높이는 것에 대한 관심이 높아짐에 따라 북미에서는 이 시장의 성장이 기대되고 있습니다.
데이터센터용 현장 태양광발전 산업 개요
데이터센터용 현장 태양광발전 시장은 통합된 시장입니다. 이 시장의 주요 기업으로는 Amazon.com Inc, Alphabet Inc, Microsoft Corporation, Alibaba Group Holding Ltd, Facebook Inc, Dell Technologies Inc, Affordable Internet Services Online Inc 등이 있습니다.
기타 혜택
- 엑셀 형식의 시장 예측(ME) 시트
- 3개월간의 애널리스트 지원
목차
제1장 소개
- 조사 범위
- 시장 정의
- 조사 가정
제2장 주요 요약
제3장 조사 방법
제4장 시장 개요
- 소개
- 2029년까지 시장 규모와 수요 예측(단위 : 달러)
- 최근 동향과 개발
- 정부 규제와 시책
- 시장 역학
- 성장 촉진요인
- 태양광발전 도입 비용 하락
- 지속가능한 비즈니스 프랙티스에 대한 주목 상승
- 성장 억제요인
- 소규모 데이터센터의 태양전지판 설치 공간의 부족
- 성장 촉진요인
- 공급망 분석
- Porter's Five Forces 분석
- 공급 기업의 교섭력
- 소비자의 협상력
- 신규 참여업체의 위협
- 대체품의 위협
- 경쟁 기업 간의 경쟁 강도
제5장 시장 세분화
- 지역
- 북미
- 미국
- 캐나다
- 기타 북미
- 유럽
- 독일
- 프랑스
- 영국
- 이탈리아
- 스페인
- 노르딕
- 터키
- 러시아
- 기타 유럽
- 아시아태평양
- 중국
- 인도
- 일본
- 호주
- 말레이시아
- 태국
- 인도네시아
- 베트남
- 기타 아시아태평양
- 남미
- 브라질
- 아르헨티나
- 칠레
- 콜롬비아
- 기타 남미
- 중동 및 아프리카
- 아랍에미리트
- 카타르
- 사우디아라비아
- 남아프리카공화국
- 나이지리아
- 이집트
- 북미
제6장 경쟁 구도
- M&A, 합작투자, 제휴, 협정
- 주요 기업의 전략
- 기업 개요
- Amazon.com, Inc.
- Alphabet Inc.
- Microsoft Corporation
- Alibaba Group Holding Ltd.
- Facebook Inc.
- Dell Technologies Inc.
- Affordable Internet Services Online Inc.
- Market Player Ranking
제7장 시장 기회와 향후 동향
- 건물 일체형 태양광발전 기술의 대규모 상업화
The On-Site Photovoltaic Solar Power For Data Centers Market size is estimated at USD 26.01 billion in 2025, and is expected to reach USD 49.22 billion by 2030, at a CAGR of 13.6% during the forecast period (2025-2030).

Key Highlights
- Over the medium term, the decreasing solar power installation costs and growing focus on implementing sustainable business practices are expected to drive the on-site photovoltaic solar power for data centers market.
- On the other hand, the lack of space for small data centers to install solar panels is expected to hinder on-site photovoltaic solar power for data centers market growth during the forecast period.
- Nevertheless, the large-scale commercialization of building-integrated photovoltaic technology into small data centers is expected to be a significant opportunity for the on-site photovoltaic solar power for data centers market duringthe forecast period
- North America is expected to dominate the market and likely witness the highest CAGR during the forecast period. This growth is attributed due to the increasing investments, coupled with supportive government policies for installing solar PV systems to power data centers in the region, including the United States of America (USA) and Canada.
On-Site Photovoltaic Solar Power For Data Centers Market Trends
Decrease in Solar Power Installation Cost is Likely to Drive the Market
- Data centers are defined as a part of a building, a building itself, or a cluster of buildings dedicated to housing computer systems, storage systems, telecommunication systems, and all other associated components. An uninterrupted power supply with backup power is the utmost importance in data centers for data capturing.
- A typical data center consumes power between a few kilowatts to several tens of megawatts. High dependency on the power supply is one of the high operating costs of the data center.
- Several data centers are opting for onsite renewable power sources like solar photovoltaic to reduce operating costs and have a less environmental impact. With decrease in Global Weighted Average Solar PV Levelized Cost of Energy (LCOE) from USD 0.129/kW in 2015 to nearly USD 0.049/kW in 2022 several entities have started adopting it.
- Moreover, Microsoft is planning to run 100% of its data center by renewable energy by the end of 2025. Thus, with a decrease in installation cost, onsite solar photovoltaic facilities are expected to grow over the years.
- Hence, deceresing solar power installation costs are expected to aid the growth of the on-site photovoltaic solar power for data centers market during the forecast period.
North America to Dominate the Market
- North America is one of the largest software and information technology markets globally, and according to Cloudscene, as of 2022, the United States was the largest data centre market in the world, housing nearly 5375 data centres. Additionally, Canada (335) also held signficant shares in the global datacentre market.
- Emerson data center in Missouri is one of the key data centers in the United States that is using solar photovoltaic technology on its campus to power its data center. The center has a 100-kilowatt solar panel facility, that was installed at the cost of around USD 50 million. Aiso.net in California, i/o Data Centers in Arizona are few other data centers that are facilitated with onsite photovoltaic solar power facilities.
- The amount of renewable power booked by data center operators increased by 50 percent in a year, and the sector now consumes two-thirds of the renewable power available to corporates in the United States.
- In March 2023, Meta revealed that its renewable energy deployments are growing by 30% each year. Meta has already deployed 3.56 GW of solar capacity, and has over 9 GW in its long-term development pipeline. Meta stands as the largest commercial and industrial purchaser of solar power in the United States.
- Hence, due to rising focus on increasing project and business sustainability by using renewable energy to power the energy needs of datacentres, the market is expected to witness a positive growth in North America.
On-Site Photovoltaic Solar Power For Data Centers Industry Overview
The on-site photovoltaic solar power for data centers market is consolidated. Some of the key players in this market (in no particular order) includes Amazon.com Inc, Alphabet Inc, Microsoft Corporation, Alibaba Group Holding Ltd, Facebook Inc, Dell Technologies Inc, and Affordable Internet Services Online Inc among others.
Additional Benefits:
- The market estimate (ME) sheet in Excel format
- 3 months of analyst support
TABLE OF CONTENTS
1 INTRODUCTION
- 1.1 Scope of the Study
- 1.2 Market Definition
- 1.3 Study Assumptions
2 EXECUTIVE SUMMARY
3 RESEARCH METHODOLOGY
4 MARKET OVERVIEW
- 4.1 Introduction
- 4.2 Market Size and Demand Forecast in USD, till 2029
- 4.3 Recent Trends and Developments
- 4.4 Government Policies and Regulations
- 4.5 Market Dynamics
- 4.5.1 Drivers
- 4.5.1.1 Decreasing Solar Power Installation Costs
- 4.5.1.2 Growing focus on Implementing Sustainable Business Practices
- 4.5.2 Restraints
- 4.5.2.1 Lack of Space for Small Data Centers to Install Solar Panels
- 4.5.1 Drivers
- 4.6 Supply Chain Analysis
- 4.7 Porter's Five Forces Analysis
- 4.7.1 Bargaining Power of Suppliers
- 4.7.2 Bargaining Power of Consumers
- 4.7.3 Threat of New Entrants
- 4.7.4 Threat of Substitute Products and Services
- 4.7.5 Intensity of Competitive Rivalry
5 MARKET SEGMENTATION
- 5.1 Geography
- 5.1.1 North America
- 5.1.1.1 United States
- 5.1.1.2 Canada
- 5.1.1.3 Rest of North America
- 5.1.2 Europe
- 5.1.2.1 Germany
- 5.1.2.2 France
- 5.1.2.3 United Kingdom
- 5.1.2.4 Italy
- 5.1.2.5 Spain
- 5.1.2.6 NORDIC
- 5.1.2.7 Turkey
- 5.1.2.8 Russia
- 5.1.2.9 Rest of Europe
- 5.1.3 Asia-Pacific
- 5.1.3.1 China
- 5.1.3.2 India
- 5.1.3.3 Japan
- 5.1.3.4 Australia
- 5.1.3.5 Malaysia
- 5.1.3.6 Thailand
- 5.1.3.7 Indonesia
- 5.1.3.8 Vietnam
- 5.1.3.9 Rest of Asia-Pacific
- 5.1.4 South America
- 5.1.4.1 Brazil
- 5.1.4.2 Argentina
- 5.1.4.3 Chile
- 5.1.4.4 Colombia
- 5.1.4.5 Rest of South America
- 5.1.5 Middle-East and Africa
- 5.1.5.1 United Arab Emirates
- 5.1.5.2 Qatar
- 5.1.5.3 Saudi Arabia
- 5.1.5.4 South Africa
- 5.1.5.5 Nigeria
- 5.1.5.6 Egypt
- 5.1.1 North America
6 COMPETITIVE LANDSCAPE
- 6.1 Mergers and Acquisitions, Joint Ventures, Collaborations, and Agreements
- 6.2 Strategies Adopted by Leading Players
- 6.3 Company Profiles
- 6.3.1 Amazon.com, Inc.
- 6.3.2 Alphabet Inc.
- 6.3.3 Microsoft Corporation
- 6.3.4 Alibaba Group Holding Ltd.
- 6.3.5 Facebook Inc.
- 6.3.6 Dell Technologies Inc.
- 6.3.7 Affordable Internet Services Online Inc.
- 6.4 Market Player Ranking
7 MARKET OPPORTUNITIES AND FUTURE TRENDS
- 7.1 Large-scale Commercialization of Building-integrated Solar PV Technology

