
|
시장보고서
상품코드
1630407
북미의 풍력발전 설비 : 시장 점유율 분석, 산업 동향 및 통계, 성장 예측(2025-2030년)North America Wind Power Equipment - Market Share Analysis, Industry Trends & Statistics, Growth Forecasts (2025 - 2030) |
||||||
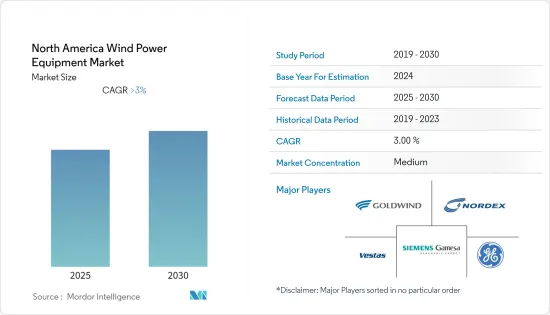
북미의 풍력발전 설비 시장은 예측 기간 동안 3% 이상의 CAGR을 기록할 것으로 예상됩니다.

2020년 COVID-19는 시장에 악영향을 끼쳤습니다. 현재 시장은 전염병 이전 수준에 도달했습니다.
주요 하이라이트
- 중기적으로는 풍력발전소 투자 증가와 풍력에너지 비용 절감 등의 요인이 북미 풍력발전 설비 시장을 견인할 것으로 보입니다.
- 한편, 태양광 및 수력발전과 같은 청정 대체 전원의 채택 증가는 시장을 억제할 것으로 예상됩니다.
- 캐나다는 2030년까지 온실가스 배출량을 30% 감축하기로 약속했으며, 이를 위해 깨끗한 전력망의 중요성을 인식하고 있습니다. 이 목표의 일부는 풍력에너지로 달성될 것으로 예상되며, 이는 시장 참여자들에게 기회가 될 수 있습니다.
- 미국은 풍력발전 부문에 대한 투자가 증가하고 풍력발전 설비 용량이 이 지역에서 가장 큰 풍력발전 설비 시장으로, 이 지역에서 가장 큰 풍력발전 설비 시장이 될 것으로 예상됩니다.
북미의 풍력발전 설비 시장 동향
육상 부문이 시장을 독식
- 육상 풍력발전은 육지에 설치하여 바람을 이용하여 발전하는 풍력발전소를 말합니다. 북미 지역에는 육상 풍력발전소가 압도적으로 많은데, 그 이유는 저렴한 비용, 드문드문 땅, 그레이트 플레인즈와 같은 지역에서 볼 수 있는 고속의 바람이 불기 때문입니다.
- 북미 육상 풍력발전 설비용량은 2021년 154,436MW에서 2022년 163,428MW로 5.8% 증가할 것으로 예상됩니다. 투자 증가로 인해 설치 용량은 예측 기간 동안 더욱 증가할 것으로 예상됩니다.
- 캐나다 정부는 2025년까지 풍력발전 용량을 55GW까지 늘려 캐나다 에너지 수요의 20%를 충족시키는 것을 목표로 하고 있습니다. 그러나 이 목표를 달성하기 위해서는 42GW 이상의 풍력발전 용량을 추가해야 합니다. 이는 부유식 해상 풍력 프로젝트 개발업체들에게 투자 기회가 될 것으로 예상됩니다.
- 또한, 국제재생에너지기구(IRENA)에 따르면, 평준화 에너지 비용(LCOE)과 세계 가중평균 총 설치비용은 2016년 0.060달러/kWh와 1,652달러/kW에서 2020년에는 0.039달러/kWh와 1,355달러/kW로 감소할 것입니다. 또한, 자본 비용의 감소, 이 부문의 지속적인 성숙으로 인한 경쟁 심화, 예측 기간 동안 기술 개선으로 인해 LCOE와 가중평균비용은 더욱 낮아질 것으로 예상됩니다.
- GWEC에 따르면 미국의 육상 풍력발전 부문은 2021년 연간 신규 설치량이 세계에서 두 번째로 많은 약 1,274만kW를 가동했습니다. 미국의 육상 풍력발전 설치는 프로젝트 개발자가 기한을 준수해야했기 때문에 계획된 생산 세액 공제의 단계적 폐지가 주요 요인으로 작용했으며, 이는 풍력발전 설비 시장에도 직접적으로 기여했습니다.
- 따라서 육상 풍력발전 설비 시장은 이 부문에 대한 투자 증가와 새로운 기술 발전으로 인해 예측 기간 동안 크게 성장할 것으로 예상됩니다.
시장을 독점하고 있는 미국
- 미국은 풍력발전 총 설치 용량 2위 국가로 2022년 141GW의 용량을 기록해 북미 풍력발전 총 설치 용량의 86% 이상을 차지했습니다. 미국의 풍력발전 순발전량은 2021년 3,797억 7,000만 킬로와트시(kWh)로 같은 해 공급된 전력의 약 9%를 차지할 것으로 예상됩니다. 또한 캔자스, 아이오와, 오클라호마, 노스다코타, 사우스다코타, 네브래스카, 콜로라도, 미네소타, 뉴멕시코, 메인 등 10개 주에서 풍력발전량이 20%를 넘어섰습니다.
- Orsted A/S는 PSEG(Public Service Enterprise Group)의 지원을 받아 뉴저지 주 최초의 실용적인 규모의 해상 풍력발전소를 건설할 예정입니다. 1,100MW 규모의 이 프로젝트는 2020년대에 착공하여 2024년에 가동될 예정이며, Orsted A/S는 12MW 규모의 풍력 터빈 Haliade-X를 뉴저지 주 앞바다의 1,100MW 규모의 Ocean Wind에 배치할 예정입니다. 예측 기간 동안 신규 프로젝트로 인해 풍력발전 설비에 대한 수요가 증가할 것으로 예상됩니다.
- 지난 4월, 해상 풍력 개발업체 트라이던트 윈즈(Trident Winds)는 워싱턴주 앞바다에서 올림픽 윈드(Olympic Wind)라는 이름의 부유식 해상 풍력 프로젝트를 개발하기 위해 BOEM에 2,000MW의 미청구 임대 신청서를 제출했습니다.
- 2022년 4월, 해양에너지관리국은 중앙대서양에 대한 정보 모집 및 지정구역안을 발표했는데, 389만 7,388에이커에 달하는 제안구역은 약 3만MW의 발전 용량을 개발할 수 있으며, 고정식 바닥 풍력 터빈과 부유식 풍력 터빈의 배치를 모두 지원할 가능성이 높으며, 2022년 5월 현재 미국에는 11개의 해상 풍력발전용 콜 지역이 있으며, 부유식 구조물에는 5개의 지역이 할당되어 있습니다.
- 해상 풍력 부문에서는 미국 각 주에서 약 4만 5,000MW에 가까운 해상 풍력 조달 목표를 설정하고 있습니다. 또한 12개의 해상 풍력 프로젝트 개발로 2026년까지 약 1,030만kW의 해상 풍력발전이 가동될 것으로 예상됩니다.
- 따라서 미국은 이 부문에 대한 대규모 투자와 기술 발전으로 북미 풍력발전 설비 시장을 독점할 것으로 예상됩니다.
북미의 풍력발전 설비 산업 개요
북미의 풍력발전 설비 시장은 상당히 세분화되어 있습니다. 이 시장의 주요 기업들(순서는 무관)은 Nordex SE, General Electric Company, Siemens Gamesa Renewable Energy S.A., Vestas Wind Systems AS, Xinjiang Goldwind Science & Technology 등이 있습니다. Technology 등이 있습니다.
기타 혜택
- 엑셀 형식의 시장 예측(ME) 시트
- 3개월간의 애널리스트 지원
목차
제1장 소개
- 조사 범위
- 시장 정의
- 조사 가정
제2장 조사 방법
제3장 주요 요약
제4장 시장 개요
- 소개
- 2028년까지 시장 규모와 수요 예측(단위 : 10억 달러)
- 2028년까지 풍력에너지 설치 용량과 예측(단위 : GW)
- 북미의 재생에너지 믹스(2022년)
- 최근 동향과 개발
- 정부 규제와 시책
- 시장 역학
- 성장 촉진요인
- 성장 억제요인
- 공급망 분석
- Porter's Five Forces 분석
- 공급 기업의 교섭력
- 소비자의 협상력
- 신규 참여업체의 위협
- 대체품의 위협
- 경쟁 기업 간의 경쟁 강도
제5장 시장 세분화
- 입지
- 온쇼어
- 오프쇼어
- 설비 유형
- 로터/블레이드
- 타워
- 기어박스
- 발전기
- 기타 설비 유형
- 지역
- 미국
- 캐나다
- 기타 북미
제6장 경쟁 구도
- M&A, 합작투자, 제휴, 협정
- 주요 기업의 전략
- 기업 개요
- Nordex SE
- Xinjiang Goldwind Science & Technology Co., Ltd.
- General Electric Company
- Siemens Gamesa Renewable Energy S.A.
- Vestas Wind Systems AS
- Emergya Wind Technologies BV
- Acciona, S.A.
- Envision Energy
- Enercon GmbH
제7장 시장 기회와 향후 동향
ksm 25.01.23The North America Wind Power Equipment Market is expected to register a CAGR of greater than 3% during the forecast period.
In 2020, COVID-19 had a detrimental effect on the market. Presently, the market has reached pre-pandemic levels.
Key Highlights
- Over the medium term, factors such as rising investments in wind farms and reducing the cost of wind energy are likely to drive the North American wind power equipment market.
- On the other hand, increasing adoption of alternate clean power sources such as solar and hydropower is expected to restrain the market.
- Nevertheless, Canada has committed to reducing greenhouse gas emissions by 30 percent by 2030 and recognizes the importance of a clean electricity grid in supporting that objective. A part of the target is expected to be completed using wind energy, which may act as an opportunity for market players.
- The United States is expected to be the largest market for the region's wind power equipment market due to increasing investment in the sector and the highest installed capacity of wind energy in the region.
North America Wind Power Equipment Market Trends
Onshore Segment to Dominate the Market
- Onshore wind power refers to wind farms that are located on land and use the wind to generate electricity. The North American region is overwhelmingly composed of onshore wind farms due to their cheaper cost, sparse land, and high-speed winds that can be found in areas such as the Great Plains.
- Onshore installed wind capacity in North America increased by 5.8%, from 154,436 megawatts in 2021 to 163,428 megawatts in 2022. The installed capacity is expected to further increase in the forecast period due to increasing investments.
- The Canadian government aims to increase wind power capacity to 55 GW by 2025 to meet 20% of the country's energy needs. However, the country still needs to add more than 42 GW of new capacity to meet the targets. This, in turn, is expected to provide investment opportunities for floating offshore wind project developers.
- Further, according to the International Renewable Energy Agency (IRENA), the levelized cost of energy (LCOE) and global weighted average total installed cost decreased from 0.060 USD/kWh and 1652 USD/kW in 2016 to 0.039 USD/kWh and 1355 USD/kW in 2020. In addition, the LCOE and the weighted average cost are expected to decline further owing to reductions in capital costs, increased competition as the sector continues to mature, and improvements in technology during the forecast period.
- According to the GWEC, the United States' onshore wind sector reported the second-highest annual new installations in the world in 2021, with around 12.74 GW commissioned. The onshore wind installation in the United States was driven primarily by the planned Production Tax Credit phase-out as project developers had to meet their deadline, which also directly aided the wind power equipment market.
- Hence, the onshore wind power equipment market is expected to grow significantly in the forecast period due to increasing investments and new technological advances in the field.
United States to Dominate the Market
- The United States was the second-largest country in terms of total installed wind energy capacity, recording 141 GW of capacity in 2022, or more than 86% of the total wind energy capacity in North America. In the United States, the net electricity generation from wind power reached 379.77 billion kilowatt-hours in 2021, which is about 9% of the electricity delivered in the year. Moreover, wind provided more than 20% of the electricity produced in ten states, namely Kansas, Iowa, Oklahoma, North Dakota, South Dakota, Nebraska, Colorado, Minnesota, New Mexico, and Maine.
- Orsted A/S, with the support of Public Service Enterprise Group (PSEG), is expected to construct New Jersey's first utility-scale offshore wind farm. The 1,100 MW project was expected to start construction in the 2020s, with the wind farm becoming operational in 2024. Orsted A/S will deploy Haliade-X 12MW wind turbines on the 1,100MW Ocean Wind off the coast of New Jersey. New projects are expected to increase the demand for wind power equipment in the forecast period.
- In April 2022, offshore wind energy developer Trident Winds submitted a 2,000-MW unsolicited lease application to BOEM to develop a floating offshore wind project called Olympic Wind off Washington State.
- In April 2022, the Bureau of Ocean Energy Management announced its Central Atlantic draft Call for Information and Nominations Area. The proposed areas amounting to 3,897,388 acres were likely to enable the development of approximately 30,000 MW of generating capacity and support the deployment of both fixed-bottom and floating wind turbines, and as of May 2022, there were 11 call areas for offshore wind energy in the United States, with five areas allotted for floating structures.
- In the offshore wind sector, various states in the United States have established nearly 45,000 MW of offshore wind procurement targets. Additionally, around 10.3 GW of offshore wind energy is expected to come online by 2026 with the development of 12 offshore wind energy projects.
- Hence, the United States is expected to dominate the North American wind power equipment market due to significant investments and technological advancements in the sector.
North America Wind Power Equipment Industry Overview
The North American wind power equipment market is moderately fragmented. Some of the key players in this market (in no particular order) include Nordex SE, General Electric Company, Siemens Gamesa Renewable Energy S.A., Vestas Wind Systems AS, and Xinjiang Goldwind Science & Technology Co., Ltd.
Additional Benefits:
- The market estimate (ME) sheet in Excel format
- 3 months of analyst support
TABLE OF CONTENTS
1 INTRODUCTION
- 1.1 Scope of the Study
- 1.2 Market Definition
- 1.3 Study Assumptions
2 RESEARCH METHODOLOGY
3 EXECUTIVE SUMMARY
4 MARKET OVERVIEW
- 4.1 Introduction
- 4.2 Market Size and Demand Forecast in USD billion, till 2028
- 4.3 Wind Energy Installed Capacity and Forecast in GW, till 2028
- 4.4 North America Renewable Energy Mix, 2022
- 4.5 Recent Trends and Developments
- 4.6 Government Policies and Regulations
- 4.7 Market Dynamics
- 4.7.1 Drivers
- 4.7.2 Restraints
- 4.8 Supply Chain Analysis
- 4.9 Porter's Five Forces Analysis
- 4.9.1 Bargaining Power of Suppliers
- 4.9.2 Bargaining Power of Consumers
- 4.9.3 Threat of New Entrants
- 4.9.4 Threat of Substitute Products and Services
- 4.9.5 Intensity of Competitive Rivalry
5 MARKET SEGMENTATION
- 5.1 Location
- 5.1.1 Onshore
- 5.1.2 Offshore
- 5.2 Equipment Type
- 5.2.1 Rotor/Blade
- 5.2.2 Tower
- 5.2.3 Gearbox
- 5.2.4 Generator
- 5.2.5 Other Equipment Types
- 5.3 Geography
- 5.3.1 United States
- 5.3.2 Canada
- 5.3.3 Rest of North America
6 COMPETITIVE LANDSCAPE
- 6.1 Mergers and Acquisitions, Joint Ventures, Collaborations, and Agreements
- 6.2 Strategies Adopted by Leading Players
- 6.3 Company Profiles
- 6.3.1 Nordex SE
- 6.3.2 Xinjiang Goldwind Science & Technology Co., Ltd.
- 6.3.3 General Electric Company
- 6.3.4 Siemens Gamesa Renewable Energy S.A.
- 6.3.5 Vestas Wind Systems AS
- 6.3.6 Emergya Wind Technologies BV
- 6.3.7 Acciona, S.A.
- 6.3.8 Envision Energy
- 6.3.9 Enercon GmbH
