


|
시장보고서
상품코드
1630432
이벤트 스트림 처리 : 시장 점유율 분석, 산업 동향 및 통계, 성장 예측(2025-2030년)Event Stream Processing - Market Share Analysis, Industry Trends & Statistics, Growth Forecasts (2025 - 2030) |
||||||
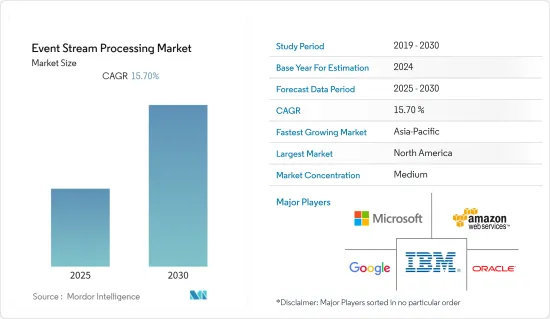
이벤트 스트림 처리 시장은 예측 기간 동안 15.7%의 CAGR을 기록할 것으로 예상됩니다.

주요 하이라이트
- MachEye에 따르면, 사람들은 매일 2억 5천만 바이트의 데이터를 생성하고 있으며, 이는 매년 빠르게 증가할 것으로 예상됩니다. 비즈니스 인텔리전스 사용자들은 이렇게 폭발적으로 증가하는 복잡한 데이터를 실행 가능한 인사이트으로 전환하는 데 어려움을 겪고 있습니다. 그 결과, 보다 진보되고 사용하기 쉬운 데이터 변환 도구에 대한 수요가 크게 증가할 것으로 예상됩니다.
- 타겟팅된 오퍼와 예측 분석을 통해 소매업체는 모든 고객에 대해 매우 세밀하고 개인화된 오퍼를 개발할 수 있습니다. 예를 들어, 소매업체는 더 자주 구매하도록 인센티브를 제공하고 더 많은 구매를 유도하는 오퍼를 제공함으로써 매장 경험을 개인화하고 모든 채널에서 더 높은 매출을 달성할 수 있습니다. 예측 분석은 고객 상향 판매 및 교차 판매에 활용할 수 있습니다. 또한 예측 분석은 기업이 고객의 평생 가치(CLV)를 예측하는 데 도움이되며, CLV는 과거 행동을 분석하고 장기적으로 가장 수익성이 높은 고객을 식별하여 장기적인 고객 할인 가치를 예측하는 데 도움이 될 수 있습니다.
- 또한, 방대한 양의 RFID 데이터를 실시간으로 처리해야 하는 필요성으로 인해 RFID(Radio-Frequency Identification) 이벤트 처리 애플리케이션에서 이벤트 스트림 처리의 사용이 빠르게 증가하고 있습니다. 에 연결되어 RFID 리더가 읽을 수 있는 신호를 생성합니다. 이를 통해 기업은 물건이나 사람의 위치를 실시간으로 파악할 수 있으며, 공급망 관리, 사람 안전 확보 등 다양한 측면에서 중요한 역할을 합니다.
- Sisense의 조사에 따르면, 50%의 기업이 COVID-19 사태 이전보다 예측 분석을 더 많이 활용하고 있으며, 그 중 68% 이상의 중소기업이 예측 분석을 더 많이 활용하고 있다고 합니다. 예를 들어, COVID-19 팬데믹의 핵심 과제는 고객이 오프라인 매장을 방문할 때 안전을 보장하는 것이었습니다. 비즈니스 인텔리전스 도구, 소셜 네트워킹 플랫폼, 고객관계관리(CRM) 시스템의 도움으로 기업은 고객으로부터 직접 피드백을 받아 모든 사람의 건강과 안전을 보장하기 위해 적절한 조치를 취할 수 있었습니다.
- 데이터 분석 및 데이터 시각화 도구에 대한 수요가 크게 증가하고 있습니다. 예를 들어, IBM Quant Crunch에 따르면, 최대 272만 개의 일자리가 데이터 과학 기술을 필요로 하며, 이는 산업 전반에서 가장 수요가 많은 역할 중 하나이며, MIS 및 CS학과를 졸업한 대학생들은 데이터베이스 모델링이나 실제 데이터베이스 환경에 대해 거의 알지 못합니다. 거의 알지 못합니다. 비즈니스 인텔리전스나 분석 과정은 말할 것도 없고, 데이터베이스 수업이 있는 특정 IT 과학 전공도 없습니다. 직장에서 사용되는 도구와 기술을 접할 기회가 부족합니다.
이벤트 스트림 처리 시장 동향
사물인터넷(IoT) 및 스마트 기기 도입 증가
- 최근 Oracle의 조사에 따르면, 기업 IoT 도입자들은 더 쉬운 방법을 택할 의향이 있는 것으로 나타났습니다. 조사에 참여한 800명의 IoT 의사결정권자 중 거의 3분의 2(64%)가 맞춤형 IoT 솔루션이 아닌 '기성품' IoT 솔루션을 선택하겠다고 답해 기업의 IoT 제품 구매 방식이 변화하고 있음을 보여줍니다. 또한, 응답자의 75%는 솔루션 제공업체가 연결 기능을 통합하거나 솔루션 제공업체가 패키징하기를 원하며, 70%는 솔루션 제공업체가 완전한 솔루션의 일부로 데이터 및 분석 기능을 제공하기를 원한다고 답했습니다. 이 결과는 IoT 기능을 추가하고 가치를 창출하는 데 걸리는 시간을 단축할 수 있는 간단한 방법에 대한 요구가 증가하고 있음을 보여줍니다.
- 또한 올해까지 네트워크에 연결된 장치와 연결 수는 2018년 184억 개에서 300억 개에 육박할 것으로 시스코의 연례 인터넷 보고서가 예측했습니다. 올해 말까지 IoT 기기는 전체 네트워크 연결 기기의 50%(14.7억 개)를 차지할 것이며, 이는 2018년 33%(6.1억 개)에서 증가한 수치입니다.
- 마이크로소프트의 IoT Signals 보고서에 따르면, 미국이 이용 단계에 있는 프로젝트의 27%로 1위를 차지했고, 스페인(22%), 호주(18%)가 그 뒤를 이었으며, IoT 도입 가속화 측면에서 미국은 다른 국가를 크게 앞서고 있으며, 미국 기업의 78%가 향후 2년간 IoT 활용을 확대할 의향이 있다고 답했습니다. 그러나 올해 독일 기업의 51%, 일본 기업의 51%가 이용 확대를 계획하고 있습니다. 이는 독일과 일본 시장의 기술 도입이 더 보수적이기 때문인 것으로 보입니다.
- Gallup이 매년 실시하는 건강 및 의료 관련 설문조사에 따르면, 미국 소비자의 90%가 현재 웨어러블 피트니스 트래커를 사용하고 있다고 답했으며, 같은 비율의 응답자가 현재 모바일 건강 애플리케이션을 사용하고 있다고 답했습니다. 현재 사용 현황과 과거에 이러한 기기를 사용한 적이 있다고 답한 미국인의 비율을 합치면, 미국인 3명 중 1명은 손목 밴드나 스마트워치와 같은 피트니스 트래커를 사용하거나(34%), 휴대폰이나 태블릿 애플리케이션을 사용해 본 적이 있는 것으로 나타났습니다. (34%) 또는 휴대폰이나 태블릿 애플리케이션을 통해 자신의 건강 통계를 추적한 적이 있는 것으로 나타났습니다.
- AI와 결합된 디지털 어시스턴트는 사용자가 핸즈프리로 스마트 기기를 보다 효율적으로 도입할 수 있게함으로써 구매자의 선호도에 큰 영향을 미치고 있으며, Alexa, Google Assistant, Siri, Bixby와 같은 디지털 어시스턴트의 등장으로 스마트 기기를 음성 명령으로 제어하고 관리할 수 있게 되었습니다. 블루투스 스피커 제어, 핸즈프리 채널 서핑과 같은 디지털 비서의 개발 기능이 스마트홈 기기 시장을 주도하고 있으며, 음성 명령으로 스마트 기기를 제어하고 관리할 수 있게 되었습니다. 또한, 구매자들은 더 나은 편의성과 사용자 경험을 위해 맞춤형 디바이스를 선택합니다.
북미 시장이 큰 시장 점유율을 차지할 전망
- 북미는 예측 기간 동안 가장 큰 시장 규모를 유지하며 ESP 시장을 지배할 것으로 보입니다. 이 지역에 많은 ESP 벤더가 존재하는 이유는 새로운 기술의 조기 도입과 높은 도입률, 그리고 이벤트 기반 제공을 개선하기 위한 연구개발에 투자하고 있기 때문입니다.
- 이벤트 스트림 처리에 대한 수요가 증가함에 따라 이 지역 기업들은 시장 점유율을 확보하기 위해 새로운 솔루션을 제공하고 있습니다. 예를 들어, IBM Event Streams는 통합 기능을 제공하는 IBM Cloud Pak입니다. 이벤트 스트림을 통해 기업 데이터에 대한 액세스를 제공하고, 이벤트 기반 데이터로부터 인사이트를 얻고, 실시간 대규모 탐지 및 조치를 취할 수 있도록 지원하는 IBM의 차별화 요소는 API 관리와 함께 이벤트 엔드포인트를 제어할 수 있는 능력입니다. 제어할 수 있는 능력입니다.
- 미국 기반 데이터 분석 기업 Express Analytics는 지난 2월 세계 확장 전략의 일환으로 인도 시장에 진출해 기술, 통신, 은행, 은행, 광고, 소매 산업 기업 및 공공 부문에 인공지능(AI) 및 머신러닝(ML) 기반 예측 분석 서비스를 제공한다고 발표했습니다. 또한, 빠르게 변화하는 디지털 인도 시장에서 포트폴리오를 확장하기 위해 델리에 본사를 둔 마브컴 어드바이저리(Mavcomm Advisory)와 전략적 계약을 체결했습니다.
- 미국 클라우드 부문에서는 몇 가지 파트너십 활동을 볼 수 있습니다. 예를 들어, 기술 중심의 세계 기업인 HCL Technologies는 Google Cloud와의 파트너십을 연장하여 HCL의 Actian 포트폴리오 인 Actian Avalanche를 Google Cloud에 제공한다고 발표했습니다. 이 하이브리드 클라우드 데이터웨어하우스는 기업의 비즈니스 분석 워크로드를 개선하기 위해 제안된 것으로, Avalanche는 Google Cloud에서 비즈니스 인텔리전스 및 분석 플랫폼을 제공하여 일반적인 SaaS 및 기업 애플리케이션을 쉽게 도입하고 사용할 수 있도록 지원합니다. 애플리케이션이 쉽게 도입하고 사용할 수 있는 종합적인 솔루션을 제공할 수 있도록 지원합니다.
- 디지털 채널로 전환하는 고객이 증가하고 물리적 지점망의 비용이 높아짐에 따라 디지털 전용 은행 사업체가 급증하고 있습니다. 예금을 모으기 위해 디지털 전용 은행을 설립하는 금융기관은 적지만, 대출, 투자, 전문 서비스를 제공하기 위해 디지털 플랫폼을 활용하는 금융기관도 있습니다. 두 경우 모두 새로운 아이디어를 창출하고, 고객 경험을 개선하고, 고객에게 더 많은 가치를 제공하는 데 초점을 맞추고 있습니다. 이는 고객 데이터와 이벤트 스트림 처리를 통해서만 가능합니다.
이벤트 스트림 처리 산업 개요
세계 이벤트 스트림 처리 시장은 다수의 진입자가 존재하기 때문에 적당한 경쟁 상태에 있습니다. 시장 진입 기업은 제품 포트폴리오를 확장하고 지리적 범위를 확장하며 주로 제품 혁신, 합병 및 인수와 같은 전략을 채택하여 시장에서 경쟁을 유지하기 위해 제품 혁신, 합병 및 인수 등의 전략을 채택하고 있습니다.
지난 10월, 데이터 스트림 처리 플랫폼을 개발하는 RisingWave Labs는 Yunqi Partners, 미확인된 기업 파트너 및 엔젤 투자자를 중심으로 3,600만 달러의 시리즈 A 자금 조달을 발표했습니다. RisingWave의 총 투자액은 4,000만 달러 이상이며, 이 자금은 몇 년 후 새로운 클라우드 서비스인 RisingWave 클라우드를 출시하기 위해 스타트업의 사업 확장에 사용될 예정입니다.
그닷이 2022년 3월에 만든 Quine은 대용량 이벤트 처리를 위해 설계된 오픈 소스 스트리밍 그래프 솔루션으로, 그래프 데이터와 스트리밍 기술을 혼합하여 실시간으로 복잡한 이벤트 처리 프로세스를 대규모로 구축할 수 있게 해준다는 것이 그닷의 설명입니다. 복잡한 이벤트 처리 프로세스를 대규모로 구축할 수 있도록 합니다. 스트림 처리를 위한 이벤트 기반 마이크로서비스 개발은 데이터베이스와 분산 시스템 영역의 복잡한 어려움이 결합된 어려운 작업입니다. 합의, 동시성, 트랜잭션 로직, 클러스터링 동작, 내결함성, 확장성, 읽기 및 쓰기 성능 트레이드 오프의 균형, 기타 기능 등이 모두 포함됩니다.
기타 혜택
- 엑셀 형식의 시장 예측(ME) 시트
- 3개월간의 애널리스트 지원
목차
제1장 소개
- 조사 가정과 시장 정의
- 조사 범위
제2장 조사 방법
제3장 주요 요약
제4장 시장 역학
- 시장 개요
- 시장 성장 촉진요인
- 사물인터넷(IoT)과 스마트 디바이스 채용 증가
- 다양한 소스에서 대량 데이터를 분석하는 요구 증가
- 시장 성장 억제요인
- 데이터 보안과 프라이버시에 관한 우려
- Porter's Five Forces 분석
- 공급 기업의 교섭력
- 구매자의 교섭력
- 신규 참여업체의 위협
- 대체품의 위협
- 경쟁 기업 간의 경쟁 강도
제5장 시장 세분화
- 도입 방식
- 클라우드
- 온프레미스
- 컴포넌트
- 솔루션(소프트웨어 & 플랫폼)
- 서비스
- 애플리케이션
- 부정 감지
- 알고리즘 거래
- 프로세스 모니터링
- 예지보전
- 세일즈 및 마케팅
- 최종 이용 산업별
- IT·통신
- BFSI
- 제조업
- 소매·E-Commerce
- 에너지 및 유틸리티
- 기타 최종 이용 산업별
- 지역
- 북미
- 유럽
- 아시아태평양
- 라틴아메리카
- 중동 및 아프리카
제6장 경쟁 구도
- 기업 개요
- IBM Corporation
- Microsoft Corporation
- Google Inc.
- Oracle Corporation
- Amazon Web Services Inc.
- Salesforce
- Redhat
- SAP SE
- TIBCO
- Hazelcast IMDG
- SAS
- Confluent, Inc.
- Hitachi Vantara
- Informatica
제7장 투자 분석
제8장 시장 기회와 향후 동향
ksm 25.01.23The Event Stream Processing Market is expected to register a CAGR of 15.7% during the forecast period.
Key Highlights
- According to MachEye, people produce 2.5 quintillion bytes of data daily, which is expected to grow faster each year. Business intelligence users are already struggling to translate this explosion of complex data into actionable insights. As a result, there would be a significant demand for more advanced, easy-to-use data translation tools.
- Targeted offers and predictive analytics enable merchants to develop highly personalized offers for all their customers at a very granular level. For instance, retailers can personalize the in-store experience by providing offers to incentivize frequent buying and drive more purchases, thereby achieving higher sales across all their channels. Predictive analytics can be used to upsell or cross-sell a customer. Further, predictive analytics helps businesses predict a customer's lifetime value (CLV). CLV helps forecast a customer's discounted value over time by analyzing past behavior to determine the most profitable customers over time.
- Further, due to the necessity for real-time processing of vast volumes of RFID data, the use of event stream processing in radio-frequency identification (RFID) event processing applications is quickly rising. RFID tags are connected to items or people and generate a signal that an RFID reader can read. This lets businesses keep track of where goods and people are in real time, which is important for many things like managing the supply chain and keeping people safe.
- According to a survey from Sisense, 50% of companies are utilizing predictive analytics more or much more than before the COVID-19 pandemic, including over 68% of small businesses. For instance, a significant challenge of the COVID-19 pandemic was ensuring that clients felt safe when visiting brick-and-mortar stores. With the help of business intelligence tools, social networking platforms, and customer relationship management (CRM) systems, companies could get direct feedback from customers and take the right steps to ensure everyone's health and safety.
- There is a significant increase in the requirement for data analytics and data visualization tools. For example, according to the IBM Quant Crunch, up to 2.72 million jobs require data science skills, making it one of the most in-demand roles across industries. College graduates from the MIS and CS departments know little about database modeling or real-world database environments. There are specific IT sciences majors with database classes, let alone business intelligence and analytics courses. There is a lack of exposure to tools and technologies found in the workplace.
Event Stream Processing Market Trends
Increasing Adoption of the Internet of Things (IoT) and Smart Devices
- According to a recent Oracle survey, enterprise IoT adopters are prepared to take an easier route. Nearly two-thirds (64%) of the 800 IoT decision-makers surveyed said they would choose an "off-the-shelf" IoT solution over a custom-built one, showing a shift in how businesses purchase IoT products. Additionally, 75% of respondents want the connection baked into or packaged by the solution provider, and 70% want providers to provide data and analytics capabilities as part of a complete solution. The results show that there is a growing need for a simple way to add IoT capabilities that speeds up the time it takes to get value from them.
- Moreover, by this year, there will be close to 30 billion network-connected devices and connections, up from 18.4 billion in 2018, predicts Cisco's Annual Internet Report. By the end of the current year, IoT devices will make up 50% (14.7 billion) of all networked devices, up from 33% (6.1 billion) in 2018.
- According to the Microsoft IoT Signals report, the United States leads the pack with 27% of projects in the usage phase, followed by Spain (22%), and Australia (18%). In terms of accelerating IoT adoption, the US is far ahead of the rest of the world: 78% of US firms intend to increase their IoT usage over the next two years. However, only 53% of By this year, 51% of German businesses and 51% of Japanese businesses planned to increase utilization. This can be due to the more conservative technological adoption in the German and Japanese markets.
- According to Gallup's annual Health and Healthcare survey, 90% of American consumers said they are currently using a wearable fitness tracker, and the same percentage stated that they currently use a mobile health application. By combining the present use with the percentages of Americans that claim, in the past, they have used such devices, it becomes clear that, at some point, one in three Americans used a fitness tracker such as a wristband or smartwatch (34%), or tracked their health statistics on a phone or tablet application (32%).
- Digital assistance combined with AI allows users to deploy smart devices hands-free and more efficiently, dramatically influencing buyer preferences. With the rise of digital assistants such as Alexa, Google Assistant, Siri, and Bixby, smart devices can now be controlled and managed via voice commands. The developing features of these digital assistants, such as Bluetooth speaker control and hands-free channel surfing, are driving the market for smart home gadgets. Buyers also choose customized devices for their ease and improved user experience.
North America is Expected to Hold a Large Share of the Market
- North America is expected to hold the largest market size and dominate the ESP market during the forecast period. The fact that there are a lot of ESP vendors in the area is due to their early adoption of new technologies and high adoption rates, as well as their investments in research and development to improve their event-based offerings.
- The rise in demand for event stream processing is pushing firms in the region to provide new solutions to capture market share. For example, IBM Event Streams is an IBM Cloud Pak for integration capabilities. It gives enterprises access to corporate data via event streams, allowing them to gain insights from event-based data and detect and take action in real time and at scale. The IBM differentiators mentioned were the ability to control event endpoints alongside API administration.
- In February last year, Express Analytics, a US-based data analytics firm, announced that it would enter the Indian market as part of its global expansion strategy, offering artificial intelligence (AI) and machine learning (ML)-based predictive analytics services to companies in the technology, telecom, banking, advertising, and retail industries, as well as the public sector. In addition, the company has made a strategic deal with Delhi-based Mavcomm Advisory to expand its portfolio in the fast-changing digital Indian market.
- The cloud segment in the United States is witnessing several partnership activities. For instance, HCL Technologies, a global technology-oriented company, announced the extension of its partnership with Google Cloud to bring HCL's Actian portfolio offering, Actian Avalanche, to Google Cloud. This hybrid cloud data warehouse is proposed to improve an enterprise's operational analytics workload. Avalanche also offers a business intelligence and analytics platform with Google Cloud and helps popular SaaS and enterprise applications deliver a comprehensive solution that is easy to deploy and consume.
- With increasing numbers of customers switching to digital channels and the high cost of a physical branch network, digital-only banking entities are proliferating. While few financial institutions are launching digital-only banks to collect deposits, others use digital platforms to provide lending, investing, and specialty services. In both cases, the focus is on coming up with new ideas, making the customer experience better, and giving the customer more value. This is only possible with customer data and event stream processing.
Event Stream Processing Industry Overview
The global event stream processing market is moderately competitive owing to the presence of multiple players. The players in the market are adopting strategies like product innovation, mergers, and acquisitions in order to expand their product portfolios, expand their geographic reach, and primarily to stay competitive in the market.
In October 2022, RisingWave Labs, a business developing a platform for data stream processing, announced a Series A fundraising round of USD 36 million headed by Yunqi Partners, unidentified corporate partners, and angel investors. The money, which brings RisingWave's total investment to more than USD 40 million, will be used to expand the startup's business operations in preparation for the launch of RisingWave Cloud, a new cloud service, in the next few years.
In March 2022, Quine, created by thatDot, will be an open-source streaming graph solution designed for high-volume event processing. Quine, according to thatDot, mixes graph data and streaming technologies to enable the building of real-time, complicated event processing processes at scale. Developing an event-driven microservice for stream processing is a difficult endeavor that combines complex difficulties from the database and distributed systems domains. Consensus, concurrency, transactional logic, clustering behavior, fault tolerance, scalability, balancing read and write performance trade-offs, and other features are all included.
Additional Benefits:
- The market estimate (ME) sheet in Excel format
- 3 months of analyst support
TABLE OF CONTENTS
1 INTRODUCTION
- 1.1 Study Assumptions and Market Definition
- 1.2 Scope of the Study
2 RESEARCH METHODOLOGY
3 EXECUTIVE SUMMARY
4 MARKET DYNAMICS
- 4.1 Market Overview
- 4.2 Market Drivers
- 4.2.1 Increasing Adoption of the Internet of Things (IoT) and Smart Devices
- 4.2.2 Increasing Need to Analyze Large Volumes of Data From Diverse Sources
- 4.3 Market Restraints
- 4.3.1 Concerns Associated with Data Security and Privacy
- 4.4 Porter's Five Forces Analysis
- 4.4.1 Bargaining Power of Suppliers
- 4.4.2 Bargaining Power of Buyers
- 4.4.3 Threat of New Entrants
- 4.4.4 Threat of Substitute Products
- 4.4.5 Intensity of Competitive Rivalry
5 MARKET SEGMENTATION
- 5.1 Deployment Type
- 5.1.1 Cloud
- 5.1.2 On-premise
- 5.2 Component
- 5.2.1 Solutions (Software & Platforms)
- 5.2.2 Services
- 5.3 Application
- 5.3.1 Fraud Detection
- 5.3.2 Algorithmic Trading
- 5.3.3 Process Monitoring
- 5.3.4 Predictive Maintenance
- 5.3.5 Sales and Marketing
- 5.4 End-user Vertical
- 5.4.1 IT & Telecommunications
- 5.4.2 BFSI
- 5.4.3 Manufacturing
- 5.4.4 Retail & E-commerce
- 5.4.5 Energy & Utilities
- 5.4.6 Other End-user Verticals
- 5.5 Geography
- 5.5.1 North America
- 5.5.2 Europe
- 5.5.3 Asia-Pacific
- 5.5.4 Latin America
- 5.5.5 Middle-East and Africa
6 COMPETITIVE LANDSCAPE
- 6.1 Company Profiles
- 6.1.1 IBM Corporation
- 6.1.2 Microsoft Corporation
- 6.1.3 Google Inc.
- 6.1.4 Oracle Corporation
- 6.1.5 Amazon Web Services Inc.
- 6.1.6 Salesforce
- 6.1.7 Redhat
- 6.1.8 SAP SE
- 6.1.9 TIBCO
- 6.1.10 Hazelcast IMDG
- 6.1.11 SAS
- 6.1.12 Confluent, Inc.
- 6.1.13 Hitachi Vantara
- 6.1.14 Informatica
