
|
시장보고서
상품코드
1631569
미국의 화력발전 : 시장 점유율 분석, 산업 동향 및 통계, 성장 예측(2025-2030년)US Thermal Power - Market Share Analysis, Industry Trends & Statistics, Growth Forecasts (2025 - 2030) |
||||||
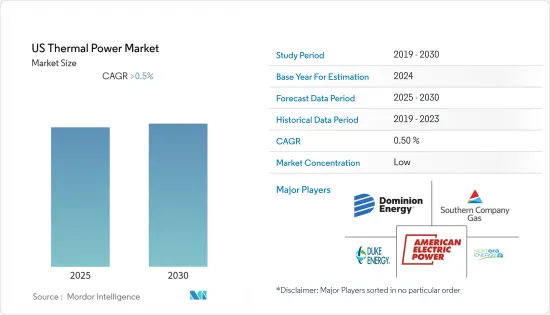
미국의 화력발전 시장은 예측 기간 동안 0.5% 이상의 CAGR을 기록할 것으로 예상됩니다.
COVID-19의 발생은 전력 수요 감소로 인해 시장에 악영향을 미쳤습니다. 현재 시장은 전염병이 발생하기 전 수준으로 회복되고 있습니다.
미국 화력발전 시장은 지난 10년간의 천연가스 가격 하락이 견인할 것으로 예상됩니다. 또한, 민간 기업 및 일부 주 정부의 화력발전소에 대한 투자 증가도 예측 기간 동안 미국 화력발전 시장을 견인할 것으로 예상됩니다.
그러나 재생에너지의 가격 하락으로 경제적으로 실행 가능한 청정 대체 에너지가 제공되고 있으며, 이는 시장 성장을 억제할 것으로 예상됩니다.
화력발전 프로젝트의 효율성 향상과 유해배출물 감소는 향후 새로운 시장을 개척할 가능성이 높습니다.
미국의 화력발전 시장 동향
천연가스가 시장을 독점할 것으로 예상
- 천연가스는 가장 깨끗한 연료 중 하나이며, 산업 규모에서 경제적으로 전력을 공급할 수 있습니다. 미국에서는 이미 가스 화력 발전이 석탄 화력 발전을 대체하기 시작했으며 향후 수십 년 내에 완전히 대체될 것으로 예상됩니다. 재생에너지에 대한 투자는 크게 증가할 것으로 예상되지만, 가스 화력 발전이 제공하는 유연성은 앞으로도 계속 수요가 있을 것으로 예상됩니다.
- 천연가스 화력발전소의 가장 큰 원동력 중 하나는 풍력이나 태양광과 같은 재생에너지의 신뢰성이 낮을 때 백업 전원으로 활용하는 것입니다. 천연가스 화력 발전소는 단시간에 가동을 시작할 수 있어 전력망의 신뢰성을 높일 수 있습니다.
- 2021년, 천연가스는 미국에서 가장 큰 발전원이 될 것으로 예상됩니다. 천연가스 발전량은 1,693.8 테라와트시(TWh)로 전체 발전량의 38.4%를 차지합니다.
- 미국의 셰일 오일 및 가스 생산량이 크게 증가하여 미국의 세계 에너지 공급망에 대한 의존도가 크게 감소했습니다. 천연가스 가격 하락은 천연가스 화력 발전 시장의 성장을 더욱 촉진하고 있습니다.
따라서, 위의 관점에서 볼 때, 예측 기간 동안 천연가스 부문이 시장 성장을 주도할 가능성이 높습니다.
화력발전에 대한 투자 증가가 시장을 견인할 것으로 전망
- 미국에서는 주마다 화력발전소 설립에 대한 경로가 다릅니다. 예를 들어, 캘리포니아주는 천연가스가 주류를 이루고 있지만, 캘리포니아주는 전력회사들이 천연가스 발전소를 재생에너지와 다른 자원으로 대체할 것을 촉구하고 있습니다. 중서부 지역과 같은 다른 주들은 에너지 수요에 대해 보다 천연가스 기반의 접근 방식을 취하고 있습니다.
- 2021년 석탄, 천연가스, 석유 등 에너지원은 국가 총 발전량의 약 63%를 차지했습니다. 이 나라의 발전 에너지원 구성은 특히 최근 몇 년 동안 시간이 지남에 따라 변화하고 있습니다.
- 석탄 화력 발전 용량의 점유율은 점차 감소하고 있지만, 가스 화력 발전소의 증가로 인해 예측 기간 동안 중국 전체 화력 발전 용량이 증가할 것으로 예상됩니다.
- 미시간주 남서부 지역에서 2022년 7월에 천연가스 화력발전소가 가동되기 시작했습니다. 이 프로젝트의 비용은 11억 달러로 Kiewit Corporation이 건설하고 General Electric Company의 설비를 채택했습니다.
- 따라서, 위의 관점에서 볼 때, 화력발전에 대한 투자 증가는 예측 기간 동안 미국 화력발전 시장을 견인할 것으로 예상됩니다.
미국의 화력 발전 산업 개요
미국의 화력발전 시장은 상당히 세분화되어 있습니다. 이 시장의 주요 기업으로는 NextEra Energy, Inc, Dominion Energy, Inc, Duke Energy Corporation, Southern Company, American Electric Power Company, Inc. 등이 있습니다.
기타 혜택
- 엑셀 형식의 시장 예측(ME) 시트
- 3개월간의 애널리스트 지원
목차
제1장 소개
- 조사 범위
- 시장 정의
- 조사 가정
제2장 조사 방법
제3장 주요 요약
제4장 시장 개요
- 소개
- 화력발전 믹스(2022년)
- 화력발전 설비 용량(GW)(2028년)
- 화력발전 양(TWh)(2022년)
- 미국에서 가동중인 화력발전소 수(2022년)
- 2022년까지 실용 화력발전 용량 추가, 폐지, 기존 화력발전 용량 변화
- 2022년까지 화석연료를 주원료로 하는 실용 규모 발전기 용량 요인(% 기반)
- 최근 동향과 개발
- 정부 규제와 시책
- 시장 역학
- 성장 촉진요인
- 성장 억제요인
- 공급망 분석
- PESTLE 분석
제5장 공급원별 시장 내역
- 석탄
- 천연가스
- 석유
제6장 경쟁 구도
- M&A, 합작투자, 제휴, 협정
- 주요 기업의 전략
- Companies Profiles
- NextEra Energy Inc.
- Dominion Energy Inc.
- Duke Energy Corporation
- Southern Company
- American Electric Power Company Inc.
- Exelon Corporation
- Xcel Energy Inc
- Public Service Enterprise Group Inc.
제7장 시장의 가능성과 향후 동향
ksm 25.01.23The US Thermal Power Market is expected to register a CAGR of greater than 0.5% during the forecast period.

The market was negatively impacted by the outbreak of COVID-19 due to a decrease in electricity demand. The market has currently rebounded to pre-pandemic levels.
The United States thermal power market is expected to be driven by things like the price of natural gas going down over the past 10 years. Also, the increasing investments in thermal power plants from private firms and several state governments are expected to drive the United States thermal power market during the forecast period.
However, reducing the price of renewable energy has provided an economically viable cleaner alternative, which is expected to restrain the market's growth.
The improvements in efficiency and decreases in harmful emissions from thermal power projects are likely to open up new markets in the future.
US Thermal Power Market Trends
Natural Gas Expected to Dominate the Market
- Natural gas is among the cleanest fuels and can provide electricity at an industrial scale on an economically sound basis. Gas-fired power generation has already started to displace coal capacity in the country and is expected to replace it entirely in the coming decades. Although investments in renewables are expected to grow significantly, the flexibility afforded by gas-fired power generation is expected to continue to be in demand.
- Among the most significant drivers of the natural gas thermal power plants is their use as backup power for unreliability in renewable sources like wind and solar. Natural gas plants can start running on short notice, which can increase the utility grid's reliability.
- In 2021, natural gas was projected to be the largest source of electricity generation in the United States. The electricity generation from natural gas in the country was 1693.8 terawatt-hours, which accounted for 38.4% of the total electricity generated in the country.
- The country has seen a significant increase in shale oil and gas production, drastically reducing the United States' dependence on global energy supply chains. Reductions in natural gas prices have further aided the growth of the natural gas thermal power market.
Therefore, owing to the above points, the natural gas segment is likely to dominate market growth during the forecast period.
Increasing Investments in Thermal Power Expected to Drive the Market
- In the United States, different states are following different paths to establish thermal power plants. For example, the state of California is dominated by natural gas, but the state is pushing its utilities to replace natural gas power plants with renewables and other resources. Other states, like those in the Midwest, are following a more natural gas-based approach for their energy needs.
- In 2021, sources such as coal, natural gas, and petroleum accounted for around 63% of the country's total electricity generation mix. The mix of energy sources for the country's electricity generation changed over time, especially in recent years.
- Although the share of coal-fired power generation capacity is gradually decreasing, the increasing number of gas-fired power plants is expected to boost the country's overall thermal power generation capacity during the forecast period.
- In July 2022, a natural gas-fired power plant entered service in southwest Michigan. The cost of the project was USD 1.1 billion, and it was built by Kiewit Corporation and features equipment from General Electric.
- Therefore, owing to the above points, increasing thermal power investments are expected to drive the United States thermal power market during the forecast period.
US Thermal Power Industry Overview
The United States thermal power market is moderately fragmented. Some of the key players in this market (in no particular order) include NextEra Energy, Inc.; Dominion Energy, Inc.; Duke Energy Corporation; Southern Company; and American Electric Power Company, Inc.
Additional Benefits:
- The market estimate (ME) sheet in Excel format
- 3 months of analyst support
TABLE OF CONTENTS
1 INTRODUCTION
- 1.1 Scope of the Study
- 1.2 Market Definition
- 1.3 Study Assumptions
2 RESEARCH METHODOLOGY
3 EXECUTIVE SUMMARY
4 MARKET OVERVIEW
- 4.1 Introduction
- 4.2 Thermal Power Generation Mix, 2022
- 4.3 Thermal Power Installed Capacity and Forecast in GW, until 2028
- 4.4 Thermal Power Generation in TWh, till 2022
- 4.5 Number of Thermal Power Plants Operating in the United States, till 2022
- 4.6 Utility-Scale Capacity Additions, Retirements, and Changes to Existing Thermal Power Generation Capacity, 2022
- 4.7 Capacity Factors for Utility-Scale Generators Primarily Using Fossil Fuels, in %, till 2022
- 4.8 Recent Trends and Developments
- 4.9 Government Policies and Regulations
- 4.10 Market Dynamics
- 4.10.1 Drivers
- 4.10.2 Restraints
- 4.11 Supply Chain Analysis
- 4.12 PESTLE Analysis
5 MARKET SEGEMENTATION - BY SOURCE
- 5.1 Coal
- 5.2 Natural Gas
- 5.3 Petroleum
6 COMPETITIVE LANDSCAPE
- 6.1 Mergers and Acquisitions, Joint Ventures, Collaborations, and Agreements
- 6.2 Strategies Adopted by Leading Players
- 6.3 Companies Profiles
- 6.3.1 NextEra Energy Inc.
- 6.3.2 Dominion Energy Inc.
- 6.3.3 Duke Energy Corporation
- 6.3.4 Southern Company
- 6.3.5 American Electric Power Company Inc.
- 6.3.6 Exelon Corporation
- 6.3.7 Xcel Energy Inc
- 6.3.8 Public Service Enterprise Group Inc.
