
|
시장보고서
상품코드
1631618
소수력발전 - 시장 점유율 분석, 산업 동향 및 통계, 성장 예측(2025-2030년)Small Hydropower - Market Share Analysis, Industry Trends & Statistics, Growth Forecasts (2025 - 2030) |
||||||
■ 보고서에 따라 최신 정보로 업데이트하여 보내드립니다. 배송일정은 문의해 주시기 바랍니다.
가격
※ 부가세 별도
한글목차
영문목차
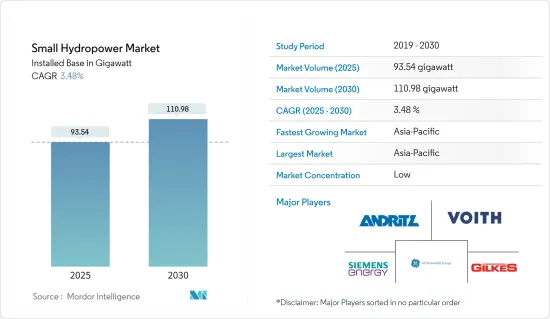
소수력발전 시장 규모는 2025년 93.54기가와트에서 2030년 110.98기가와트로 확대될 것으로 예상되며, 예측 기간(2025-2030년) 동안 연평균 3.48%의 CAGR을 기록할 것으로 전망됩니다.
주요 하이라이트
- 중기적으로는 소수력발전 시장에 대한 투자 증가와 청정 전력 수요 증가 등의 요인이 시장을 견인할 것으로 예상됩니다.
- 한편, 불안정한 에너지 공급은 시장 성장을 크게 저해합니다.
- IoT와 수력발전의 통합과 농촌 지역 생활을 유지하기 위한 소수력발전 댐에 대한 긍정적인 전망은 소수력발전 시장에 큰 기회를 가져올 것으로 예상됩니다.
- 아시아태평양은 높은 전력 수요로 인해 예측 기간 동안 가장 큰 시장이 될 것으로 예상됩니다. 이로 인해 더 많은 성장이 예상됩니다.
소수력발전 시장 동향
1-10MW 부문이 시장을 독점할 것으로 예상
- 예측 기간 동안 소수력발전 시장에서 가장 많은 용량을 차지하는 것은 1-10MW 부문이 될 것으로 예상됩니다. 이 1-10MW 플랜트의 높은 비중은 특히 아시아를 중심으로 한 개발도상국의 농촌 전기화를 위한 소규모 분산형 프로젝트에서 기인합니다.
- 또한 1-10MW의 소수력발전소의 1kW당 투자비용은 일반적으로 1MW 이하의 발전소보다 낮습니다. 또한 1-10MW의 수력발전소는 수두가 높고 설비 용량이 크다는 장점도 있습니다.
- 인도와 중국과 같은 신흥 경제 국가, 동남아시아 및 우즈베키스탄 지역, 영국과 같은 유럽 국가들은 다른 재생에너지원과 함께 소수력발전 프로젝트에 동등한 우선순위를 부여하고 있습니다.
- 영국 에너지 통계 다이제스트(DUKES)에 따르면, 2013년부터 2023년까지 영국(영국)의 소수력발전량은 지속적으로 증가하고 있으며, 2023년까지 영국은 소수력발전 시설에서 1,377기가와트시의 전력을 사용했습니다. 이 증가율은 예측 기간 동안 지속될 것으로 예상됩니다.
- 또한, 국제재생에너지기구(IRENA)가 개발도상국의 실제 소수력발전 프로젝트를 평가한 결과, LCOE가 0.02-0.10 USD/kWh인 것으로 나타났습니다. 이는 소규모 수력발전이 그리드 전력 공급 및 오프그리드 농촌 전기화 노력에 있어 비용 경쟁력이 높은 대안으로 자리매김하고 있음을 보여줍니다. 많은 신흥국에서 이러한 시나리오에 따라 소수력발전 프로젝트가 크게 발전하고 있습니다.
- 예를 들어, 20242년 4월 케냐의 국영 발전회사인 케냐 발전회사(KenGen)는 자격을 갖춘 컨설턴트들의 관심 표명을 모집했습니다. 이 프로젝트는 신규 소수력발전소 개발을 위한 사전 타당성 조사 수행과 기존 발전소 개보수 및 재개발 가능성 평가에 초점을 맞추고 있습니다.
- 따라서, 위의 요인으로 인해 예측 기간 동안 1-10MW 용량의 부문이 세계 소수력발전 시장을 독점할 것으로 보입니다.
아시아태평양이 시장을 독점할 것으로 예상
- 아시아태평양은 최근 몇 년 동안 소수력발전(SHP) 시장을 독점하고 있으며, 예측 기간 동안 그 지배력을 유지할 가능성이 높으며, 2023년 현재 아시아태평양은 10MW까지 소수력발전의 설치 용량과 잠재력이 가장 큰 지역으로 남아 있습니다.
- 인도, 중국 등 주요 국가들은 다른 재생에너지와 함께 소수력발전 프로젝트에 동등한 우선순위를 부여하고 있습니다. 예를 들어, 2016년 인도 공과대학 룰루키 학교는 소수력발전의 잠재력을 평가하였습니다. 그 결과에 따르면, 소수력발전의 잠재력은 7,133개 지역에 7,133MW에 달하는 것으로 추정됩니다. 이 평가에는 강 유역, 운하, 댐에 의한 프로젝트가 포함됩니다.
- 2024년 3월 현재 인도의 소수력발전(SHP)의 총 설비용량은 중앙전력청(CEA)의 보고에 따르면 5,003.25MW에 달하며, 2023-24년 SHP 발전소의 발전량은 94억 8,504만 MU(단위)에 달합니다.
- 또한, 베트남은 2021년에 전력개발계획8(PDP8)을 발표하여 2045년까지 재생에너지 비율을 75%까지 끌어올리는 것을 목표로 하고 있습니다. 소수력발전의 총 발전 용량은 2025년 4,800MW, 2030년 5,000MW, 2045년 6,000MW에 육박하는 것을 목표로 하고 있습니다. 정부는 전력 부문에 130억 달러의 투자를 계획하고 있으며, 수력발전은 총 설비용량의 17.7%-19.5%를 차지할 것입니다.
- 또한, 이 지역에서는 소규모 수력발전 프로젝트 개발이 활발히 진행되고 있습니다. 예를 들어, 2024년 1월 메갈리아 주 정부는 ONGC Tripura Power Company Ltd(OTPC)와 양해각서(MOU)를 체결하여 메갈리아의 방대한 수력발전 잠재력을 활용하기 위한 전략적 이니셔티브를 수립했습니다. 이 MOU는 펌프 저장 수력발전 프로젝트, 크고 작은 수력발전 벤처, 부유식 태양광발전 프로젝트와 같은 혁신적인 솔루션 구축과 같은 야심찬 목표를 설정하고 있습니다.
- 따라서 위의 요인으로 인해 예측 기간 동안 아시아태평양이 세계 소수력발전 시장을 장악할 것으로 예상됩니다.
소수력발전 산업 개요
세계 소수력발전 시장은 세분화되어 있습니다. 주요 참여 기업(무순)으로는 Andritz AG, Voith GmbH &Co.KGaA, Siemens Energy AG, GE Renewable Energy, Gilbert Gilkes &Gordon Ltd. 등이 있습니다.
기타 혜택
- 엑셀 형식의 시장 예측(ME) 시트
- 3개월간 애널리스트 지원
목차
제1장 소개
- 조사 범위
- 시장 정의
- 조사 가정
제2장 주요 요약
제3장 조사 방법
제4장 시장 개요
- 소개
- 2029년까지 설치 용량과 예측
- 소수력발전 설비 용량의 주요 지역별 점유율(2023년)
- 파이프라인과 향후 소수력발전 프로젝트
- 최근 동향과 개발
- 정부 규제와 시책
- 시장 역학
- 성장 촉진요인
- 깨끗하고 지속가능한 전력 수요 급증
- 성장 억제요인
- 불안정한 에너지 공급
- 성장 촉진요인
- 공급망 분석
- Porter's Five Forces 분석
- 공급 기업의 교섭력
- 소비자의 협상력
- 신규 참여업체의 위협
- 대체품의 위협
- 경쟁 기업 간의 경쟁 강도
제5장 시장 세분화
- 발전용량
- 1MW 이하
- 1-10MW
- 용도
- 전력 인프라
- 토목공사
- 기타
- 지역
- 북미
- 미국
- 캐나다
- 기타 북미
- 유럽
- 독일
- 영국
- 프랑스
- 이탈리아
- 스페인
- 북유럽
- 터키
- 러시아
- 기타 유럽
- 아시아태평양
- 중국
- 인도
- 일본
- 한국
- 말레이시아
- 태국
- 베트남
- 기타 아시아태평양
- 중동 및 아프리카
- 사우디아라비아
- 아랍에미리트
- 나이지리아
- 이집트
- 남아프리카공화국
- 기타 중동 및 아프리카
- 남미
- 브라질
- 아르헨티나
- 콜롬비아
- 기타 남미
- 북미
제6장 경쟁 구도
- M&A, 합작투자, 제휴, 협정
- 주요 기업의 전략
- 기업 개요
- Voith GmbH & Co. KGaA
- Andritz AG
- GE Renewable Energy
- Siemens Energy AG
- Gilbert Gilkes & Gordon Ltd.
- Toshiba Energy Systems & Solutions Corporation
- PJSC RusHydro
- FLOVEL Energy Private Limited
- Natel Energy, Inc.
- Kolektor Group
- List of Other Prominent Players
- 시장 순위 분석
제7장 시장 기회와 향후 동향
- IoT와 수력발전의 융합과 소수력발전 댐에 대한 긍정적인 전망
The Small Hydropower Market size in terms of installed base is expected to grow from 93.54 gigawatt in 2025 to 110.98 gigawatt by 2030, at a CAGR of 3.48% during the forecast period (2025-2030).

Key Highlights
- Over the medium term, factors like increasing investment in the small hydropower market and increasing demand for clean electricity are expected to drive the market.
- On the other hand, an unstable energy supply significantly hinders market growth.
- Nevertheless, integrating IoT with hydropower and the positive outlook toward small hydropower dams to sustain lives in rural communities are expected to create enormous opportunities for the Small Hydropower Market.
- Asia-Pacific is expected to be the largest market in the forecast period due to the high demand for electricity in the region. This will facilitate further growth.
Small Hydropower Market Trends
The 1-10 MW Segment Expected to Dominate the Market
- During the forecast period, the 1-10 MW segment is expected to be the most abundant small hydropower market in capacity. This higher proportion of 1-10 MW plants can be attributed to small-scale decentralized projects for rural electrification deployed in developing countries, particularly in Asia.
- Further, the investment costs per kW for small hydropower plants in the 1 - 10 MW range are generally lower than those for plants under 1 MW. The 1 - 10 MW plants also benefit from a higher head and greater installed capacity.
- Developing economies, such as India and China, regions in Southeast Asia and Uzbekistan, and countries in Europe, like the United Kingdom, are giving equal priority to small hydropower projects along with other renewable energy sources.
- According to Digest of UK Energy Statistics (DUKES), From 2013 to 2023, the United Kingdom (UK) saw a consistent rise in electricity generation from small-scale hydro sources. By 2023, the UK harnessed 1,377 gigawatt hours of electricity from its small hydropower facilities. This increase in growth rate is expected to continue during the forecasted period.
- Moreover, the International Renewable Energy Agency's (IRENA) evaluation of several real-world small hydropower projects in developing countries revealed an LCOE range of USD 0.02 to USD 0.10/kWh. This positions small hydro as a highly cost-competitive choice for grid electricity supply and off-grid rural electrification initiatives. Many developing countries witnessed significant developments in small hydropower projects in such a scenario.
- For instance, in April 20242, Kenya Electricity Generating Company (KenGen), the state power producer of Kenya, called for expressions of interest from qualified consultants. The focus is on conducting pre-feasibility studies for the development of new small hydropower plants and assessing the potential rehabilitation and redevelopment of existing ones.
- Therefore, based on the abovementioned factors, the 1-10 MW capacity segment will dominate the small global hydropower market during the forecast period.
Asia-Pacific Expected to Dominate the Market
- The Asia-Pacific region has dominated the small hydropower (SHP) market in recent years and will likely maintain its dominance during the forecast period. As of 2023, Asia-Pacific continues to have the largest installed capacity and potential for small hydropower up to 10 MW.
- Major countries such as India and China are giving equal priority to small hydropower projects along with other renewable energy sources. For instance, in 2016, the Indian Institute of Technology, Roorkee, conducted an assessment of the potential for Small Hydropower. According to their findings, Small Hydropower has an estimated potential of 21,133 MW, spread across 7,133 identified sites. This assessment encompasses Run-of-River, Canal-based, and Dam-toe projects.
- As of March 2024, the total installed capacity for small-hydro power (SHP) in India reached 5,003.25 MW, as reported by the Central Electricity Authority (CEA). In the fiscal year 2023-24, SHP plants generated 9,485.04 million units (MUs).
- Furthermore, Vietnam published Power Development Plan 8 (PDP8) in 2021, which targets a share of 75% for renewable energy by 2045. The total capacity of small hydropower sources is targeted to reach 4,800 MW in 2025, 5,000 MW in 2030, and nearly 6,000 MW by 2045. The government plans to invest USD 13 billion in the power sector, and hydropower would account for 17.7% -19.5% of the total installed capacity.
- Further, the region witnessed significant developments in small-scale hydro projects. For instance, in January 2024, the government of Meghalaya signed a Memorandum of Understanding (MOU) with ONGC Tripura Power Company Ltd (OTPC), marking a strategic initiative to tap into the state's vast hydropower potential. The MOU sets ambitious goals, including establishing a Pump Storage Hydro Power Project, various large and small-scale hydroelectric power ventures, and innovative solutions like floating solar projects.
- Therefore, based on the abovementioned factors, Asia-Pacific is expected to dominate the global small hydropower market during the forecast period.
Small Hydropower Industry Overview
The global small hydropower market is fragmented. Some major players (in no particular order) include Andritz AG, Voith GmbH & Co. KGaA, Siemens Energy AG, GE Renewable Energy, and Gilbert Gilkes & Gordon Ltd., among others.
Additional Benefits:
- The market estimate (ME) sheet in Excel format
- 3 months of analyst support
TABLE OF CONTENTS
1 INTRODUCTION
- 1.1 Scope of the Study
- 1.2 Market Definition
- 1.3 Study Assumptions
2 EXECUTIVE SUMMARY
3 RESEARCH METHODOLOGY
4 MARKET OVERVIEW
- 4.1 Introduction
- 4.2 Installed Capacity and Forecast, till 2029
- 4.3 Small Hydropower Installed Capacity Share, by Major Region, 2023
- 4.4 Small Hydropower Projects in Pipeline and Upcoming
- 4.5 Recent Trends and Developments
- 4.6 Government Policies and Regulations
- 4.7 Market Dynamics
- 4.7.1 Drivers
- 4.7.1.1 Surge in Demand for Clean and Sustainable Power
- 4.7.2 Restraints
- 4.7.2.1 Unstable Energy Supply
- 4.7.1 Drivers
- 4.8 Supply Chain Analysis
- 4.9 Porter's Five Forces Analysis
- 4.9.1 Bargaining Power of Suppliers
- 4.9.2 Bargaining Power of Consumers
- 4.9.3 Threat of New Entrants
- 4.9.4 Threat of Substitute Products and Services
- 4.9.5 Intensity of Competitive Rivalry
5 MARKET SEGMENTATION
- 5.1 Capacity
- 5.1.1 Up to 1 MW
- 5.1.2 1-10 MW
- 5.2 Application
- 5.2.1 Power Infrastructure
- 5.2.2 Civil Works
- 5.2.3 Other Applications
- 5.3 Geography
- 5.3.1 North America
- 5.3.1.1 United States
- 5.3.1.2 Canada
- 5.3.1.3 Rest of North America
- 5.3.2 Europe
- 5.3.2.1 Germany
- 5.3.2.2 United Kingdom
- 5.3.2.3 France
- 5.3.2.4 Italy
- 5.3.2.5 Spain
- 5.3.2.6 Nordic
- 5.3.2.7 Turkey
- 5.3.2.8 Russia
- 5.3.2.9 Rest of Europe
- 5.3.3 Asia-Pacific
- 5.3.3.1 China
- 5.3.3.2 India
- 5.3.3.3 Japan
- 5.3.3.4 South Korea
- 5.3.3.5 Malaysia
- 5.3.3.6 Thailand
- 5.3.3.7 Vietnam
- 5.3.3.8 Rest of Asia-Pacific
- 5.3.4 Middle East and Africa
- 5.3.4.1 Saudi Arabia
- 5.3.4.2 United Arab Emirates
- 5.3.4.3 Nigeria
- 5.3.4.4 Egypt
- 5.3.4.5 South Africa
- 5.3.4.6 Rest of Middle East and Africa
- 5.3.5 South America
- 5.3.5.1 Brazil
- 5.3.5.2 Argentina
- 5.3.5.3 Colombia
- 5.3.5.4 Rest of South America
- 5.3.1 North America
6 COMPETITIVE LANDSCAPE
- 6.1 Mergers and Acquisitions, Joint Ventures, Collaborations, and Agreements
- 6.2 Strategies Adopted by Leading Players
- 6.3 Company Profiles
- 6.3.1 Voith GmbH & Co. KGaA
- 6.3.2 Andritz AG
- 6.3.3 GE Renewable Energy
- 6.3.4 Siemens Energy AG
- 6.3.5 Gilbert Gilkes & Gordon Ltd.
- 6.3.6 Toshiba Energy Systems & Solutions Corporation
- 6.3.7 PJSC RusHydro
- 6.3.8 FLOVEL Energy Private Limited
- 6.3.9 Natel Energy, Inc.
- 6.3.10 Kolektor Group
- 6.4 List of Other Prominent Players
- 6.5 Market Ranking Analysis
7 MARKET OPPORTUNITIES AND FUTURE TRENDS
- 7.1 Integrating IoT with Hydropower and the Positive Outlook toward Small Hydropower Dams
