


|
시장보고서
상품코드
1636119
남미의 공기질 모니터링 시장 - 점유율 분석, 산업 동향과 통계, 성장 예측(2025-2030년)South America Air Quality Monitoring - Market Share Analysis, Industry Trends & Statistics, Growth Forecasts (2025 - 2030) |
||||||
■ 보고서에 따라 최신 정보로 업데이트하여 보내드립니다. 배송일정은 문의해 주시기 바랍니다.
가격
※ 부가세 별도
한글목차
영문목차
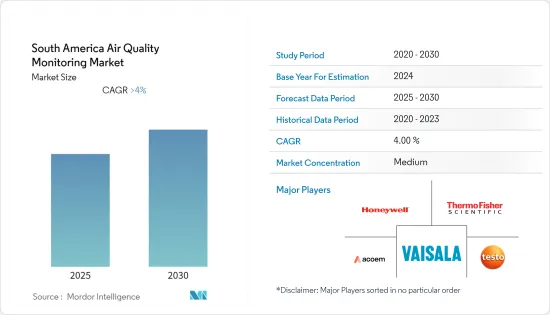
남미의 공기질 모니터링 시장은 예측 기간 중에 4% 이상의 CAGR로 추이할 전망입니다.
COVID-19는 시장에 부정적인 영향을 미쳤습니다. 현재 시장은 유행 이전 수준에 도달했습니다.
주요 하이라이트
- 중기적으로는 대기질에 대한 우려의 고조와 많은 나라에서의 산업화의 확대에 의해 시장은 곧 가속합니다.
- 한편, 재생 가능 에너지와 원자력 에너지와 같은 보다 깨끗한 에너지원의 보급은 제품 수요의 꾸준한 감소에 의해 시장의 성장을 방해할 것으로 예상됩니다.
- 공기질 모니터링 시스템의 기술적 진보는 이 기술을 통한 장비 및 용도 개발에 큰 기회를 제공합니다.
- 브라질이 시장을 독점하고 있어 예측기간 중에 가장 높은 CAGR로 추이할 가능성이 높습니다.
남미의 공기 품질 모니터링 시장 동향
실내 모니터 부문이 현저한 성장을 이루
- 실내 공기 품질 모니터링은 공기 중 입자, 가스 및 화학에 대한 지속적인 데이터를 수집합니다. 이러한 데이터는 추세와 문제 영역을 식별하고 필요한 조정을 위해 수집됩니다. 시설 관리자와 기술자는 공기 감염의 위험을 줄일뿐만 아니라 공기 품질 모니터링을 도입하여 어느 지역이 거주자의 건강에 영향을 미치는지 판단하고 곰팡이 번식과 같은 이상을 검출할 수 있습니다.
- 실외 공기와는 달리 실내 공기는 끊임없이 순환하는 경향이 있으므로 오염 물질이 이러한 좁은 공간에 축적되어 갇혀 있습니다. 사람은 실내에서 90%의 시간을 보냅니다. 실내 공기 품질(IAQ)은 인간의 건강, 편안함 또는 성능에 영향을 미칠 수 있는 건물 내의 다양한 환경 요인을 의미합니다. 오염물질의 농도, 온도, 습도 등 여러 요인이 실내 공기의 질에 영향을 미칩니다. 실내 공기의 질을 측정하면 실내 공기의 질 저하로 인한 건강 위험을 줄이고 사람들이 보다 안전하고 조화로운 환경에서 생활할 수 있습니다.
- 실내 공기 오염으로 인해 주민들은 단기적으로나 장기적으로 심각한 건강 위험에 직면하게 됩니다. 실내 공기의 품질 저하는 눈, 코, 인후 염증, 두통, 메스꺼움, 현기증, 피로감과 같은 증상을 유발할 수 있습니다. 경우에 따라 급성 및 만성 호흡기 질환으로 이어질 수 있습니다.
- 직장의 실내 공기의 질이 나쁜 결과 생산성이 저하되어 결근이 발생하여 소송으로 발전하기도 합니다. 고용주는 실내 공기의 질을 효과적으로 모니터링하고 유해한 화학물질과 오염물질이 직장에 침입하는 것을 방지함으로써 직원의 건강한 노동 환경을 유지할 수 있습니다. 그 결과 고용주 정착률이 높아지고 생산성이 향상되고 결근이 감소했습니다.
- 아르헨티나에서는 도시화의 추세가 강합니다. 아르헨티나의 도시 인구 중 47.6%가 부에노스 아이레스를 최대로 하는 불과 8개의 집적지에 집중하고 있습니다.
- 칠레는 2030년까지 블랙 카본 배출량을 2016년 대비 25% 삭감하는 양적 목표를 내세운 최신 국가 결정 공헌(NDC)을 제출했습니다. 장기 전략에 따르면 칠레는 국가 공기질 모니터링 시스템과 블랙 카본을 모니터링하는 기기를 확립했습니다.
- 이러한 신흥국 시장의 개척은 예측 기간 중 실내 모니터 시장을 견인할 것으로 기대됩니다.
시장을 독점하는 브라질
- 2022년 현재 남미에서 가장 인구가 많은 국가는 브라질로, 2013년 처음으로 2억 100만명을 돌파해 중국, 인도, 미국, 인도네시아에 이어 지구상에서 5번째로 인구의 많은 나라가 되고 있습니다. 브라질은 이전의 예측을 웃도는 높은 성장률을 기록하고 있지만, 2060년에는 인구는 2억 1,800만명 정도로 안정될 것으로 예상되고 있습니다.
- 대기질이 악화의 일도를 따르고 있는 것은 급격한 인구 증가, 공업화, 삼림 벌채, 경제 성장, 자동차 배기 가스 등이 원인입니다. 국내에서 계속 증가하는 인구는 온실 효과 가스의 배출을 가속시켜 결과, 대기의 질에 악영향을 미칩니다. 이 때문에 동국에서는 공기질 모니터링 수요가 높아지고 있습니다.
- 브라질에서는 스마트 시티도 지난 10년간 중요한 동향이 되었고, 최근 몇 년동안 크게 성장했습니다. 브라질에서는 도시화의 경향이 강하고, 2021년까지 인구의 87% 이상이 도시에 거주하게 됩니다.
- 스마트시티의 중요한 특징은 지속가능한 환경을 제공하는 것입니다.
- 2021년 브라질의 전력 소비량은 496.3TWh로 2020년에 비해 약 4% 증가했습니다.
- 대부분의 경우 화력 발전소는 석탄을 태우고 발전하고 있습니다.이 석탄 화력 발전소는 대기 오염 기준을 위반하고 있으며 대기 오염이 큰 문제입니다. 대기 오염 수준을 억제하기 위해 엄격한 배출 규제를 수립하고 공기질 모니터링 시장에 큰 영향을 미치고 있습니다. 따라서 석유, 가스 및 발전 플랜트는 오염 물질의 수준을 관리하고 모니터링하기 위해 대기질 모니터를 배포하고 이러한 규제를 준수해야 합니다.
- 브라질의 총 설비 용량은 173.2GW입니다. 84%가 재생 가능 에너지로 주로 수력 발전입니다. 광업 및 에너지부(MME)에 따르면 2025년까지 브라질은 15GW의 집중형 발전 용량을 추가할 예정입니다.
- 상기 요인은 조사 기간 중 공기질 모니터링 시장 수요를 촉진할 것으로 예상됩니다.
남미의 공기질 모니터링 산업 개요
남아메리카의 공기질 모니터링 시장은 적당히 부문화되어 있습니다.
기타 혜택
- 엑셀 형식 시장 예측(ME) 시트
- 3개월간의 애널리스트 서포트
목차
제1장 서론
- 조사 범위
- 시장의 정의
- 조사의 전제
제2장 주요 요약
제3장 조사 방법
제4장 시장 개요
- 소개
- 2028년까지 시장 규모와 수요 예측(단위: 10억 달러)
- 최근 동향과 개발
- 정부의 규제와 시책
- 시장 역학
- 성장 촉진요인
- 억제요인
- 공급망 분석
- Porter's Five Forces 분석
- 공급기업의 협상력
- 소비자의 협상력
- 신규 진입업자의 위협
- 대체품의 위협
- 경쟁 기업간 경쟁 관계
제5장 시장 세분화
- 제품 유형
- 실내 모니터
- 옥외 모니터
- 오염물질 유형
- 화학제품
- 생물
- 물리적
- 최종 사용자
- 주택과 상업시설
- 발전
- 석유화학
- 기타
- 지역
- 브라질
- 아르헨티나
- 콜롬비아
- 칠레
- 기타 남미
제6장 경쟁 구도
- M&A, 합작사업, 제휴, 협정
- 주요 기업의 전략
- 기업 프로파일
- Honeywell International Inc
- Thermo Fisher Scientific
- Vaisala Oyj
- Ecotech
- Testo SE & Co. KGaA
- Aeroqual Limited
- Clarity Movement Co.
- Oizom Instruments Pvt. Ltd.
- Airthinx, Inc
- Emerson Electric Co
제7장 시장 기회와 앞으로의 동향
JHS 25.01.31The South America Air Quality Monitoring Market is expected to register a CAGR of greater than 4% during the forecast period.

COVID-19 negatively impacted the market. Presently the market reached the pre-pandemic levels.
Key Highlights
- Over the medium term, the market will accelerate shortly due to growing concerns about air quality and the expansion of industrialization across many countries.
- On the other hand, the penetration of cleaner energy sources, such as renewable and nuclear energy, is expected to hinder the market's growth due to a steadily declining demand for the product.
- Nevertheless, technological advancements in air quality monitoring systems provide significant opportunities for developing devices and applications based on the technology. IoT-based equipment, which operates interactively and uses new technologies to communicate and deliver data, is in vogue.
- Brazil dominates the market and will likely witness the highest CAGR during the forecast period. This growth is attributed to the increasing urbanization and industrialization in the country.
South America Air Quality Monitoring Market Trends
Indoor Monitor Segment to Witness Significant Growth
- Continuous data about your air's particles, gases, and chemicals are gathered during indoor air quality monitoring. These data are collected to identify trends and problem areas and make necessary adjustments. In addition to reducing airborne disease risks, facility managers and technicians can introduce air quality monitoring to determine which areas affect occupant well-being and detect anomalies like mold growth.
- In contrast to outdoor air, indoor air tends to be continuously recycled, which causes pollutants to accumulate within these confined spaces and trap them. People spend 90% of their time indoors. Indoor air quality (IAQ) refers to various environmental factors within buildings that can affect human health, comfort, or performance. Several factors contribute to indoor air quality, including pollutant concentrations, temperature, and humidity. Measuring indoor air quality reduces the health risks associated with poor indoor air quality, creating a safer, more harmonious environment for people to live in.
- As a result of indoor air pollution, inhabitants face significant short- and long-term health risks. Poor indoor air quality can lead to symptoms such as irritation of the eyes, nose, and throat, headache, nausea, dizziness, and fatigue. In some cases, acute and chronic respiratory illnesses can result from exposure.
- As a result of poor indoor air quality at the workplace, productivity can be reduced, absenteeism may occur, and litigation may result. Employers can maintain healthy working conditions for their employees by effectively monitoring indoor air quality and preventing harmful chemicals and pollutants from entering the workplace. It resulted in an increase in retention, improved productivity, and a reduction in absenteeism among employers.
- There is a strong urbanization trend in Argentina. In 2021 more than 92% of the population was estimated to live in urban areas. However, 47.6% of Argentina's urban population is concentrated in only eight agglomerations, with Buenos Aires as the largest. The growing urbanization leads to increasing residential and commercial sectors in the country, thus helping to drive the indoor air quality monitoring system market growth.
- Chile submitted an updated Nationally Determined Contribution (NDC) with a quantitative target to reduce black carbon emissions by 25% by 2030 compared to 2016. According to the long-term strategy, Chile established a national air quality monitoring system and instruments to monitor black carbon. It can estimate long-term trends in black carbon concentrations in the atmosphere.
- Such developments are expected to give a thrust to the indoor monitor segment of the market during the forecast period.
Brazil to Dominate the Market
- As of 2022, the most populous country in South America is Brazil, which topped 201 million for the first time in 2013 and is the fifth most populated country on earth after China, India, the United States, and Indonesia. While Brazil is experiencing a high growth rate that outpaced previous predictions, by 2060, its population is expected to stabilize at around 218 million.
- The continuous degradation of air quality is attributed to the rapid increase in human population, industrialization, deforestation, economic growth, and vehicular emissions. The ever-growing population in the country accelerates greenhouse gas emissions, resulting in a negative impact on air quality. It leads to demand for air quality monitoring sales in the country.
- In Brazil, smart cities also became an important trend in the past decade and grew considerably in the last few years. In a nutshell, a smart city involves the application of technologies to improve urban solutions, such as lighting, water treatment, transportation, and leisure. In Brazil, there is a strong trend towards urbanization, with more than 87% of the population residing in cities by 2021.
- An important feature of smart cities is the provision of a sustainable environment. Real-time smart city air monitoring of various environmental parameters allows the authorities to make informed infrastructure and policy planning decisions.
- In 2021, Brazil consumed 496.3 TWh of electricity, an increase of approximately 4% compared to 2020. According to Empresa de Pesquisa Energetica, Brazilian electricity consumption is expected to continue to increase over the next decade, surpassing 582 TWh by 2026.
- In most cases, thermal power plants generate electricity by burning coal. These coal-fired plants violate air pollution standards, causing air pollution to be a major issue. The Brazilian government formulated strict emission regulations to curb the air pollution level caused by industrial areas, greatly affecting the Air Quality Monitoring Market. Therefore, oil & gas and power generation plants must comply with these regulations by deploying air quality monitors to control and monitor the levels of pollutants.
- The total installed capacity of Brazil is 173.2 GW. 84% is from renewable sources, primarily hydropower. 16% of Brazilian electricity comes from thermal resources (coal, gas, oil, nuclear). By 2025, Brazil is expected to add 15 GW of centralized power generation capacity, according to the Ministry of Mines and Energy (MME). A total investment of USD 62 billion is estimated to be made in utilized-scale power generation by 2029, while a total investment of USD 10 billion is estimated for distributed generation within this period.
- The abovementioned factors are expected to drive the air quality monitoring market demand over the study period.
South America Air Quality Monitoring Industry Overview
The South America air quality monitoring market is moderately fragmented. Some of the major players in the market (in no particular order) include Honeywell International Inc, Thermo Fisher Scientific, Vaisala Oyj, Ecotech, and Testo SE & Co. KGaA.
Additional Benefits:
- The market estimate (ME) sheet in Excel format
- 3 months of analyst support
TABLE OF CONTENTS
1 INTRODUCTION
- 1.1 Scope of the Study
- 1.2 Market Definition
- 1.3 Study Assumptions
2 EXECUTIVE SUMMARY
3 RESEARCH METHODOLOGY
4 MARKET OVERVIEW
- 4.1 Introduction
- 4.2 Market Size and Demand Forecast in USD billion, till 2028
- 4.3 Recent Trends and Developments
- 4.4 Government Policies and Regulations
- 4.5 Market Dynamics
- 4.5.1 Drivers
- 4.5.2 Restraints
- 4.6 Supply Chain Analysis
- 4.7 Porter's Five Forces Analysis
- 4.7.1 Bargaining Power of Suppliers
- 4.7.2 Bargaining Power of Consumers
- 4.7.3 Threat of New Entrants
- 4.7.4 Threat of Substitutes Products and Services
- 4.7.5 Intensity of Competitive Rivalry
5 MARKET SEGMENTATION
- 5.1 Product Type
- 5.1.1 Indoor Monitor
- 5.1.2 Outdoor Monitor
- 5.2 Pollutant Type
- 5.2.1 Chemical
- 5.2.2 Biological
- 5.2.3 Physical
- 5.3 End User
- 5.3.1 Residential and Commercial
- 5.3.2 Power Generation
- 5.3.3 Petrochemicals
- 5.3.4 Other End Users
- 5.4 Geography
- 5.4.1 Brazil
- 5.4.2 Argentina
- 5.4.3 Colombia
- 5.4.4 Chile
- 5.4.5 Rest of South America
6 COMPETITIVE LANDSCAPE
- 6.1 Mergers and Acquisitions, Joint Ventures, Collaborations, and Agreements
- 6.2 Strategies Adopted by Leading Players
- 6.3 Company Profiles
- 6.3.1 Honeywell International Inc
- 6.3.2 Thermo Fisher Scientific
- 6.3.3 Vaisala Oyj
- 6.3.4 Ecotech
- 6.3.5 Testo SE & Co. KGaA
- 6.3.6 Aeroqual Limited
- 6.3.7 Clarity Movement Co.
- 6.3.8 Oizom Instruments Pvt. Ltd.
- 6.3.9 Airthinx, Inc
- 6.3.10 Emerson Electric Co
