
|
시장보고서
상품코드
1636234
역률 개선 유닛 : 시장 점유율 분석, 산업 동향 및 통계, 성장 예측(2025-2030년)Global Power Factor Correction Units - Market Share Analysis, Industry Trends & Statistics, Growth Forecasts (2025 - 2030) |
||||||
■ 보고서에 따라 최신 정보로 업데이트하여 보내드립니다. 배송일정은 문의해 주시기 바랍니다.
가격
※ 부가세 별도
한글목차
영문목차
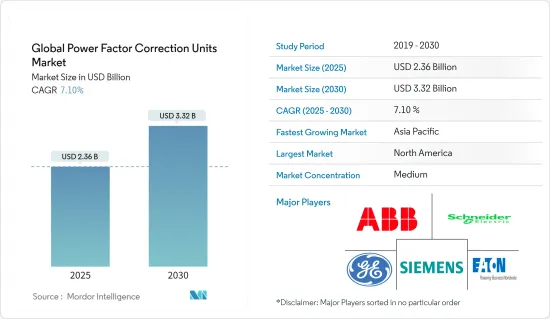
역률 개선 유닛 세계 시장 규모는 2025년에 23억 6,000만 달러로 추정되며, 예측 기간(2025-2030년) 동안 7.1%의 CAGR로 2030년에는 33억 2,000만 달러에 달할 것으로 예상됩니다.
주요 하이라이트
- 중기적으로는 급속한 산업화, 규제 강화, 에너지 효율 기준 등의 요인이 예측 기간 동안 역률 개선 유닛 세계 시장의 가장 큰 촉진요인 중 하나가 될 것으로 예상됩니다.
- 이러한 장치는 복잡한 유지보수 및 기술적 문제를 수반하기 때문에 예측 기간 동안 역률 보정 장치 세계 시장에 위협이 될 수 있습니다.
- 그러나 효율적인 전력 관리를 필요로 하는 스마트 그리드 구축을 위한 지속적인 노력이 이루어지고 있습니다. 이러한 요인은 향후 시장에 몇 가지 기회를 창출할 것으로 예상됩니다.
- 아시아태평양은 예측 기간 동안 가장 높은 연간 성장률을 기록할 것으로 예상되는 지역입니다. 이는 이 지역의 제조업이 성장하고 있으며 풍력발전 설비에 집중하고 있기 때문입니다.
세계 역률 개선 유닛 시장 동향
산업 부문이 성장을 주도
- 세계 산업 환경은 기술 발전, 자동화 발전, 효율성과 생산성에 대한 중요성 증가 등의 요인으로 인해 최근 몇 년 동안 대규모 성장과 확장을 경험하고 있습니다. 이러한 산업의 성장은 압축 공기 파이프 시장에 긍정적인 영향을 미치고 수요를 강화하여 성장 궤도에 박차를 가하고 있습니다.
- 유엔공업개발기구가 발표한 자료에 따르면, 세계 제조업 생산량은 인도, 중국, 말레이시아, 남아프리카공화국 등 신흥 경제국의 제조업 증가에 대한 중요성이 높아짐에 따라 2022년 이후 지속적인 성장세를 보이고 있습니다. 이에 따라 2023년 1분기부터 4분기까지 1.4% 증가하여 전 세계적으로 제조업 생산이 성장하고 있음을 보여주고 있습니다.
- 산업 부문은 철강 제조, 석유화학, 시멘트 제조, 펄프 및 제지 공장 등 에너지 집약형 산업으로 구성되어 있습니다. 이들 산업은 큰 무효전력 수요를 수반하는 대규모 설비를 가동하고 있어 역률 개선 기술의 유력한 후보군으로 꼽힙니다.
- 역률 개선 유닛를 설치함으로써 이러한 시설들은 전기 요금을 크게 절감할 수 있습니다. 또한 역률 개선은 전압 안정성을 향상시키고 전기 인프라에 대한 스트레스를 줄여 고가의 산업 장비의 수명을 연장하고 전기적 문제로 인한 다운타임을 최소화할 수 있습니다.
- 기술 혁신의 중요성이 강조되면서 제조업은 자동화와 디지털화의 새로운 시대가 도래했습니다. 자동화 시스템과 로봇 기술이 점점 더 널리 보급되어 생산 속도를 높이고 업무 효율성을 강화할 수 있게 되었습니다. 이러한 복잡성은 종종 역률 저하로 이어져 제조업체들이 종합적인 전력 품질 솔루션에 투자하도록 유도하고 있습니다.
- 예를 들어, ABB 인도는 2023년 6월 구자라트 주 하지라에 위치한 ArcelorMittal Nippon Steel India의 첨단 철강 냉연 공장(CRM)에 전기화 및 자동화 시스템을 공급하는 계약을 체결했습니다. 이 프로젝트에는 ABB Ability System 800xA 분산형 제어 시스템(DCS)과 관련 장비 및 소모품 공급이 포함됩니다.
- 인더스트리 4.0 패러다임 하에서 산업 공정의 디지털화 및 자동화가 진행됨에 따라 첨단 역률 보정 솔루션에 대한 수요가 증가하고 있습니다. 최신 산업 시설에는 실시간 모니터링, 적응형 보정, 광범위한 에너지 관리 시스템과의 원활한 통합을 갖춘 스마트 역률 보정 장치가 통합되어 있습니다.
- 따라서, 위에서 언급한 바와 같이, 산업 부문은 예측 기간 동안 크게 성장할 것으로 예상됩니다.
아시아태평양이 시장을 장악
- 아시아태평양은 역률 개선 유닛 세계 시장에서 매우 중요한 시장입니다. 이 지역의 특징은 급속한 산업화, 급증하는 에너지 수요, 에너지 효율에 대한 관심의 증가입니다. 이 광활하고 다양한 지역은 빠르게 발전하는 다양한 경제를 포함하고 있으며, 역률 보정 산업에 유리한 시장 시나리오를 제시하고 있습니다.
- 산업화는 아시아태평양에서 역률 개선 유닛를 채택하는 주요 원동력이 되고 있습니다. 이 지역은 자동차, 전자, 섬유, 중공업 등 다양한 분야의 세계 제조 강국이기 때문에 정교한 전력 관리 솔루션이 필요합니다. 이들 국가의 산업 부문이 빠르게 성장함에 따라 역률 개선 유닛에 대한 수요가 크게 증가할 것으로 예상됩니다.
- 예를 들어, 2023 회계연도 인도의 제조업 수출은 전년도(22년도) 4,220억 달러에서 6.03% 증가한 4,474억 6,000만 달러로 사상 최고치를 기록했습니다. 인도 GDP의 17%에 기여하고 2,730만 명 이상의 근로자를 고용하는 제조업은 국가 경제에서 매우 중요합니다. 인도 정부는 다양한 노력과 조치를 통해 2025년까지 제조업의 시장 점유율을 25%까지 끌어올리는 것을 목표로 하고 있습니다.
- 이러한 에너지 다소비 산업은 전력 시스템 최적화, 운영 비용 절감, 엄격한 에너지 효율 규제 준수를 위해 역률 개선 기술에 대한 관심이 높아지고 있습니다. 산업 업그레이드와 첨단 제조 기술의 채택은 신뢰할 수 있는 역률 보정 솔루션의 필요성을 더욱 높이고 있습니다.
- 아시아태평양의 도시화와 인프라 개발은 역률 개선 유닛에 대한 수요 확대에 크게 기여하고 있습니다. 급속한 도시 확장과 산업단지 및 경제특구 설립으로 인해 기존 전력 인프라에 전례 없는 부담이 가중되고 있습니다. 이에 따라 전력 품질 개선과 송전망의 안정성이 중요시되고 있으며, 역률 개선은 송전 손실을 줄이고 전체 전기 계통의 효율을 높이는 데 중요한 역할을 하고 있습니다.
- 예를 들어, 말레이시아 정부는 2023년 10월, 페락 주에 4개의 새로운 산업단지를 설립하기 위해 대규모 투자 계획을 발표했습니다. 그 중 눈에 띄는 것은 탄중 말림의 자동차 하이테크 밸리(AHTV)로, 말레이시아의 자동차 산업을 젊어지게 하는 매우 중요한 움직임으로 설계되었습니다. 예측에 따르면, 이 벤처기업은 향후 10년간 67억 달러라는 엄청난 투자를 유치할 것으로 예상됩니다. 이 계획은 수천 개의 고용 기회를 창출할 뿐만 아니라 말레이시아를 최첨단 자동차 생산의 지역 리더로 자리매김하는 것을 목표로 하고 있습니다.
- 또한, 아시아태평양에서 확산되고 있는 스마트 시티 개념은 지능형 역률 보정 장치를 포함한 첨단 전력 관리 시스템을 도시의 전기 인프라에 필수적인 요소로 통합하고 있습니다.
- 따라서 앞서 언급한 바와 같이, 예측 기간 동안 아시아태평양이 시장을 독점할 것으로 예상됩니다.
세계 역률 개선 유닛 산업 개요
세계 역률 개선 유닛 시장은 절반으로 나뉘어져 있습니다. 이 시장의 주요 기업은 ABB Ltd, Siemens AG, General Electric Company, Schneider Electric SE, Eaton Corporation입니다.
기타 혜택
- 엑셀 형식의 시장 예측(ME) 시트
- 3개월간 애널리스트 지원
목차
제1장 소개
- 조사 범위
- 시장 정의
- 조사 가정
제2장 주요 요약
제3장 조사 방법
제4장 시장 개요
- 소개
- 2029년까지 시장 규모와 수요 예측(단위 : 달러)
- 최근 동향과 개발
- 정부 정책 및 규정
- 시장 역학
- 성장 촉진요인
- 급속한 산업 성장
- 엄격한 규제 기준
- 성장 억제요인
- 유지보수와 기술적 과제
- 성장 촉진요인
- 공급망 분석
- 산업의 매력 - Porter's Five Forces 분석
- 공급 기업의 교섭력
- 소비자의 협상력
- 신규 참여업체의 위협
- 대체품의 위협 제품·서비스
- 경쟁 기업 간의 경쟁 관계
- 투자 분석
제5장 시장 세분화
- 유형
- 액티브 역률 개선 유닛
- 패시브 역률 개선 유닛
- 하이브리드 역률 개선 유닛
- 최종사용자
- 주거용
- 상업용
- 산업용
- 2029년까지 시장 규모·수요 예측(지역별)
- 북미
- 미국
- 캐나다
- 기타 북미
- 유럽
- 독일
- 프랑스
- 영국
- 이탈리아
- 스페인
- 북유럽
- 러시아
- 터키
- 기타 유럽
- 아시아태평양
- 중국
- 인도
- 호주
- 일본
- 한국
- 말레이시아
- 태국
- 인도네시아
- 베트남
- 기타 아시아태평양
- 중동 및 아프리카
- 사우디아라비아
- 아랍에미리트
- 나이지리아
- 이집트
- 카타르
- 남아프리카공화국
- 기타 중동 및 아프리카
- 남미
- 브라질
- 아르헨티나
- 콜롬비아
- 기타 남미
- 북미
제6장 경쟁 구도
- M&A, 합작투자, 제휴, 협정
- 주요 기업의 전략
- 기업 개요
- ABB Ltd
- Schneider Electric SE
- Eaton Corporation
- Siemens AG
- General Electric Company
- Emerson Electric Co.
- Mitsubishi Electric Corporation
- Toshiba Electronic Devices & Storage Corporation
- Crompton Greaves Limited
- L&T Electrical & Automation
- 기타 저명한 기업 리스트
- 시장 순위/점유율(%) 분석
제7장 시장 기회와 향후 동향
- 스마트 그리드 개발
The Global Power Factor Correction Units Market size is estimated at USD 2.36 billion in 2025, and is expected to reach USD 3.32 billion by 2030, at a CAGR of 7.1% during the forecast period (2025-2030).

Key Highlights
- Over the medium term, factors such as rapid industrialization, growing stringent regulations, and standards over energy efficiency are expected to be among the most significant drivers for the global power factor correction units market during the forecast period.
- Complicated maintenance and technical challenges are associated with these units, posing a threat to the global power factor correction units market during the forecast period.
- However, continued efforts are being made toward smart grid deployments, which require efficient power management. This factor is expected to create several opportunities for the market in the future.
- Asia-Pacific is expected to witness significant growth and register the highest annual growth rate during the forecast period. This is due to the region's growing manufacturing industry and focus on wind energy installations.
Global Power Factor Correction Units Market Trends
The Industrial Segment to Witness Growth
- The global industrial landscape has experienced massive growth and expansion in recent years due to the confluence of factors such as technological advancements, increasing automation, and a growing emphasis on efficiency and productivity. This industrial growth has a positive impact on the compressed air pipe market, strengthening its demand and driving its growth trajectory.
- According to the data released by the United Nations Industrial Development Organization, the global manufacturing output has observed consistent growth since 2022 owing to the growing emphasis on increasing the manufacturing industry in developing economies like India, China, Malaysia, South Africa, and various others. This has led to an increase of 1.4% between the first and fourth quarters of 2023, signifying the growing manufacturing output globally.
- The industrial segment comprises energy-intensive industries such as steel manufacturing, petrochemicals, cement production, and pulp and paper mills. These industries operate large-scale equipment with significant reactive power demands, making them prime candidates for power factor improvement technologies.
- By installing power factor correction units, these facilities can substantially reduce their electricity bills, as many utility companies impose penalties for low power factors. Moreover, improved power factor leads to enhanced voltage stability and reduced stress on electrical infrastructure, potentially extending the lifespan of expensive industrial equipment and minimizing downtime due to electrical issues.
- The growing emphasis on innovation has ushered in a new era of automation and digitalization in the manufacturing industry. Automated systems and robotic technologies have become increasingly prevalent, enabling higher production rates and enhanced operational efficiency. This complexity often results in power factor degradation, prompting manufacturers to invest in comprehensive power quality solutions.
- For instance, in June 2023, ABB India secured a contract to provide electrification and automation systems for ArcelorMittal Nippon Steel India's advanced steel cold rolling mill (CRM) in Hazira, Gujarat. The project includes supplying the ABB Ability System 800xA distributed control system (DCS) and associated machinery and supplies.
- As industrial processes become increasingly digitized and automated under the paradigm of Industry 4.0, the demand for sophisticated power factor correction solutions has grown. Modern industrial facilities are integrating smart power factor correction units with real-time monitoring, adaptive correction, and seamless integration with broader energy management systems.
- Therefore, as mentioned above, the industrial segment is expected to grow significantly during the forecast period.
Asia-Pacific to Dominate the Market
- Asia-Pacific is a pivotal market in the global landscape for power factor correction units. It is characterized by rapid industrialization, burgeoning energy demands, and an increasing focus on energy efficiency. This vast and diverse region, encompassing various rapidly evolving economies, presents a favorable market scenario for the power factor correction industry.
- Industrialization is the primary driver for adopting power factor correction units across Asia-Pacific. The region's position as a global manufacturing powerhouse, spanning automotive, electronics, textiles, and heavy industries, necessitates sophisticated power management solutions. With these countries' rapidly rising industrial segment, the demand for power correction factor units is expected to increase significantly.
- For instance, in the financial year 2023, India's manufacturing exports hit a record high, reaching USD 447.46 billion, marking a 6.03% growth from the previous year's (FY22) USD 422 billion. The manufacturing industry, contributing to 17% of India's GDP and employing over 27.3 million workers, is pivotal in the nation's economy. With various initiatives and policies, the Indian government aims to elevate manufacturing's market share to 25% by 2025.
- With their substantial reactive power demands, these energy-intensive industries are increasingly turning to power factor correction technologies to optimize their electrical systems, reduce operational costs, and comply with stringent energy efficiency regulations. The push for industrial upgrades and the adoption of advanced manufacturing technologies further accentuate the need for reliable power factor correction solutions.
- Urbanization and infrastructure development across Asia-Pacific have significantly contributed to the growing demand for power factor correction units. Rapid city expansion and the establishment of industrial parks and special economic zones have placed unprecedented strain on existing power infrastructures. This has led to a heightened focus on power quality improvement and grid stability, with power factor correction playing a crucial role in mitigating transmission losses and enhancing overall electrical system efficiency.
- For instance, in October 2023, the Malaysian government unveiled plans to invest substantially in the establishment of four new industrial parks in Perak. A standout among these is the Automotive High-Tech Valley (AHTV) in Tanjung Malim, designed as a pivotal move to rejuvenate Malaysia's automotive industry. Forecasts suggest this venture will draw in a staggering USD 6.7 billion in investments over the coming decade. Not only will this initiative create thousands of job opportunities, but it also aims to position Malaysia as a leader in the regional production of state-of-the-art vehicles.
- Moreover, the concept of smart cities, gaining traction across the region, incorporates advanced power management systems, including intelligent power factor correction units, as integral components of urban electrical infrastructure.
- Therefore, as mentioned above, Asia-Pacific is expected to dominate the market during the forecast period.
Global Power Factor Correction Units Industry Overview
The global power factor correction units market is semi-fragmented. Some of the key players in this market (in no particular order) are ABB Ltd, Siemens AG, General Electric Company, Schneider Electric SE, and Eaton Corporation.
Additional Benefits:
- The market estimate (ME) sheet in Excel format
- 3 months of analyst support
TABLE OF CONTENTS
1 INTRODUCTION
- 1.1 Scope of the Study
- 1.2 Market Definition
- 1.3 Study Assumptions
2 EXECUTIVE SUMMARY
3 RESEARCH METHODOLOGY
4 MARKET OVERVIEW
- 4.1 Introduction
- 4.2 Market Size and Demand Forecast in USD, till 2029
- 4.3 Recent Trends and Developments
- 4.4 Government Policies and Regulations
- 4.5 Market Dynamics
- 4.5.1 Drivers
- 4.5.1.1 Rapid Industrial Growth
- 4.5.1.2 Stringent Regulatory Standards
- 4.5.2 Restraints
- 4.5.2.1 Maintenance abd Technical Challenges
- 4.5.1 Drivers
- 4.6 Supply Chain Analysis
- 4.7 Industry Attractiveness - Porter's Five Forces Analysis
- 4.7.1 Bargaining Power of Suppliers
- 4.7.2 Bargaining Power of Consumers
- 4.7.3 Threat of New Entrants
- 4.7.4 Threat of Substitutes Products and Services
- 4.7.5 Intensity of Competitive Rivalry
- 4.8 Investment Analysis
5 MARKET SEGMENTATION
- 5.1 Type
- 5.1.1 Active Power Factor Correction Unit
- 5.1.2 Passive Power Factor Correction Unit
- 5.1.3 Hybrid Power Factor Correction Unit
- 5.2 End Users
- 5.2.1 Residential
- 5.2.2 Commercial
- 5.2.3 Industrial
- 5.3 Geography [Market Size and Demand Forecast till 2029 (for regions only)]
- 5.3.1 North America
- 5.3.1.1 United States
- 5.3.1.2 Canada
- 5.3.1.3 Rest of North America
- 5.3.2 Europe
- 5.3.2.1 Germany
- 5.3.2.2 France
- 5.3.2.3 United Kingdom
- 5.3.2.4 Italy
- 5.3.2.5 Spain
- 5.3.2.6 NORDIC
- 5.3.2.7 Russia
- 5.3.2.8 Turkey
- 5.3.2.9 Rest of Europe
- 5.3.3 Asia-Pacific
- 5.3.3.1 China
- 5.3.3.2 India
- 5.3.3.3 Australia
- 5.3.3.4 Japan
- 5.3.3.5 South Korea
- 5.3.3.6 Malaysia
- 5.3.3.7 Thailand
- 5.3.3.8 Indonesia
- 5.3.3.9 Vietnam
- 5.3.3.10 Rest of Asia-Pacific
- 5.3.4 Middle East and Africa
- 5.3.4.1 Saudi Arabia
- 5.3.4.2 United Arab Emirates
- 5.3.4.3 Nigeria
- 5.3.4.4 Egypt
- 5.3.4.5 Qatar
- 5.3.4.6 South Africa
- 5.3.4.7 Rest of Middle East and Africa
- 5.3.5 South America
- 5.3.5.1 Brazil
- 5.3.5.2 Argentina
- 5.3.5.3 Colombia
- 5.3.5.4 Rest of South America
- 5.3.1 North America
6 COMPETITIVE LANDSCAPE
- 6.1 Mergers and Acquisitions, Joint Ventures, Collaborations, and Agreements
- 6.2 Strategies Adopted by Leading Players
- 6.3 Company Profiles
- 6.3.1 ABB Ltd
- 6.3.2 Schneider Electric SE
- 6.3.3 Eaton Corporation
- 6.3.4 Siemens AG
- 6.3.5 General Electric Company
- 6.3.6 Emerson Electric Co.
- 6.3.7 Mitsubishi Electric Corporation
- 6.3.8 Toshiba Electronic Devices & Storage Corporation
- 6.3.9 Crompton Greaves Limited
- 6.3.10 L&T Electrical & Automation
- 6.4 List of Other Prominent Companies
- 6.5 Market Ranking/Share (%) Analysis
7 MARKET OPPORTUNITIES AND FUTURE TRENDS
- 7.1 Smart Grid Development
