|
시장보고서
상품코드
1636250
유럽의 컨테이너 운송 : 시장 점유율 분석, 산업 동향 및 통계, 성장 예측(2025-2030년)Europe Container Drayage - Market Share Analysis, Industry Trends & Statistics, Growth Forecasts (2025 - 2030) |
||||||
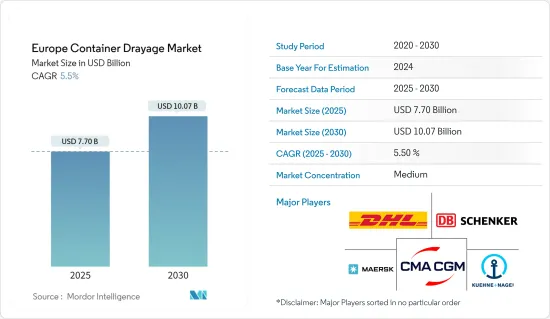
유럽의 컨테이너 운송 시장 규모는 2025년 77억 달러로 추정 및 예측되며, 예측 기간(2025-2030년) 동안 5.5%의 CAGR로 2030년에는 100억 7,000만 달러에 달할 것으로 예상됩니다.
주요 하이라이트
- 유럽 컨테이너 운송 시장은 무역 성장, 인프라 개발, 기술 발전, 지속가능한 노력에 의해 주도되고 있습니다.
- 유럽 항구를 통과하는 국제 무역과 컨테이너 화물의 증가는 컨테이너 운송 시장의 주요 촉진요인으로 작용하고 있습니다. 유럽은 강력한 회복세를 보이고 있으며, 2024년 수출 성장률은 2.2%로 2023년 0.4%에서 크게 상승할 것으로 예상됩니다. 이에 따라 2023년 감소했던 수입 무역량은 2024년 1.6% 회복될 것으로 예상됩니다.
- 금리 상승, 인플레이션 급등, 우크라이나 분쟁 장기화, 세계 수요 침체 등의 문제가 2023년 유럽의 교역량을 압박했습니다. 그러나 2024년에는 금리 완화가 예상됨에 따라 경제활동이 회복되어 유럽의 수출 수요에 박차를 가할 것으로 예상됩니다.
- 2023년 유럽의 국경 간 E-Commerce 시장은 2022년 대비 32% 증가한 2,370억 유로(2,565억 4,000만 달러)의 매출을 기록할 것으로 예상됩니다. 유럽 온라인 소매업체들은 이 국경 간 EC 총액 1,070억 유로(1,158억 2,000만 달러)에 기여하고 있습니다. 더 광범위한 유럽 B2C E-Commerce 시장도 번창하여 매출액이 7,410억 유로(8,020억 9,000만 달러)에 달해 13% 증가하며 눈에 띄는 성장을 보였습니다. 국경 간 거래는 유럽 전체 온라인 판매의 32%를 차지하게 되었습니다.
- 인프라, 특히 도로망, 항만, 복합운송시설에 대한 투자는 컨테이너 운송 서비스의 원활한 운영을 보장하는 데 매우 중요하며, 이를 통해 시장이 발전하고 있습니다.
유럽의 컨테이너 운송 시장 동향
크로스보더 E-Commerce가 컨테이너 수요를 견인
2023년 유럽의 국경 간 E-Commerce 시장은 큰 폭으로 성장하여 2022년 대비 32% 증가한 2,370억 유로(2,565억 4,000만 달러)에 달할 것으로 예상됩니다. 유럽 온라인 소매업체는 매우 중요한 역할을 수행하여 국경 간 EC 총액이 1,070억 유로(1,158억 2,000만 달러)에 달했습니다. 보다 광범위한 유럽 B2C E-Commerce 시장도 번창하여 13% 성장한 7,410억 유로(8,020억 9,000만 달러)의 매출을 달성했습니다. 주목할 만한 점은 국경 간 거래가 유럽 전체 온라인 판매의 32%를 차지했다는 점입니다.
독일 온라인 소매업체가 주도한 국경 간 매출은 28% 증가한 430억 유로(465억 4,000만 달러)를 기록했습니다. 반면 영국은 1.8% 소폭 감소하여 국경 간 매출이 275억 유로(297억 7,000만 달러)로 2022년 280억 유로(303억 1,000만 달러)에서 감소했습니다.
프랑스 온라인 상점은 눈에 띄는 30%의 급격한 증가를 기록했으며, 국경 간 매출은 320억 유로(346억 4 천만 달러)에 달했습니다. 또한 스페인 플랫폼은 50% 증가한 180억 유로(194억 8,000만 달러)를 기록했고, 네덜란드 플랫폼도 45% 증가한 70억 유로(75억 8,000만 달러)로 큰 폭의 성장을 보였습니다.
2023년에는 의류와 신발이 유럽 크로스보더 E-Commerce에서 가장 중요한 제품 카테고리로 부상할 것으로 보입니다. 조사 대상자의 60%가 국제 온라인 플랫폼을 통해 이 카테고리의 상품을 구매하기를 강력히 희망하고 있는 것으로 나타났습니다. 반면, 가전제품은 2위를 차지했으며, 응답자의 27%만이 해외 조달을 희망했습니다.
컨테이너 운송 서비스의 허브로 부상하고 있는 이탈리아
이탈리아의 항구는 국내 항만 생태계에서 독특한 이중적 기능을 자랑합니다. 많은 국가와 마찬가지로 항구는 주로 수출입 활동을 촉진하는 반면, 이탈리아의 항구는 남유럽의 중요한 허브 역할을 수행함으로써 그 특징을 두드러지게 하고 있습니다.
지리적으로 이탈리아 반도는 유럽과 마그레브 동부의 가교 역할을 할 뿐만 아니라 지중해의 중심부로 가는 중요한 관문 역할을 하고 있습니다. 특히 수에즈 운하 출구와 지브롤터 해협을 연결하는 지중해의 주요 해상 루트는 이탈리아 해안 근처를 통과합니다.
또한, 이탈리아의 항구는 헝가리, 오스트리아, 스위스 등 중부 유럽 내륙 국가들과 강한 유대관계를 형성하고 있습니다. 특히 트리에스테는 오스트리아와 헝가리의 관문 역할을 하고 있습니다.
이탈리아에는 반도 본토와 사르데냐, 시칠리아 섬에 20개의 항구가 있으며, 2023년 주요 항구의 총 관리량은 1,103만 TEU로 2022년 대비 6.3% 감소했습니다. 그러나 이 수치는 2020년과 2021년의 수송량을 초과합니다. 주목할 만한 점은 이러한 하락세가 유럽 전체의 추세를 반영하여 2023년에는 거의 모든 주요 컨테이너 항구가 후퇴에 직면했다는 점입니다.
2023년 이탈리아는 프랑스의 2배에 가까운 컨테이너 물동량을 기록하여 약 500만 TEU를 처리했습니다. 놀랍게도 비슷한 항만 수에도 불구하고 이탈리아가 프랑스보다 더 많은 컨테이너를 처리한 것으로 나타났습니다. 주목할 만한 것은 지오이아 타우로, 제노아, 라 스페치아 등 이탈리아의 3개 항구가 독점적인 '백만장자 클럽'에 가입한 것. 지오이아 타우로가 주요 항구로 번창하는 반면, 제노아와 라 스페치아는 주로 내륙으로 이어지는 중요한 연결고리 역할을 하고 있습니다.
특히 지오이아 타우로(Gioia Tauro)는 2023년에 빛을 발하며 5%의 수송량 증가를 기록했습니다. 항만 당국은 이러한 급격한 증가의 이유를 MSC가 이 터미널에서 차지하는 비중에서 찾고 있습니다. 원래 Contship에 의해 개발된 Gioia Tauro 터미널은 Maersk가 지분을 인수하는 등 변천을 거쳐 결국 MSC 그룹의 매우 중요한 허브가 되었으며, 이는 지중해에서 스위스 기업의 골격을 굳건히 하는 움직임이 되었습니다.
유럽의 컨테이너 운송 산업 개요
유럽 컨테이너 운송 시장은 몇몇 주요 기업들이 지배하고 있습니다. 세계 물류 대기업부터 지역 기업, 중소기업에 이르기까지 다양한 업체들이 있습니다. 주목할만한 이름으로는 CMA CGM 및 Maersk Line과 같은 업계 거인들과 함께 DHL, DB Schenker, Kuehne Nagel이 있습니다.
유럽 컨테이너 화물 운송 시장의 주요 동향으로는 디지털 운영으로의 전환, 친환경 관행에 대한 관심 증가, 실시간 모니터링을 위한 IoT와 텔레매틱스의 통합, 복합운송 솔루션에 대한 선호도 증가 등이 있습니다. 이러한 추세는 시장 환경을 크게 변화시키고 있습니다.
기타 혜택
- 엑셀 형식의 시장 예측(ME) 시트
- 3개월간 애널리스트 지원
목차
제1장 소개
- 조사 가정
- 조사 범위
제2장 조사 방법
- 분석 방법
- 조사 단계
제3장 주요 요약
제4장 시장 역학과 인사이트
- 현재 시장 시나리오
- 시장 역학
- 성장 촉진요인
- 시장을 견인하는 국제 무역 증가
- 환경 유지의 중요성 상승이 시장을 견인
- 성장 억제요인
- 시장에 영향을 미치는 규제 요인
- 시장에 영향을 미치는 인프라 과제
- 기회
- 시장을 견인하는 기술의 진보
- 성장 촉진요인
- 밸류체인/공급망 분석
- 정부 규제, 무역 협정, 이니셔티브
- 산업의 매력 - Porter's Five Forces 분석
- 공급 기업의 교섭력
- 소비자의 협상력
- 신규 참여업체의 위협
- 대체품의 위협
- 경쟁 기업 간의 경쟁 강도
- 지정학과 COVID-19 팬데믹이 시장에 미치는 영향
제5장 시장 세분화
- 운송 수단별
- 철도
- 도로
- 기타 운송 수단
- 국가별
- 독일
- 프랑스
- 영국
- 스페인
- 기타 유럽
제6장 경쟁 구도
- 시장 집중 개요
- 기업 개요
- DHL
- DB Schenker
- Kuehne+Nagel
- CMA CGM
- Maersk Line
- Hapag-Lloyd
- MSC(Mediterranean Shipping Company)
- COSCO Shipping
- Evergreen Marine
- Yang Ming*
- 기타 기업
제7장 시장 전망
제8장 부록
- GDP 분포(활동별, 지역별)
- 자본 플로우 인사이트
The Europe Container Drayage Market size is estimated at USD 7.70 billion in 2025, and is expected to reach USD 10.07 billion by 2030, at a CAGR of 5.5% during the forecast period (2025-2030).

Key Highlights
- The European container drayage market is driven by trade growth, infrastructure development, technological advancements, and sustainable initiatives.
- The increasing volume of international trade and containerized cargo moving through European ports is a significant driver for the container drayage market. Europe is poised for a robust recovery, with export growth projected to surge by 2.2% in 2024, marking a significant uptick from the 0.4% growth in 2023. Correspondingly, after a dip in 2023, import trade volumes have been forecast to rebound by 1.6% in 2024.
- Challenges, including elevated interest rates, surging inflation, the prolonged conflict in Ukraine, and weakened global demand, weighed heavily on European trade volumes in 2023. However, with a projected easing of interest rates in 2024, economic activity is anticipated to rebound, spurring demand for European exports.
- In 2023, the European cross-border e-commerce market surged, hitting a turnover of EUR 237 billion (USD 256.54 billion), a remarkable 32% leap from 2022. European online retailers have been instrumental in contributing EUR 107 billion (USD 115.82 billion) to this cross-border total. The broader European B2C e-commerce market also flourished, culminating in a turnover of EUR 741 billion (USD 802.09 billion), up by a notable 13%. Cross-border transactions notably comprised 32% of all online sales in Europe.
- Investments in infrastructure, particularly in road networks, ports, and intermodal facilities, are pivotal for ensuring the seamless operation of container drayage services, thereby driving the market forward.
Europe Container Drayage Market Trends
Demand for Containers Driven by Cross-border E-commerce
In 2023, the European cross-border e-commerce market witnessed a significant surge, reaching a turnover of EUR 237 billion (USD 256.54 billion), marking a notable 32% leap over 2022. European online retailers played a pivotal role, contributing EUR 107 billion (USD 115.82 billion) to this cross-border total. The broader European B2C e-commerce market also thrived, achieving a turnover of EUR 741 billion (USD 802.09 billion), reflecting a substantial 13% increase. Notably, cross-border transactions accounted for 32% of all online sales in Europe.
German online retailers led the way, achieving a substantial 28% increase in cross-border sales, totaling EUR 43 billion (USD 46.54 billion). In contrast, the United Kingdom experienced a slight dip of 1.8%, with cross-border sales amounting to EUR 27.5 billion (USD 29.77 billion), down from EUR 28 billion (USD 30.31 billion) in 2022.
French online stores saw a notable 30% surge, reaching EUR 32 billion (USD 34.64 billion) in cross-border sales. Additionally, Spanish platforms witnessed a significant 50% rise, reaching EUR 18 billion (USD 19.48 billion), while Dutch platforms also experienced a substantial uptick, hitting EUR 7 billion (USD 7.58 billion), marking a 45% increase.
In 2023, clothing and footwear emerged as the dominant product category in European cross-border e-commerce. A significant 60% of respondents surveyed extensively revealed a strong preference for purchasing items from this category through international online platforms. In contrast, consumer electronics secured the second spot, with only 27% of respondents opting to procure these goods from overseas.
Italy Emerging as a Lucrative Hub for Container Drayage Services
Italian ports boast a unique dual function within the nation's port ecosystem. While, like in most countries, they primarily facilitate import and export activities, Italian ports distinguish themselves by assuming a pivotal role as key hubs in southern Europe.
Geographically, Italy's peninsula not only bridges Europe with the eastern Maghreb but also serves as a prominent gateway to the heart of the Mediterranean. Notably, the primary maritime route in the Mediterranean, linking the Suez Canal's exit with the Strait of Gibraltar, runs near Italy's coast.
Furthermore, Italian ports have cultivated strong ties with Central European landlocked nations like Hungary, Austria, and Switzerland. Among these connections, Trieste emerges as the premier port, serving as the gateway to Austria and Hungary.
Italy boasts 20 ports spread across its mainland peninsula and the islands of Sardinia and Sicily. In 2023, the primary ports collectively managed 11.03 million TEUs, marking a 6.3% dip over 2022. However, this figure still surpassed the volumes seen in both 2020 and 2021. Notably, this decline mirrors a broader European trend, with nearly all major container ports facing setbacks in 2023.
In 2023, Italy managed nearly double the container traffic of France, handling around 5 million TEUs. Surprisingly, despite having a similar number of ports, Italy outpaced France. Notably, three Italian ports - Gioia Tauro, Genoa, and La Spezia - joined the exclusive 'millionaire club.' While Gioia Tauro thrives as a primary hub, Genoa and La Spezia primarily serve as crucial links to the hinterland.
Gioia Tauro, in particular, shone in 2023, boasting a 5% growth in its traffic. The port's authority attributed this surge to the significant presence of MSC at the terminal. Originally developed by Contship, the terminal at Gioia Tauro saw a transition, with Maersk acquiring a stake before it eventually became a pivotal hub for the MSC group, a move that solidified the Swiss company's foothold in the Mediterranean.
Europe Container Drayage Industry Overview
The European container drayage market is dominated by some key players. It boasts a diverse mix, ranging from major global logistics firms to regional players and a host of small to medium-sized enterprises. Noteworthy names include DHL, DB Schenker, and Kuehne + Nagel, alongside industry behemoths like CMA CGM and Maersk Line.
Key trends in the European container drayage market encompass a shift toward digital operations, a growing focus on eco-friendly practices, the integration of IoT and telematics for real-time monitoring, and a rising preference for intermodal transportation solutions. These trends are significantly altering the market's landscape.
Additional Benefits:
- The market estimate (ME) sheet in Excel format
- 3 months of analyst support
TABLE OF CONTENTS
1 INTRODUCTION
- 1.1 Study Assumptions
- 1.2 Scope of the Study
2 RESEARCH METHODOLOGY
- 2.1 Analysis Methodology
- 2.2 Research Phases
3 EXECUTIVE SUMMARY
4 MARKET DYNAMICS AND INSIGHTS
- 4.1 Current Market Scenario
- 4.2 Market Dynamics
- 4.2.1 Drivers
- 4.2.1.1 Increasing International Trade Driving the Market
- 4.2.1.2 Increasing Importance of Environmental Sustainability Driving the Market
- 4.2.2 Restraints
- 4.2.2.1 Regulatory Factors Affecting the Market
- 4.2.2.2 Infrastructure Challenges Affecting the Market
- 4.2.3 Opportunities
- 4.2.3.1 Technological Advancements Driving the Market
- 4.2.1 Drivers
- 4.3 Value Chain/Supply Chain Analysis
- 4.4 Government Regulations, Trade Agreements, and Initiatives
- 4.5 Industry Attractiveness - Porter's Five Forces Analysis
- 4.5.1 Bargaining Power of Suppliers
- 4.5.2 Bargaining Power of Consumers
- 4.5.3 Threat of New Entrants
- 4.5.4 Threat of Substitute Products
- 4.5.5 Intensity of Competitive Rivalry
- 4.6 Impact of Geopolitics and the COVID-19 Pandemic on the Market
5 MARKET SEGMENTATION
- 5.1 By Mode of Transport
- 5.1.1 Rail
- 5.1.2 Road
- 5.1.3 Other Modes of Transport
- 5.2 By Country
- 5.2.1 Germany
- 5.2.2 France
- 5.2.3 United Kingdom
- 5.2.4 Spain
- 5.2.5 Rest of Europe
6 COMPETITIVE LANDSCAPE
- 6.1 Market Concentration Overview
- 6.2 Company Profiles
- 6.2.1 DHL
- 6.2.2 DB Schenker
- 6.2.3 Kuehne + Nagel
- 6.2.4 CMA CGM
- 6.2.5 Maersk Line
- 6.2.6 Hapag-Lloyd
- 6.2.7 MSC (Mediterranean Shipping Company)
- 6.2.8 COSCO Shipping
- 6.2.9 Evergreen Marine
- 6.2.10 Yang Ming*
- 6.3 Other Companies
7 FUTURE OF THE MARKET
8 APPENDIX
- 8.1 GDP Distribution, by Activity and Region
- 8.2 Insights into Capital Flows